Fibonacci Fan
A fibonacci fan is a set of diagonal lines drawn from one swing point through the retracement levels of the first leg, the ratios laid out as rising or falling lines instead of horizontals. Each line becomes a dynamic reference the trend can lean on as price moves away in both price and time. Where the horizontal retracement set says "watch these prices," the fan says "watch these prices as they travel forward," so the same 38.2, 50, and 61.8 levels become moving targets that rise with a healthy trend.

The shape is easiest to picture as a hand of cards spread from a single held point, every card hinged at the same corner and fanned out at its own angle, the spread opened once and read as one shape. The seasonal lesson read rhythms on the calendar, cycles the market keeps with dates. This lesson returns to the chart and tilts the retracements, the same ratios drawn as diagonals from one anchor. Nothing new is being measured. Only the orientation changed.
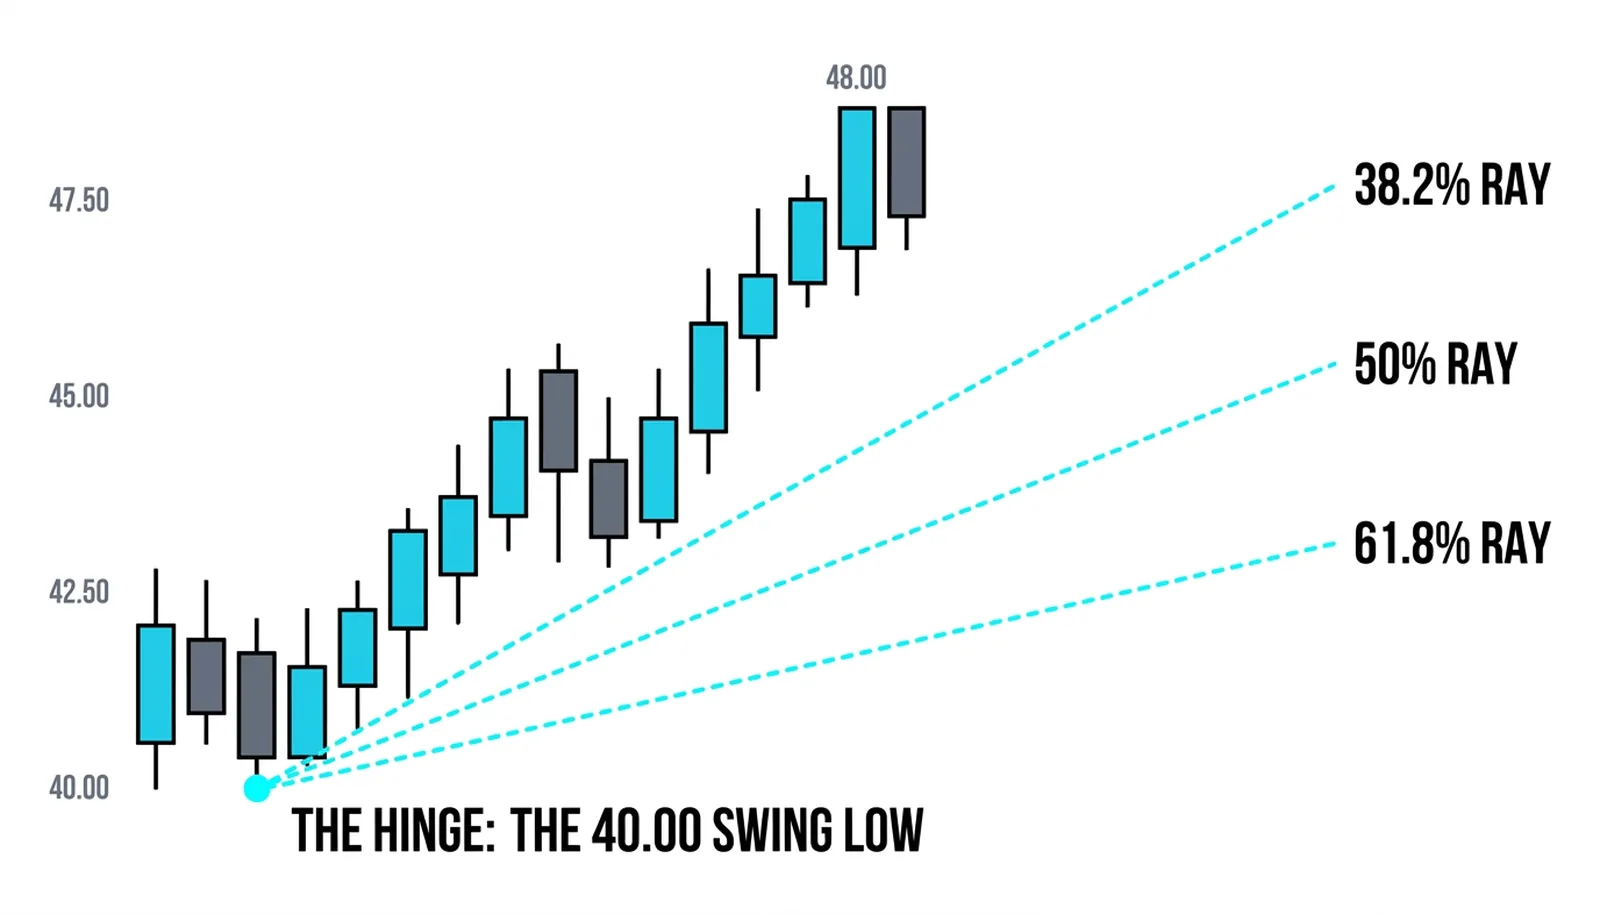
Three Lines from One Hinge
The fan needs two things: a significant swing point as the hinge, and a completed first leg whose retracement levels set the angles. Everything else is drafting. Pick the swing, measure the leg, and the tool does the rest.
The hinge must be a swing that matters. In an uptrend, that is the low where the leg began, a turning point the market defended with real volume and real distance. A wiggle inside a range does not qualify. A fan drawn from a minor swing multiplies lines without adding evidence, because the angles inherit the importance of the point they spring from.
From that hinge, draw lines through the 38.2, 50, and 61.8 percent retracement prices of the completed leg, then extend them forward. In an uptrend the result is three rising lines, each a diagonal support the pullback can test in turn. In a downtrend the same construction falls from the swing high, three descending lines acting as resistance.
- The hinge: one significant swing point, the origin of every line.
- The leg: a completed directional move whose height defines the ratios.
- The angles: lines from the hinge through 38.2, 50, and 61.8 percent of the leg.
- The extension: each line projected forward so it keeps rising through time.
The cluster method treats these ratios as zones where price and time meet, and the fan is the same idea with a slope attached. The ratio is the constant. The diagonal is the delivery.
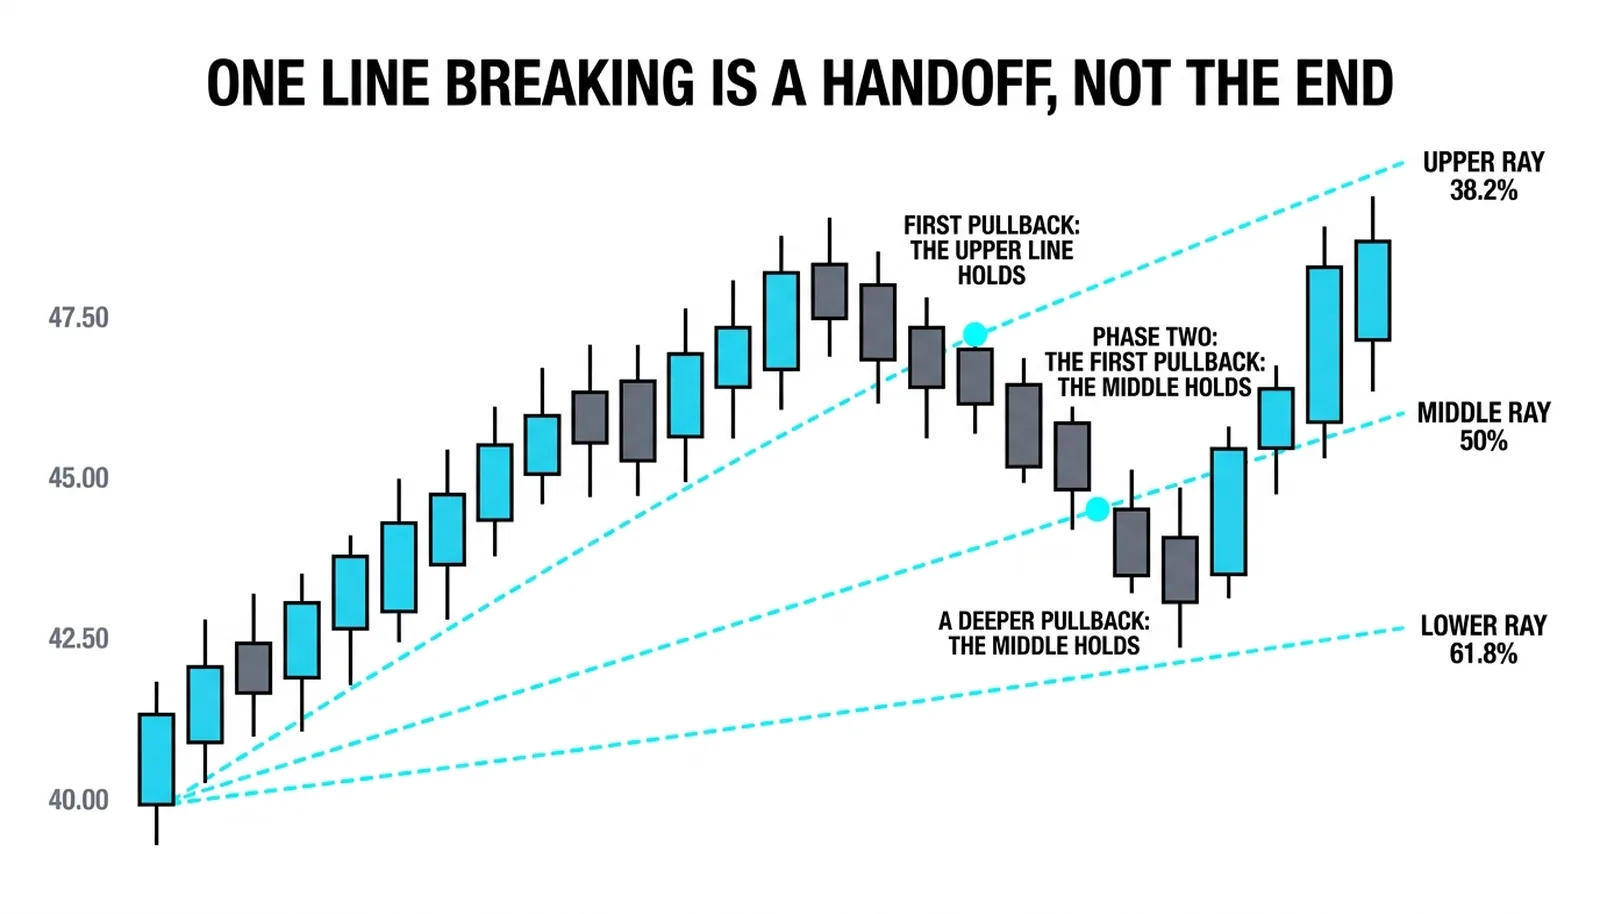
Reading the Spread
The reading rule is sequential. Price rides above the fan in a healthy trend. The first pullback tests the upper line. A deeper pullback tests the middle. A break of one line hands the watch to the next without ending the trend by itself. The fan degrades one line at a time, and each handoff is information about how much energy the trend has left.
Think of the three lines as successive offers of support at increasing depth. A trend that holds the upper line is strong and shallow in its corrections. A trend that needs the middle line is still healthy but slowing. A trend living on the lowest line is one step from losing the fan entirely.
The price action canon adds the health reading: the fan's slope carries information. A trend pressing against a steeply rising fan is running faster than it can sustain, and steep lines break before shallow ones. When price hugs the steepest line and that line gives way, the drop to the next line is often fast, because the crowd that bought the steep pace exits together.
Now the honesty. The fan's angles depend on the chart's scale. The same prices spread differently on a squashed chart, wider on a stretched one. A line that looks like a clean 45 degrees on your screen is a different angle on someone else's. So the fan is read by the order of its lines and the touches against them, never by the degrees. Any platform that lets you resize the axis is quietly redrawing your angles, and the market does not care about your pixels.
What survives every rescaling is the sequence: which line price touched, in what order, and what happened at the touch. That is the durable signal. The angle is decoration.
Trading the Fan Lines
The standard trade waits for the pullback to reach a fan line and show a reaction, then enters with the reversal. The middle line is the workhorse: deep enough to offer a price advantage over chasing, shallow enough that the trend is usually intact. The stop belongs below the next line down, because that line is the level whose loss would prove the entry wrong.
Entry logic, stated plainly:
- Price touches a fan line and prints a reversal candle that closes back above it.
- Enter on that close or on the break of the reversal candle's high.
- Stop sits below the next fan line down, the level whose break kills the idea.
- First target is the prior swing high, the origin of the pullback.
The failure mode matters as much as the entry. A close through the lowest fan line ends the shape. Not a wick, a close. When that happens, the fan's read of the trend is over, and the next reference is not another line of the fan. It is the horizontal retracement set drawn the old way, because a fan that loses its lowest line has lost the slope the trend was leaning on. Redrawing the fan from a new point to rescue the trade is curve-fitting in real time.
Do not stack trades at every line on the way down. Each handoff is a warning, and the trader who buys all three lines has simply averaged into a breakdown with extra steps.
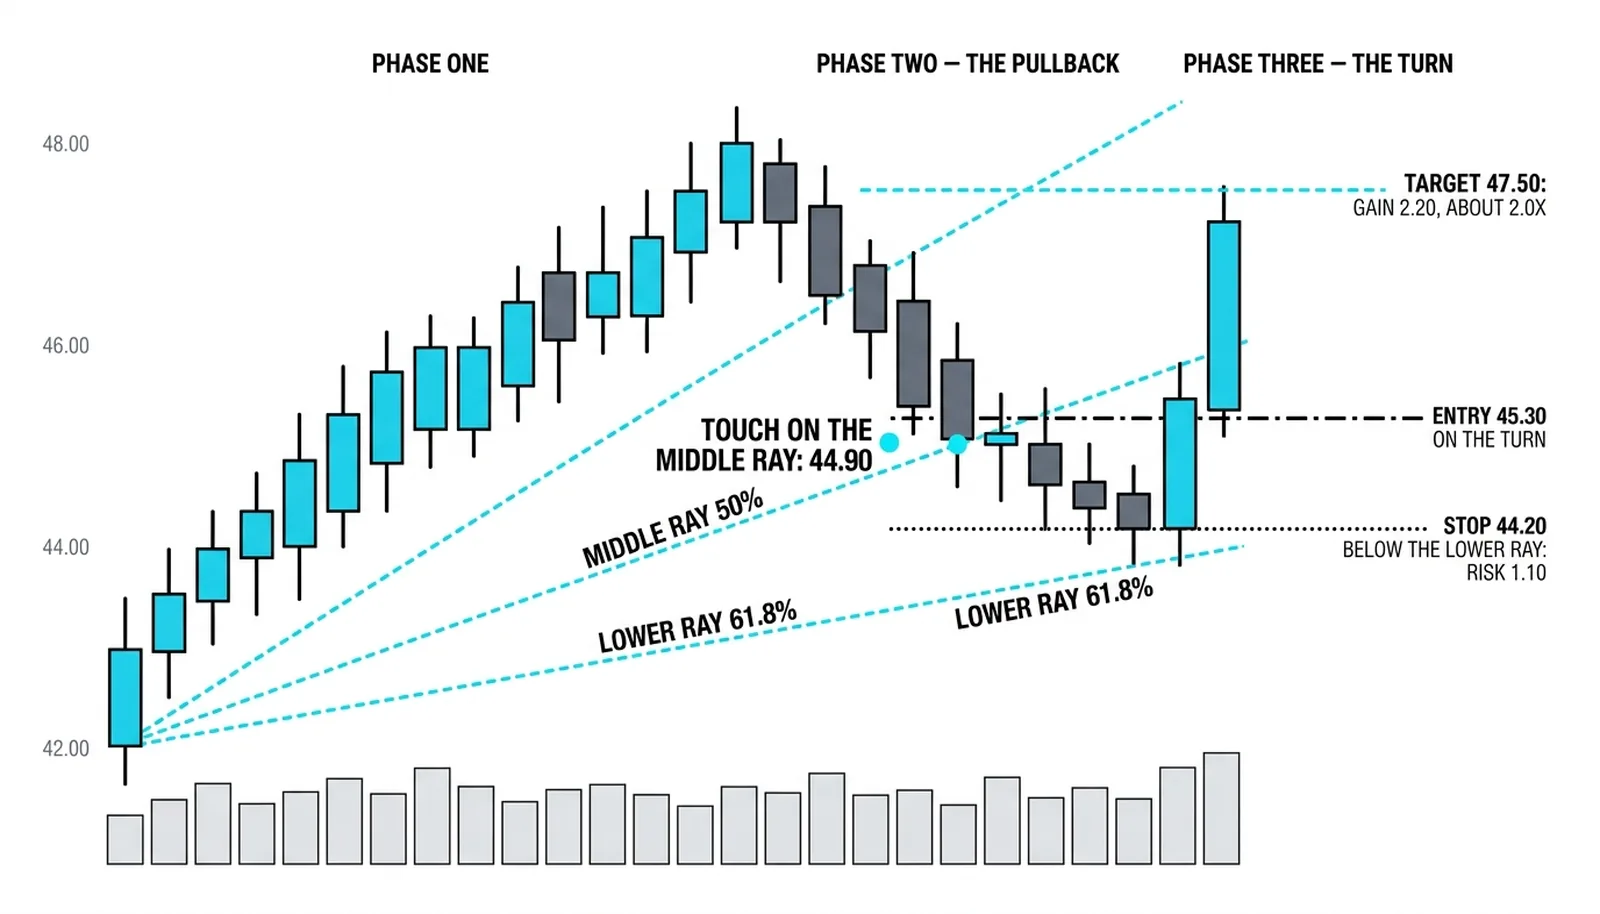
The Middle Line at 44.90
A worked example, all numbers hypothetical and round. A market runs a leg of 8.00 points, from 40.00 to 48.00, in thirteen bars. The fan is drawn from the 40.00 low through the leg's retracements, producing three rising lines.
Two weeks later, price pulls back and lands on the middle line, the one drawn through the 50 percent level. That line stands at 44.90 at the touch bar. The reversal candle closes at 45.20. The long is taken at 45.30 on the close, the stop at 44.20, just below the lower fan line, which stands at 44.30 at the same bar. Risk is 1.10 per unit.
The first target is 47.50, just under the old high at 48.00. If reached, the gain is 2.20, about 2.0 times the risk. Clean, defined, and every number anchored to a line or a swing rather than a feeling.
The failed version: instead of holding, price closes at 43.80, straight through the lowest line. The fan's read of the trend is dead. The stop at 44.20 has already done its job, the loss is the planned 1.10, and the next reference is the horizontal retracement set, not a redrawn fan. The trade was small, the information was clear, and the account moves on.
| Line | Origin of the Angle | What It Defends | Handoff When It Breaks |
|---|---|---|---|
| Upper line | 38.2% retracement of the leg, from the hinge | The fastest pace of the trend | Watch passes to the middle line; trend still healthy but slower |
| Middle line | 50% retracement of the leg, from the hinge | The standard pullback depth | Watch passes to the lower line; trend on its last fan support |
| Lower line | 61.8% retracement of the leg, from the hinge | The deepest correction the slope allows | A close below ends the fan; revert to horizontal retracements |
| The hinge itself | The original swing point | The entire leg's origin | A break of the hinge voids the leg, the fan, and the trend thesis |
Fan Questions, Answered
What is a fibonacci fan?
A fibonacci fan is a set of diagonal lines drawn from one significant swing point through the 38.2, 50, and 61.8 percent retracement levels of the first leg, extended forward so each line acts as moving support or resistance. It converts the static retracement ratios into references that travel with price through time.
How do you draw a fibonacci fan?
Pick a significant swing point as the hinge, identify the completed leg that followed, and draw lines from the hinge through the leg's 38.2, 50, and 61.8 percent retracement prices, then extend them forward. Most platforms have a dedicated tool: click the swing low, click the leg high, and the three lines appear. The skill is in choosing a hinge that matters, not in the clicking.
What does it mean when price breaks a fan line?
A break hands the watch to the next line down, and nothing more. One broken line does not end the trend; it tells you the trend's pace has slowed. Only a close through the lowest line ends the fan's read, at which point the horizontal retracement set takes over as the reference.
Do fan angles work on every chart scale?
No, and this is the fan's honest weakness. The visual angles change whenever the chart is resized, so degrees are meaningless across screens. What holds on every scale is the order of the lines and the touches against them. Read the sequence and the reactions, never the slope in degrees.
The fan closes the time section's drawn tools, but the arcs take the same hinge and bend it into curves, measuring how long a trend should take to correct rather than how far. That lesson is next, and it changes the question from where to when.