Fibonacci Arc
A fibonacci arc is a retracement drawn as a curve: the radius set by the retracement distance of the leg, the curve swept from the swing point, so that one line reports at once where price is and how much time the pullback has spent. A horizontal retracement line waits at one price no matter how long the journey takes. The arc refuses that patience. It moves through price and time together, and a pullback that stalls sideways meets the curve later and higher than a pullback that drops fast.

Think of a compass: the point pinned at the swing, the pencil swinging at a fixed radius, every place on the curve exactly the same distance from the pin. The fan lesson tilted the ratios into straight diagonals; this lesson bends them, sweeping the same retracement distances as curves that cross future bars at a price and a bar together. The geometry is the same family. The output is different, because the arc punishes slow pullbacks in a way the fan's straight line does not.
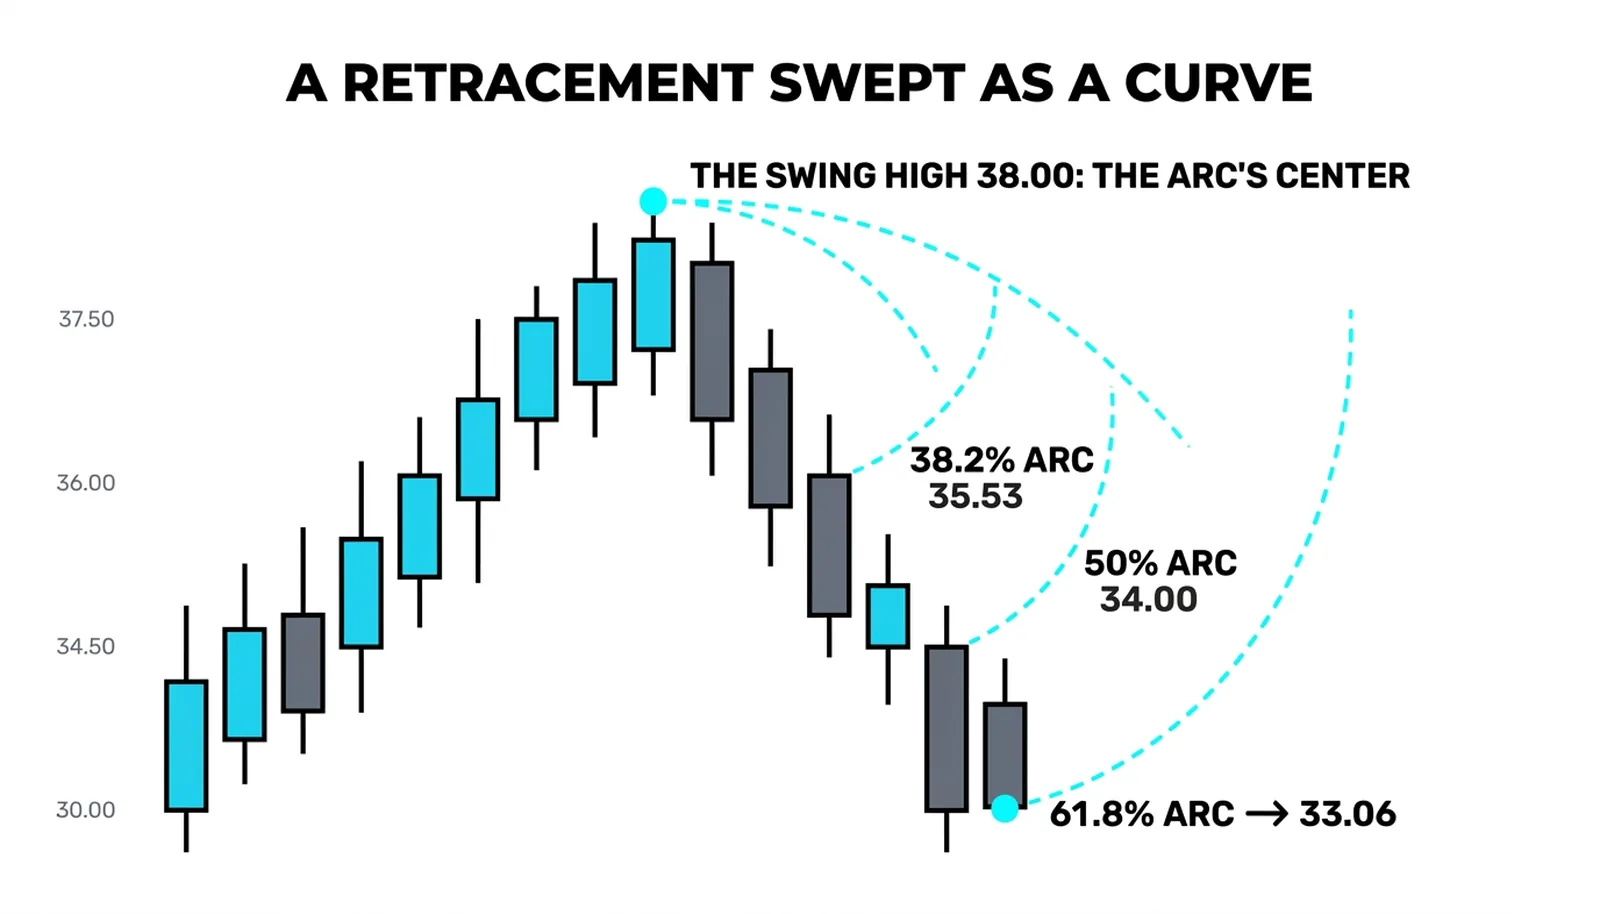
A Radius from the Swing
Anchoring is simple. Mark the swing high of a completed rally. Set each radius at a retracement of the leg: the 38.2 arc reaches 38.2 percent of the leg back down at its lowest point, the 61.8 arc reaches 61.8 percent. Sweep the curves forward from the anchor and let them run into the future bars.
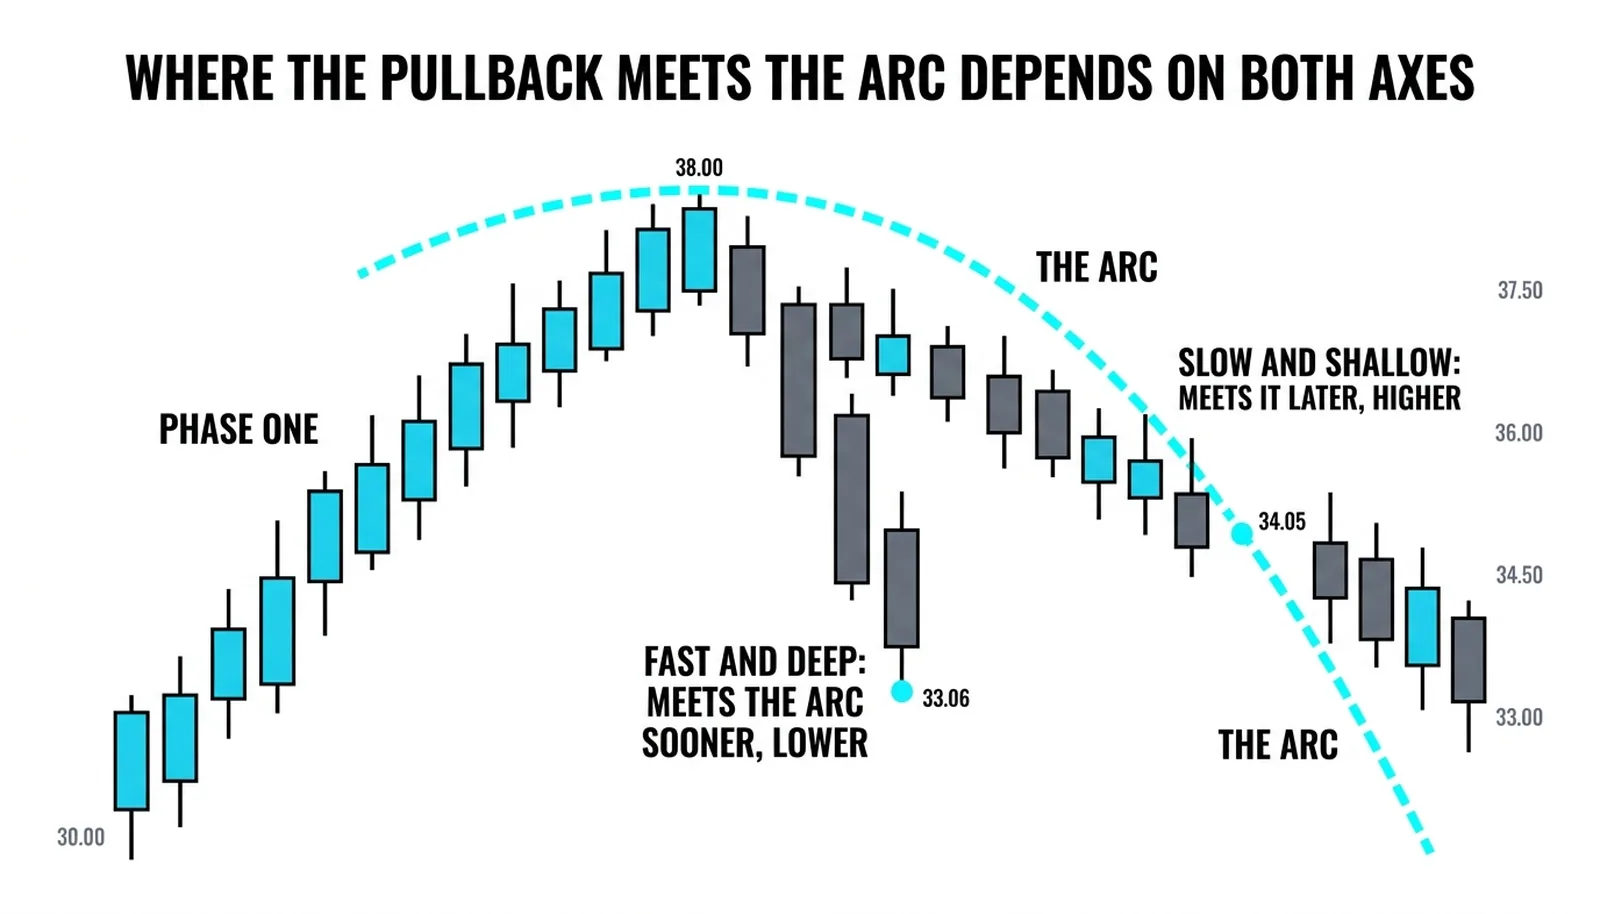
What the curve reports that a line does not is the pairing. Every point on the arc is a price and a bar at the same time. A pullback that drifts sideways meets the arc later and higher. A fast, deep pullback meets it sooner and lower. The arc states both facts in one touch, which is the reason the tool exists.
The cluster method keeps the arcs as a secondary confirmation to price clusters, the curve lending its touch to a level the cluster already defends . That ordering matters. The cluster is the argument; the arc is the agreeing reference. The price action canon reads pullbacks as two-sided tests of the trend's conviction, and the arc fits that reading well: it marks how much ground, in price and in bars, a healthy test is allowed to give back before the test becomes a reversal.
Reading the Sweep
Two pullbacks can retrace the same distance and mean different things. The fast, deep drop meets the arc early, near its lowest reach, and the touch comes with momentum still falling. The slow, shallow drift meets the arc late, well above that lowest reach, because the pullback spent its time instead of its price. The second is the healthier retracement, and the arc is the only common tool that shows the difference without a second indicator.
In a healthy pullback the arcs act as a rising base of references. Each curve is touched and held, and each hold keeps the retracement shallow in price and short in time at once. When price starts closing through one arc and drifting toward the next, the pullback is spending more than the trend can afford.
The scale warning carries over from the fan, and it is worse here. Squash the chart and the sweep flattens; stretch it and the curves steepen. The arc's position on your screen depends on your axis scaling, so a touch on one chart is a miss on another. Treat every touch as a zone, never a price. The curve's width alone guarantees it.
And the blunt version: an arc that arrives with no cluster behind it is a curved line believing in itself. Geometry drawn from one swing point cannot hold a market on its own.
Trading the Arc Touch
The entry waits for the curve to be tested and answered. Price drifts into the arc, a reversal candle forms at the touch, and the long is taken on the close of that candle, not at the first contact. First contact is information. The close is the decision.
The stop goes below the pullback low and below the arc's vertical reach, so that both the price evidence and the curve's deepest claim have to fail before the trade is wrong. The target sits just under the old high, because the swing that anchored the arc is the first place sellers proved themselves.
The failure is the slice-through. Price closes under the arc with no cluster present and keeps falling. That close is the signal to stand down, not to average in. A curve drawn from one point is a reference, not a defense, and the market owes it nothing.
- Anchor only on completed swings, never on a leg still running.
- Require a cluster or horizontal level near the arc before treating the touch as tradable.
- Enter on the reversal close, not on the first touch of the curve.
- Exit the idea entirely on a close through the arc with no support behind it.
The Arc at 33.80
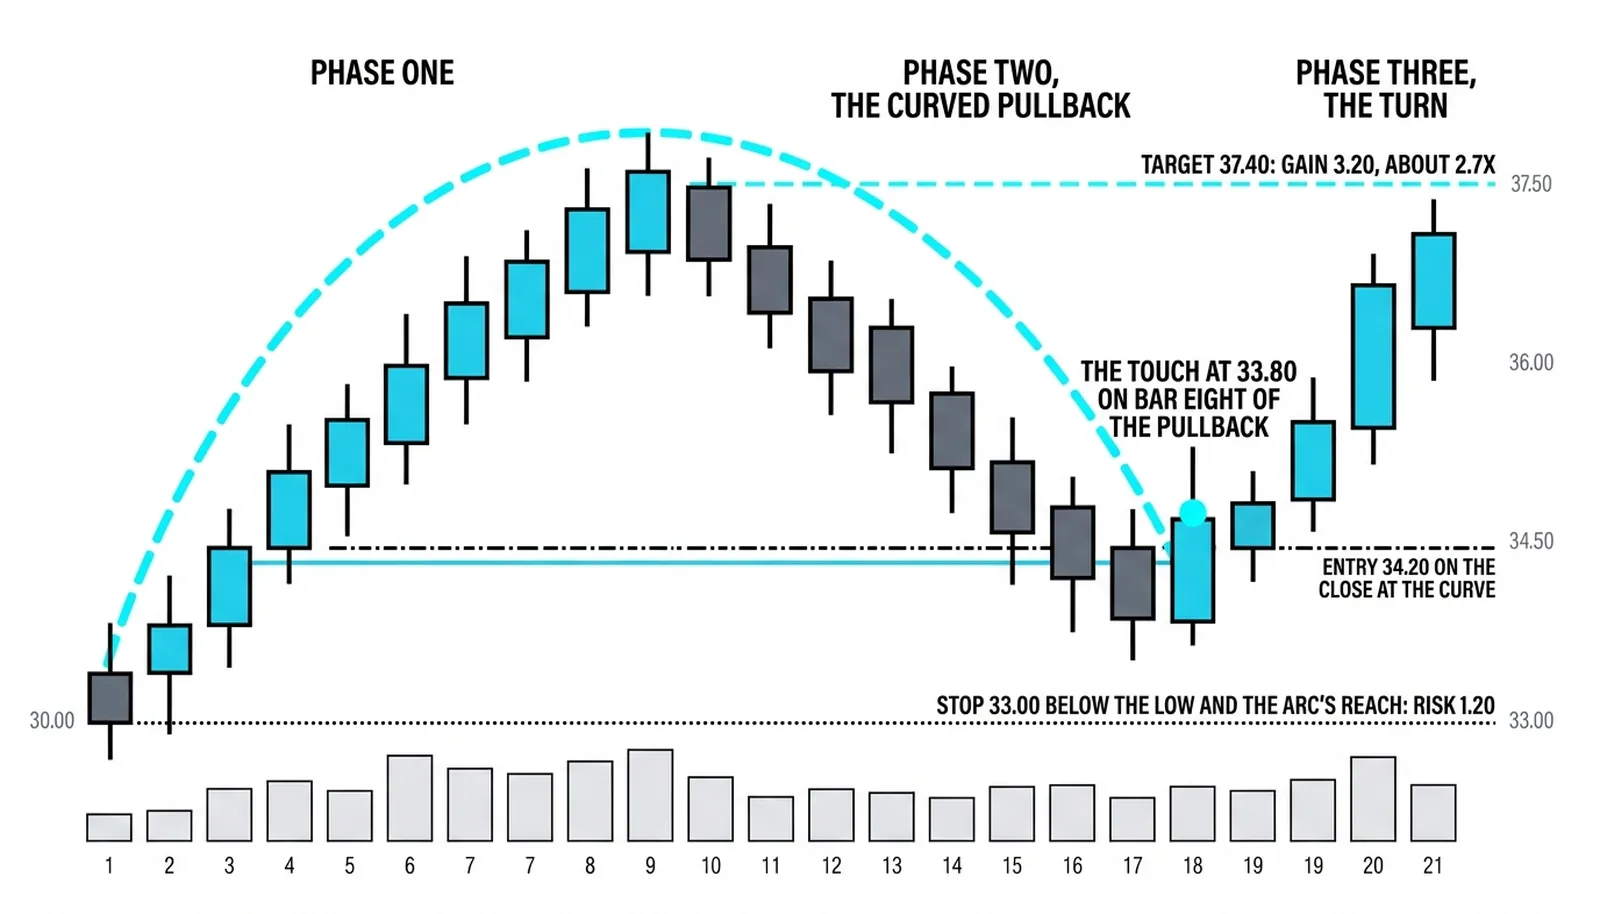
A hypothetical illustration with round numbers. The leg runs 8.00 points, from 30.00 up to 38.00. The 61.8 arc is drawn from the 38.00 high, and its lowest reach sits at 33.06, directly below the high on the chart.
The pullback does not drop straight to 33.06. It drifts for eight bars, spending time instead of price, and meets the arc at 33.80, above the arc's vertical reach precisely because the journey took so long. A horizontal 61.8 line would still be waiting at 33.06, untouched. The arc has already been tested.
A reversal candle closes at 34.10. The long is taken at 34.20 on that close. The stop sits at 33.00, below the pullback low of 33.30 and below the arc's reach, risking 1.20. The first target is 37.40, just under the old high, a gain of 3.20, about 2.7 times the risk.
The failed version slices the curve. The close prints at 32.90, straight through the arc, with no cluster anywhere near. There is no trade and no second chance at the same curve. The arc did its job in both versions: it defined exactly where the idea lived and exactly where it died.
| The arc | Its radius | Where it bites | What breaks the read |
|---|---|---|---|
| 38.2 arc | 38.2 percent of the leg | Shallow pullbacks in strong trends | A close through it toward the 50 zone |
| 50 arc | Half the leg | Standard corrections that hold the trend | Sideways drift that spends too many bars |
| 61.8 arc | 61.8 percent of the leg | Deep pullbacks that still respect the swing | A slice-through close with no cluster |
| Any arc, wrong scale | Distorted by the axis | Nowhere reliable | The chart itself, rescaled |
Arc Questions, Answered
What is a fibonacci arc?
A fibonacci arc is a retracement tool drawn as curves swept from a swing point, each radius set at a retracement distance of the leg, so every point on a curve marks a price and a time together.
How do you draw fibonacci arcs?
Anchor at the high of a completed rally (or the low of a completed decline), set each radius at a retracement of the leg, and sweep the curves forward into future bars. Confirm the swing is finished before anchoring, and check the chart's scaling before trusting any touch.
Why are arcs curved instead of straight?
Because the curve ties price to time. A horizontal line waits at one price forever; the arc's touch arrives at a price and a bar together, so a slow pullback and a fast pullback produce visibly different readings on the same retracement distance.
Do arcs work with fans?
Yes, and the pairing is natural because both come from the same ratios. The fan gives straight diagonals, the arc gives curves, and a spot where a fan line and an arc cross near a cluster is a stronger reference than any one of the three alone.
The time section closes here: when and where now share a single curve. The next stage of the course takes these references off the drawing panel and into live trade construction, where arcs, fans, and clusters stop being lines and start being decisions.