Confluence with Support and Resistance
Confluence with support and resistance is the meeting of a fibonacci measurement with a horizontal level the chart already respects, an old swing high or low that held before. The pairing works because the fibonacci crowd and the level crowd arrive at the same price from completely different directions. One group traded the geometry of the recent leg. The other group remembers where the last fight happened. When both groups' orders land on the same few cents, the zone carries more weight than either line carried alone.

Think of it as a crossroads where two roads meet, the crossing busier than either road alone. The previous lesson stacked two fibonacci measurements from two swings on top of each other. This lesson does something different. It joins a fibonacci measurement to the oldest lines on the chart, the horizontal highs and lows that price has already respected. The stacking rules stay the same. What changes is the second component.
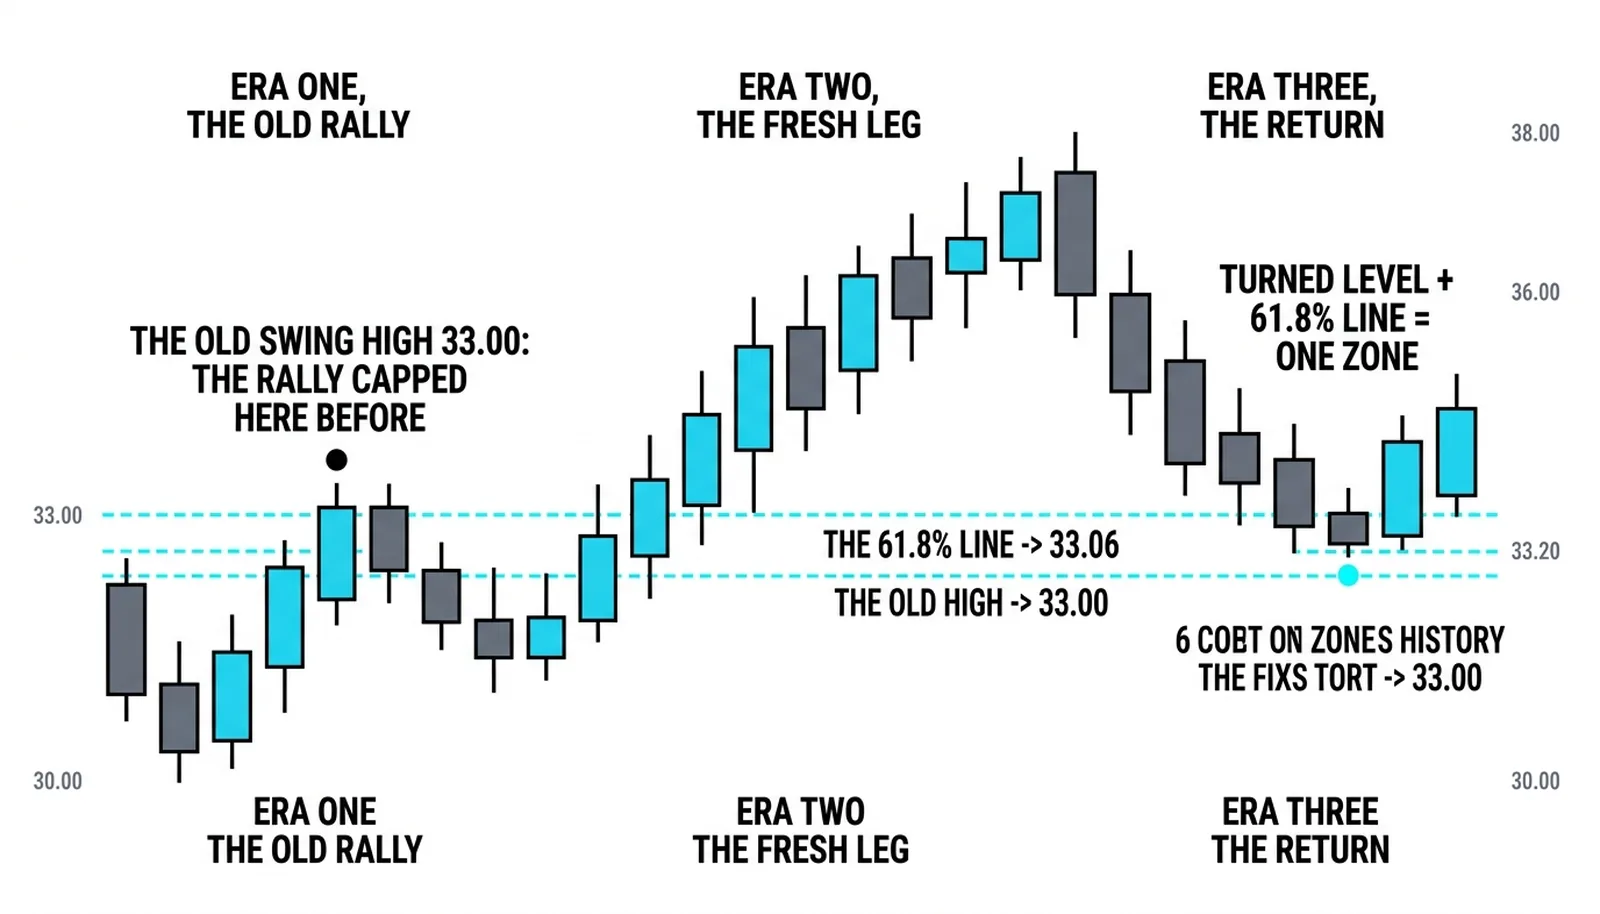
The Level That Has Acted
Not every horizontal line qualifies. The rule for qualifying the level is simple: it must have acted before. The price must be a place where the market visibly slowed, stalled, or turned. A swing high that capped a rally qualifies. A swing low that stopped a decline qualifies. A line drawn backwards from convenience does not.
The strongest version of this pairing is the turned level. A resistance that capped price, then broke, often becomes the support a later pullback tests. The old ceiling becomes the new line of interest. Traders who sold at the cap and watched price break through remember the price. Traders who bought the breakout remember it too. Both groups have orders waiting if price returns.
What disqualifies a horizontal is silence. If price passed through a level without pausing, without a wick cluster, without a single visible reaction, the level carries no history. Drawing a line there and calling it confluence is decoration. The level earns its place in the zone by having acted, or it earns nothing.
Be blunt with yourself here. A retracement landing on a price that never mattered adds a line to nothing. The trader who counts a meaningless horizontal as confluence has doubled nothing but their own confidence.
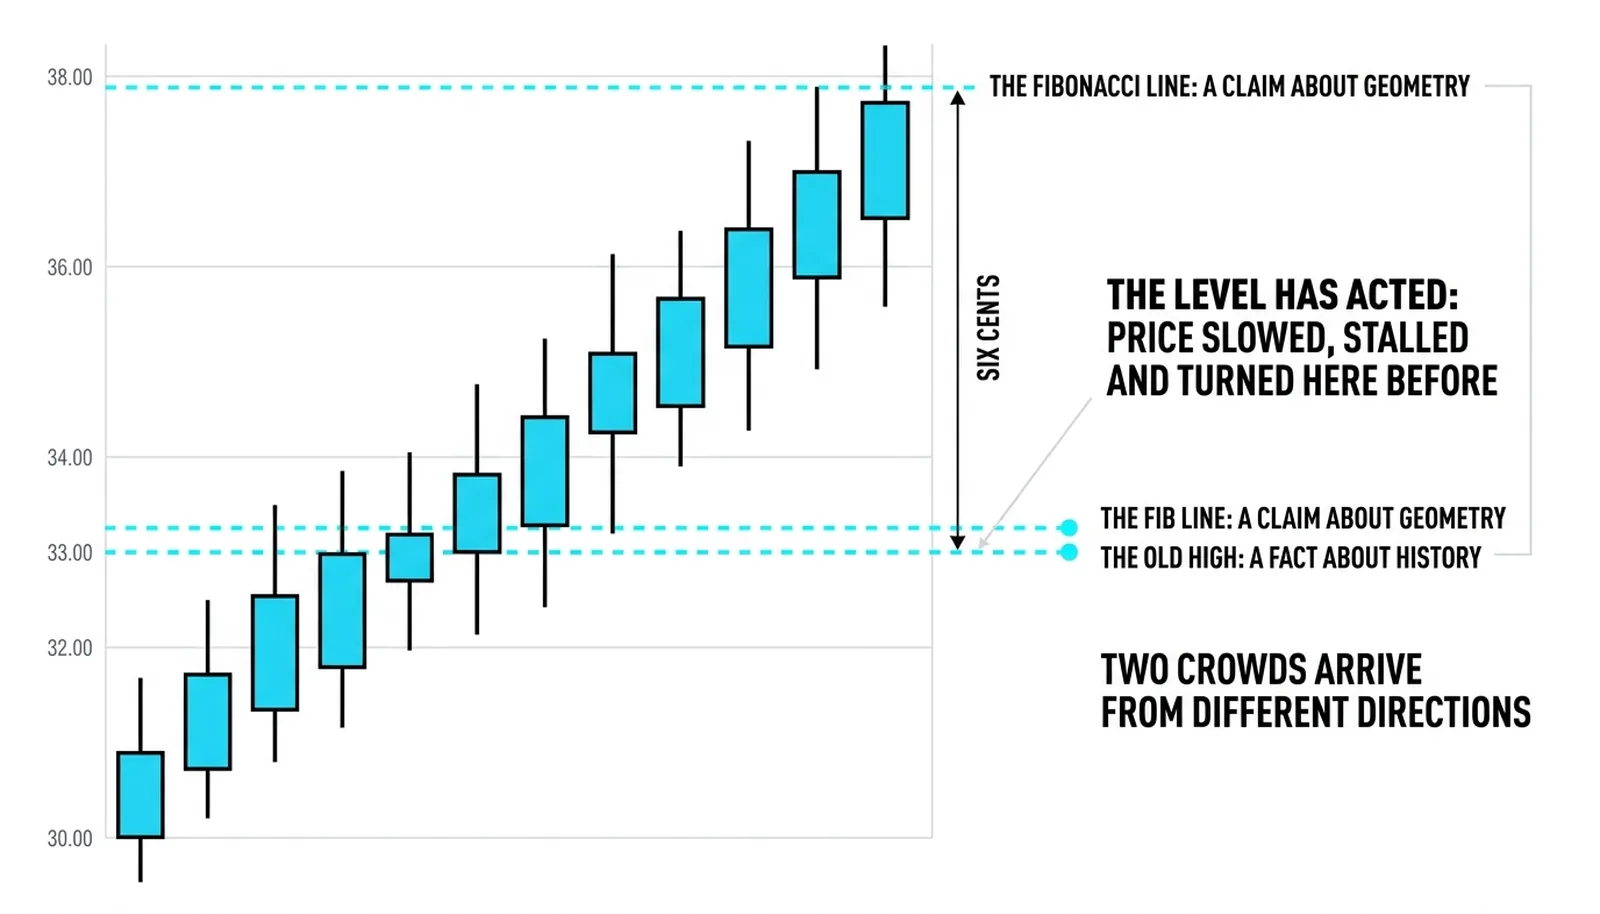
Why the Two Crowds Stack
The pairing is the strongest kind of confluence because the two components are different in nature. A retracement line is a claim about geometry. It says the pullback has travelled a measured fraction of the leg, and measured fractions are where traders who follow fibonacci ratios expect reactions. The line is a prediction, drawn forward from two points.
An old swing high is a fact about history. It is a price where buyers and sellers already fought and one side won. Nobody predicted that price. The market discovered it, printed it, and left it on the chart. The cluster method rests on clustering measured price relationships, and the work gains force precisely when a measured zone overlaps a price the market already proved mattered. The price action canon reads the same overlap through the lens of prior behaviour, treating old extremes as places where trapped and sidelined traders still have unfinished business.
So when the 61.8 percent retracement of a fresh leg lands on the old swing high that capped a prior rally, two independent order flows converge. The fibonacci crowd sees the measured line and places bids. The level crowd sees the old fight and places bids. The orders stack at the same cents, and the zone between the two prices becomes the busiest few ticks on the chart.
The level's history is the stronger half of the pair. Geometry repeats everywhere and means little by itself. A price where real money changed hands and a move died is evidence. The fibonacci line tells you when to pay attention. The level tells you why.
Trading the Meeting Point
The trade follows the same discipline as any confluence trade. You do not buy the zone because the zone exists. You wait for price to enter the zone and show a reaction, then you enter on the turn.
The entry comes after price dips into the overlap and prints a turn back in the direction of the leg. A strong close back above the zone, or a clear reversal bar at the zone, is the trigger. Entering early, inside the zone with no reaction, is a guess dressed as a plan.
The stop goes below both measurements. If the fibonacci line sits a few cents above the old level, the stop belongs under the lower of the two, with a small buffer for noise. A close below both ends the idea. There is no third line to rescue the read.
The honesty belongs here, stated plainly. Confluence with support and resistance raises the odds of a reaction, never the certainty of one. A zone can have a measured line, a proven level, and a clean turn, and still fail when the trend behind the pullback is stronger than the history behind the level. The failed version is not a flaw in the method. It is the cost of doing business, and the stop exists because of it.
The Meeting at 33.06
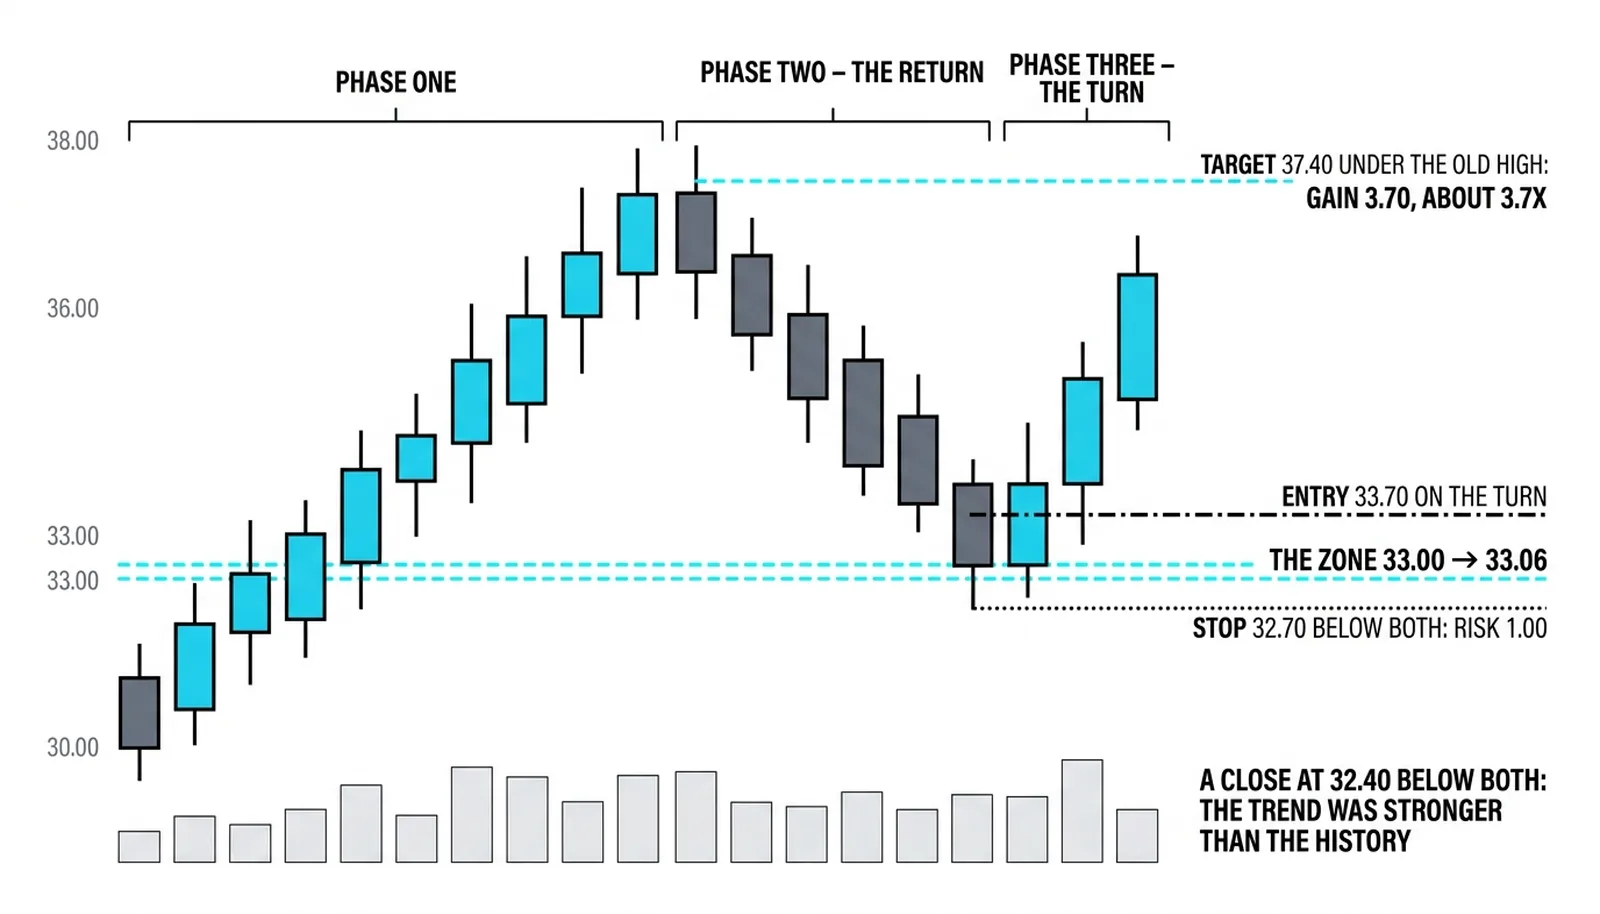
All numbers here are invented and round, purely to show the mechanics. A leg runs 8.00 points, from 30.00 up to 38.00. The 61.8 percent retracement of that leg sits at 33.06. An old swing high from a prior rally stands at 33.00, the price that capped the advance before the breakout through it.
The zone spans 33.00 to 33.06, six cents wide. Price pulls back from 38.00 and dips to 33.20, inside the zone's neighbourhood, then stalls and turns. A strong close back above the zone triggers the long at 33.70.
The stop goes at 32.70, below both the fibonacci line and the old level, with room for noise. The risk is 1.00 per share. The first target sits at 37.40, just under the old high at 38.00 where sellers may reappear. The gain at target is 3.70, roughly 3.7 times the risk.
The failed version runs the same setup and ends differently. Price enters the zone, hesitates, and then closes at 32.40, below both measurements. The read is dead. The level acted before and the geometry was measured correctly, and the market went through both anyway, because the selling behind the pullback outweighed the history behind the level. The stop at 32.70 exits the trade for the planned 1.00 loss, and the chart moves on without you.
| Component | Its own evidence | Its own crowd | What it contributes |
|---|---|---|---|
| 61.8% retracement at 33.06 | Geometry of the 30.00 to 38.00 leg | Traders following measured ratios | Timing, tells you when to pay attention |
| Old swing high at 33.00 | A real fight where sellers once won | Traders who remember the level | History, tells you why the price matters |
| The zone 33.00 to 33.06 | Overlap of both measurements | Both crowds at once | Stacked orders in a six-cent band |
| The turn at 33.20 | Price reaction inside the zone | Aggressive buyers confirming | The trigger that converts the zone into a trade |
Support and Resistance Questions, Answered
What is fibonacci confluence with support and resistance?
It is the overlap of a fibonacci retracement or extension line with a horizontal level the chart has already respected, such as an old swing high or low. The fibonacci line is a measured claim about the current leg. The horizontal is a proven fact from the chart's history. When both sit at the same price, two independent groups of traders have orders in the same place, and the zone carries more weight than either line alone.
How do you combine fibonacci with support and resistance?
Measure the active leg first and mark the retracement levels. Then check whether any of those levels land within a few cents of an old swing high or low that visibly acted before. Where they overlap, draw the zone across both prices. Wait for price to enter the zone and show a reaction, enter on the turn, and place the stop beyond the far edge of the zone. Skip any pairing where the horizontal has no visible history.
Which is stronger, the level or the fib line?
The level is stronger. An old swing high or low is a recorded event, a price where real orders fought and one side won. A fibonacci line is a projection drawn from two points, and projections are cheap. The fib line's job in the pairing is timing, telling you when a reaction is likely. The level's job is substance, telling you where the market has already proven it cares.
What if price breaks through the confluence zone?
The idea is dead and the stop should already be out. A close beyond both measurements means the force behind the move overwhelmed both the geometry and the history, which happens regularly. Take the planned loss and step aside. Sometimes a broken zone flips roles and matters again from the other side, but that is a new trade with a new read, not a reason to hold the old one.
The next lesson widens the point into an area: when the measured line lands inside a supply or demand zone, and why the zone absorbs the scatter a single line cannot.