Fibonacci Confluence with Supply and Demand
Confluence with supply and demand is the meeting of a fibonacci retracement line with a zone, the shelf where price consolidated before its last impulse. The pairing fixes the line's greatest weakness: a single level asks the market for a precision the market does not have. A retracement line is one price wide, and real reactions are never one price wide.

Think of a market stall that gets restocked at the same price whenever it sells out, the vendor returning to the price where the buying returned before. The zone is that restocking price band, and the fibonacci line is the depth gauge that says the pullback has gone deep enough to reach it. When the two land on the same patch of the chart, the trader stops betting on a number and starts betting on a place where business was actually done.
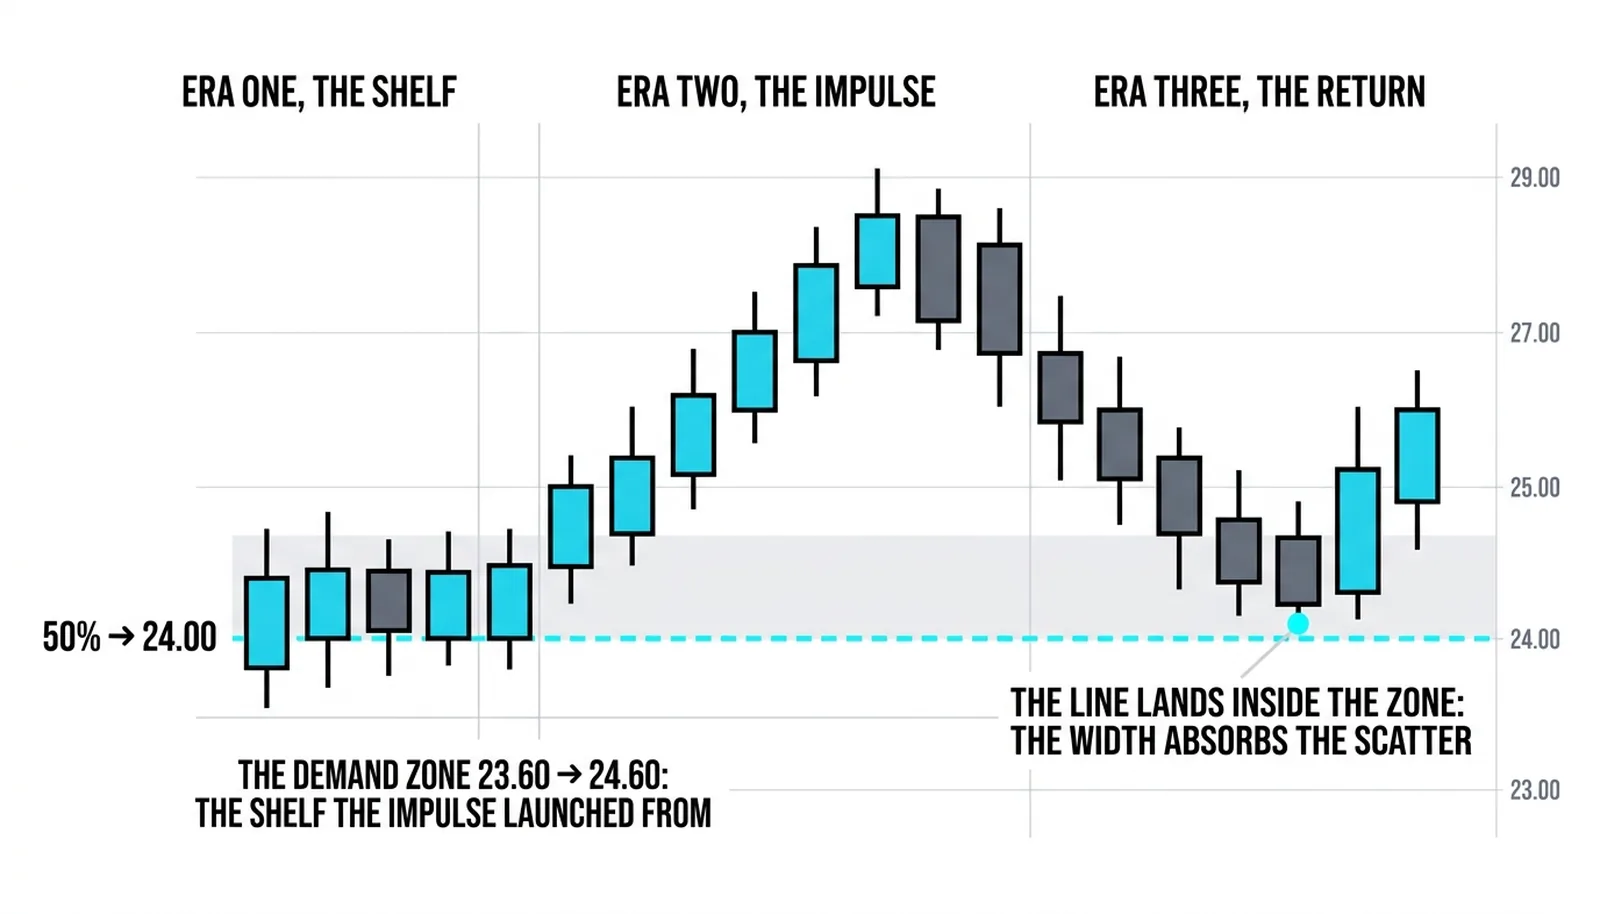
The Zone Fixes the Line's Weakness
Reactions scatter. Wicks overshoot the line by a few ticks, entries crowd in front of it, and two platforms computing the same retracement from slightly different extremes will print the line a few ticks apart. A naked line takes all of that noise on the chin.
A demand zone is several prices tall. It is drawn from the last consolidation before the impulse, the shelf where institutions built the position that launched the leg. That width absorbs the overshoots, the early entries, and the platform disagreement that would stop out a trader sitting exactly on the line.
The cluster method rests on clustering multiple fibonacci measurements into price bands rather than trusting any single ratio, and the logic transfers directly: a band of agreement is tradeable, a lone decimal is not. The zone simply supplies the band from the volume-and-structure side instead of from more fibonacci math.
The freshness rule is strict. The zone must be untouched since the launch. A zone that price has already revisited has already spent a portion of its resting orders, and a zone revisited twice is mostly memory. First return is the trade; the second return is a weaker version of it.
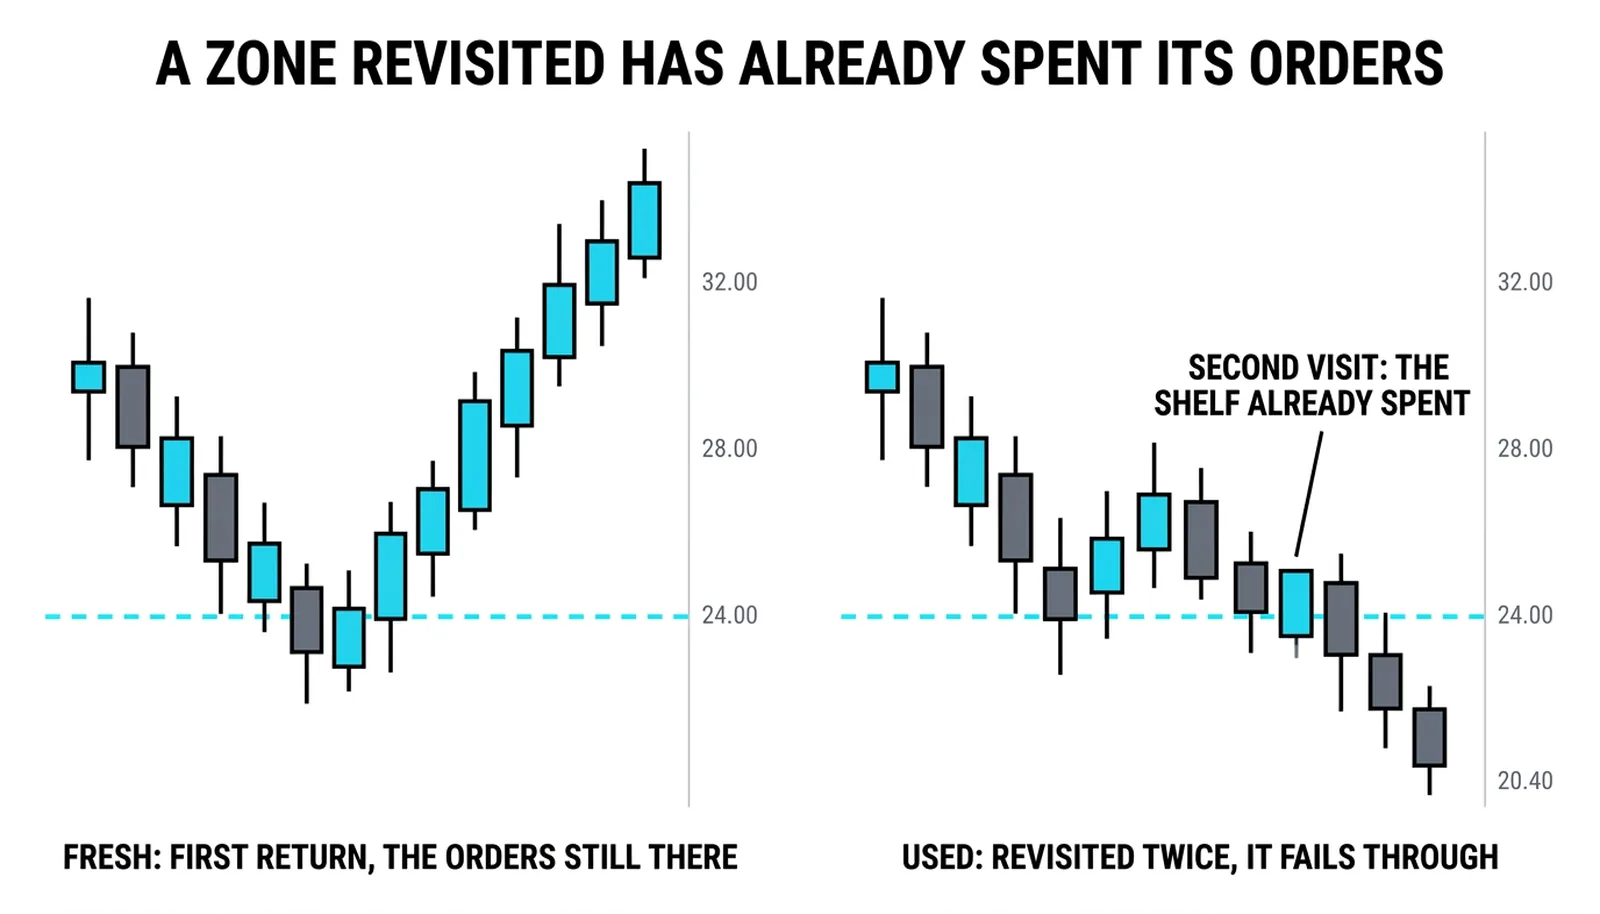
Where the Line and the Zone Agree
An earlier lesson in this series joined a fibonacci line to a horizontal support or resistance level. This lesson joins the line to an area instead, the supply or demand zone drawn from the base before the last impulse. The zones themselves were taught there; what matters here is which zone qualifies.
The zone must be the origin of the move. Not any consolidation on the chart, but the specific base the impulse launched from. That base is where the unfilled interest lives, because the traders who accumulated there and got lifted away often left instructions behind to buy more at the same prices if the market ever came back.
The price action canon holds that strong moves begin from areas where both sides agreed on value right up until one side stopped showing up, and that first return to such an area tends to draw a response. The fibonacci line does not create that response. It only tells the trader whether the pullback has travelled far enough to reach the area where the response should live.
What disqualifies a zone:
- Price has already traded back into it since the launch.
- The consolidation sits in the middle of the leg rather than at its origin.
- The impulse out of the base was weak and overlapping, suggesting no real position was built.
- Higher-timeframe structure sits directly against the zone, working the other way.
The honesty runs in both directions. The zone without the line is a guess about where institutions were. The line without the zone is a geometry claim nobody seconded. Each supplies what the other lacks.
Trading the Zone with the Line Inside
The trade is built around the zone, not the line. The entry waits for price to reach into the zone and show a turn, a rejection wick, a strong close back up through the line, or a small reversal structure on a lower timeframe. Entering blind at the line is betting on the geometry; entering on the turn is betting on the response.
The stop lives below the zone's lower edge, not below the line. The zone is the claim being tested. If the market trades through the entire shelf where the position was supposedly built, the claim is wrong, and a stop parked just under the line would be noise inside the zone's own width.
Zone and line die together. A close below the zone's base does not merely wound the setup, it kills both halves, because the line's only authority came from sitting inside a live zone. Once that happens, attention passes to the next retracement level down, typically the 61.8 percent line, where only the fibonacci crowd remains and no structural shelf supports the trade. That second attempt is a different, weaker trade, and sizing should say so.
Targets aim at the old high first. The impulse that launched from the zone defines the move, and the first reasonable objective sits just under its extreme, where sellers defended before. Stretching for more is allowed only after the market proves it can clear that barrier.
The Zone at 23.60 and the Line at 24.00
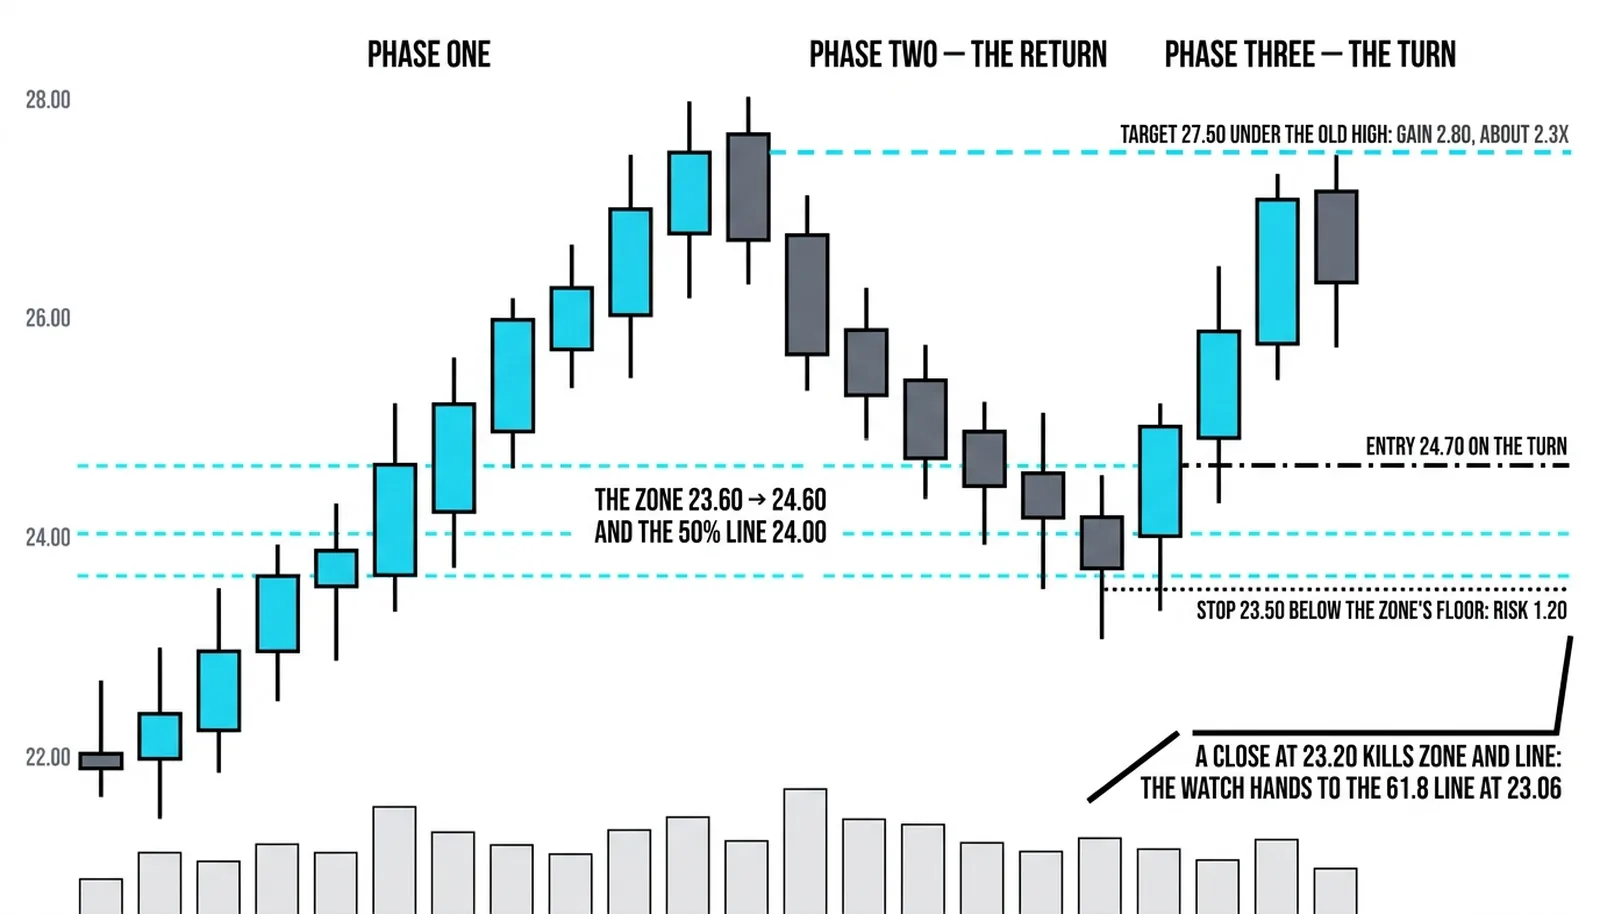
All numbers here are invented, round, and purely illustrative. A leg runs 8.00 points, from 20.00 up to 28.00. The 50 percent retracement of that leg sits at 24.00. The demand zone, drawn from the consolidation the impulse launched from, spans 23.60 to 24.60. The line lands inside the zone, roughly in its upper half. That overlap is the setup.
Price pulls back from 28.00 and trades down to 24.20, inside the zone and just under the line. The next bars tighten, a strong close prints back above 24.00, and the turn is confirmed. The long is taken at 24.70 once the turn is established, not at the line itself.
The stop goes at 23.50, below the zone's lower edge at 23.60. Risk is 1.20 per share. The first target sits at 27.50, just under the old high at 28.00. The gain to that target is 2.80, which is about 2.3 times the risk. Nothing about the trade required precision at 24.00; the zone absorbed the overshoot to 24.20 and the entry waited for proof.
The failed version teaches the other half. Suppose price slices through the zone and closes at 23.20. The zone is dead, the line is dead with it, and the stop at 23.50 has already done its job. Attention then passes to the 61.8 percent retracement at 23.06. There is no base there, no shelf, no institutional anchor, only the fibonacci crowd. A trader who takes that second trade is trading geometry alone and should size it accordingly, or skip it entirely.
The comparison both ways:
| Component | Its own evidence | Its own weakness | What the other supplies |
|---|---|---|---|
| The 50 percent line | Measured from the leg's exact extremes | One price wide, reactions scatter around it | The zone's width absorbs the scatter |
| The demand zone | The base where the impulse was launched | A guess about where institutions were | The line confirms the pullback has reached it |
| The turn inside the zone | Rejection wick or strong close back up | Can be a pause before continuation down | The stop below the zone defines the failure |
| The stop placement | Below the zone's lower edge | Wider than a stop under the line | Position sizing converts the width into fixed risk |
Supply and Demand Questions, Answered
What is confluence with supply and demand zones?
It is the overlap of a fibonacci retracement line with the zone price consolidated in before its last impulse. The line measures how deep the pullback has gone; the zone marks where the position that launched the move was built. When the line lands inside the zone, the measurement and the structural evidence agree, and the trade bets on the zone rather than on the decimal.
Should you draw the zone or the fib line first?
Draw the zone first. The zone comes from the chart's own history, the base before the impulse, and it exists whether or not any ratio is ever computed. The retracement is then measured over the leg to check whether any line falls inside that zone. Drawing the line first tempts the trader to hunt for a zone that fits it, which reverses the logic and manufactures agreement that the market never offered.
Why does the stop go below the zone and not the line?
Because the zone is the claim being tested. The line is only a marker inside that claim. Price routinely overshoots a line while still respecting the zone around it, so a stop parked just under the line gets hit by noise the setup actually expected. A stop below the zone's lower edge is hit only when the shelf itself has failed, which is the genuine invalidation.
What happens when price breaks the whole zone?
The setup is dead, zone and line together, and the trade should already be out. The next point of interest is the deeper retracement, usually the 61.8 percent line of the same leg, but that level has no structural shelf beneath it. Only the fibonacci crowd remains there, so any second attempt is a weaker, smaller trade, and standing aside is a legitimate choice.
The next lesson tilts the map: confluence between the measured line and a moving one, when the retracement crosses a rising or falling trendline at the same bars.