Fibonacci Channel
A fibonacci channel is a trendline drawn in company: a base line through the trend's confirmed lows, joined by parallel lines scaled at fibonacci ratios of the channel's width, the trend's boundaries projected forward as rails the market can ride and reach for. Where a single trendline marks one edge of a move, the channel marks both edges and then extends the geometry outward, so the trader sees not only where the trend defends itself but where an extension of the move would likely reach.

Think of an avenue of trees: two rows planted parallel and kept to their width, the path trending forward between them and every tree standing on one of the rows. The market is the path. The rows are the rails. As long as price keeps walking between them, the trend is intact.
The previous lesson bent fibonacci retracements into arcs, curves drawn around a swing. This lesson straightens the geometry into pairs: the trend's own boundaries, drawn as parallel lines and extended forward. Same ratio family, different shape, different job.
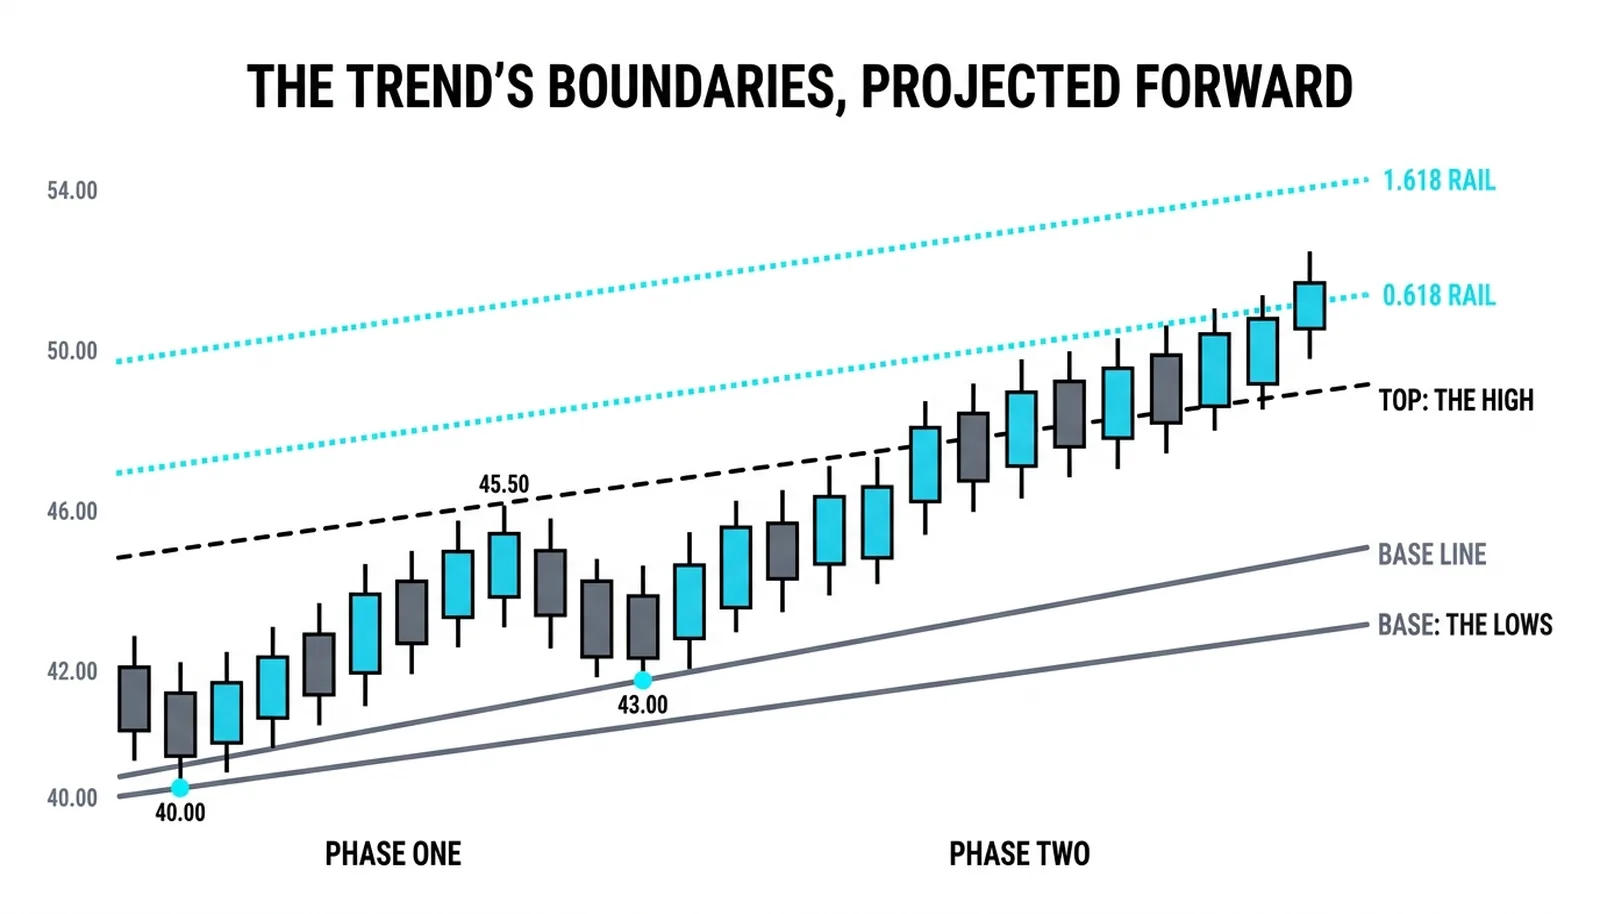
The Base Line and Its Rails
Start with the base line. Draw it through the trend's confirmed lows, a rising line connecting higher lows in an uptrend. Two touches make a candidate line; a third touch makes it a working line. Until the lows confirm, everything built on top of the base is scaffolding, not structure.
Set the width next. Find the first significant high above the base line and draw a parallel through it. That distance, base to top, is the channel's width, and everything else in the tool is a multiple of it.
Now scale the rails. The tool projects lines parallel to the base at fibonacci ratios of the width: a rail at 0.618 of the width above the top, another at 1.618, sometimes a 1.0 rail marking a full second width. Each rail rises at the same angle as the base. The arithmetic is identical to a fibonacci extension, except the projection is a line the market can interact with over time instead of a single price printed once.
The cluster method rests on exactly this idea: ratios measured from one swing and projected onto the next, with clusters of projections treated as zones rather than precise numbers. The channel applies the same discipline to the trend's own width. The width is the measuring stick, and the ratios say how many sticks the market is likely to travel.
Here is the honesty. A channel drawn from two points is a guess with a straight edge. The base line needs confirmed touches before the width means anything, and early in a trend the channel redraws itself every time a new swing makes a liar of the old line. The rails are projections of a width measured once. Nothing about them promises the width persists.
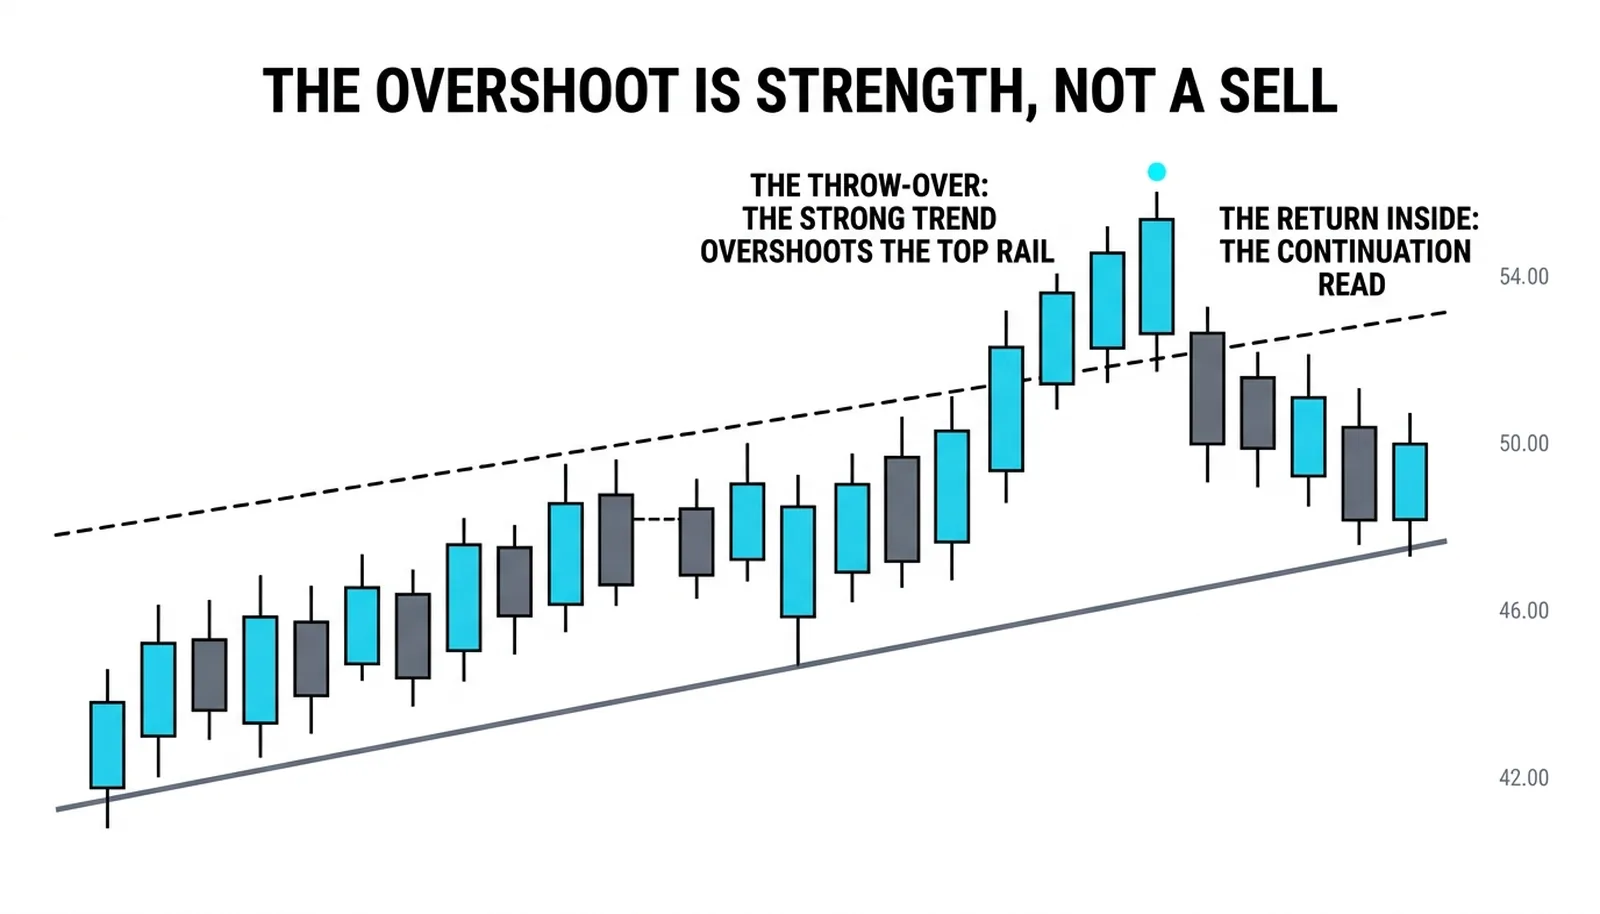
Riding and Reaching
The base line defends the trend. In an uptrend, pullbacks that hold at or near the base line are the trend restating itself, and each successful hold adds weight to the channel's geometry. The top line is the boundary the market rides under, the ceiling of normal travel.
The price action canon describes the behavior at the top in terms every channel trader should internalize: in a strong trend the market overshoots the top line, the throw-over, and the return back inside the channel is the continuation read, not a reversal signal. The overshoot shows urgency. The re-entry shows the channel still governs. A market that throws over and comes back is a trend running hot, not a trend dying.
The opposite read matters just as much. A market that can no longer reach the top line is a trend cooling. Successive pushes that stall short of the ceiling, while the base still holds, describe momentum thinning inside intact structure. That condition often resolves as a break of the base, because the buyers have stopped pressing and the sellers only need patience.
The outer rails, the 0.618 and 1.618 projections, mark where an extension of the move would reach if the trend accelerates beyond its original width. They are targets and context, not walls. Price arriving at the 1.618 rail after a throw-over is price that has traveled one and a half widths beyond the original channel; expecting it to keep the same pace from there is optimism, not analysis.
Trading the Rails
The standard trade is the pullback to the base line. The trend is established, the channel is drawn, and price returns to the base. The entry waits for evidence: a reversal candle closing back in the trend's direction, taken on that close or just beyond it. Buying the line at the first touch, without a close that confirms, is paying for a hope.
The stop belongs below the base line, beyond the point where the channel's read of the trend is simply wrong. If the market closes below the base line, the ride is over. That close is the exit signal for the position and the death certificate for the channel; the geometry has failed and redrawing it to fit the new price is curve-fitting in real time.
The throw-over cuts the other way and must be handled separately. A strong trend closing above the top rail and then returning inside is showing strength, and the trader who shorts the first poke above the rail is fighting the very pressure the channel was drawn to measure. Treat overshoots as information about urgency. Treat closes below the base as information about failure. Confusing the two is the most expensive mistake this tool offers.
- Entry: reversal close at the base line, in the trend's direction.
- Stop: below the base line, past the point where the trend read is dead.
- First target: the channel's top line, projected to the exit bars.
- Extension targets: the 0.618 and 1.618 rails, only after a confirmed throw-over and return.
- Invalidation: a close below the base line, full stop.
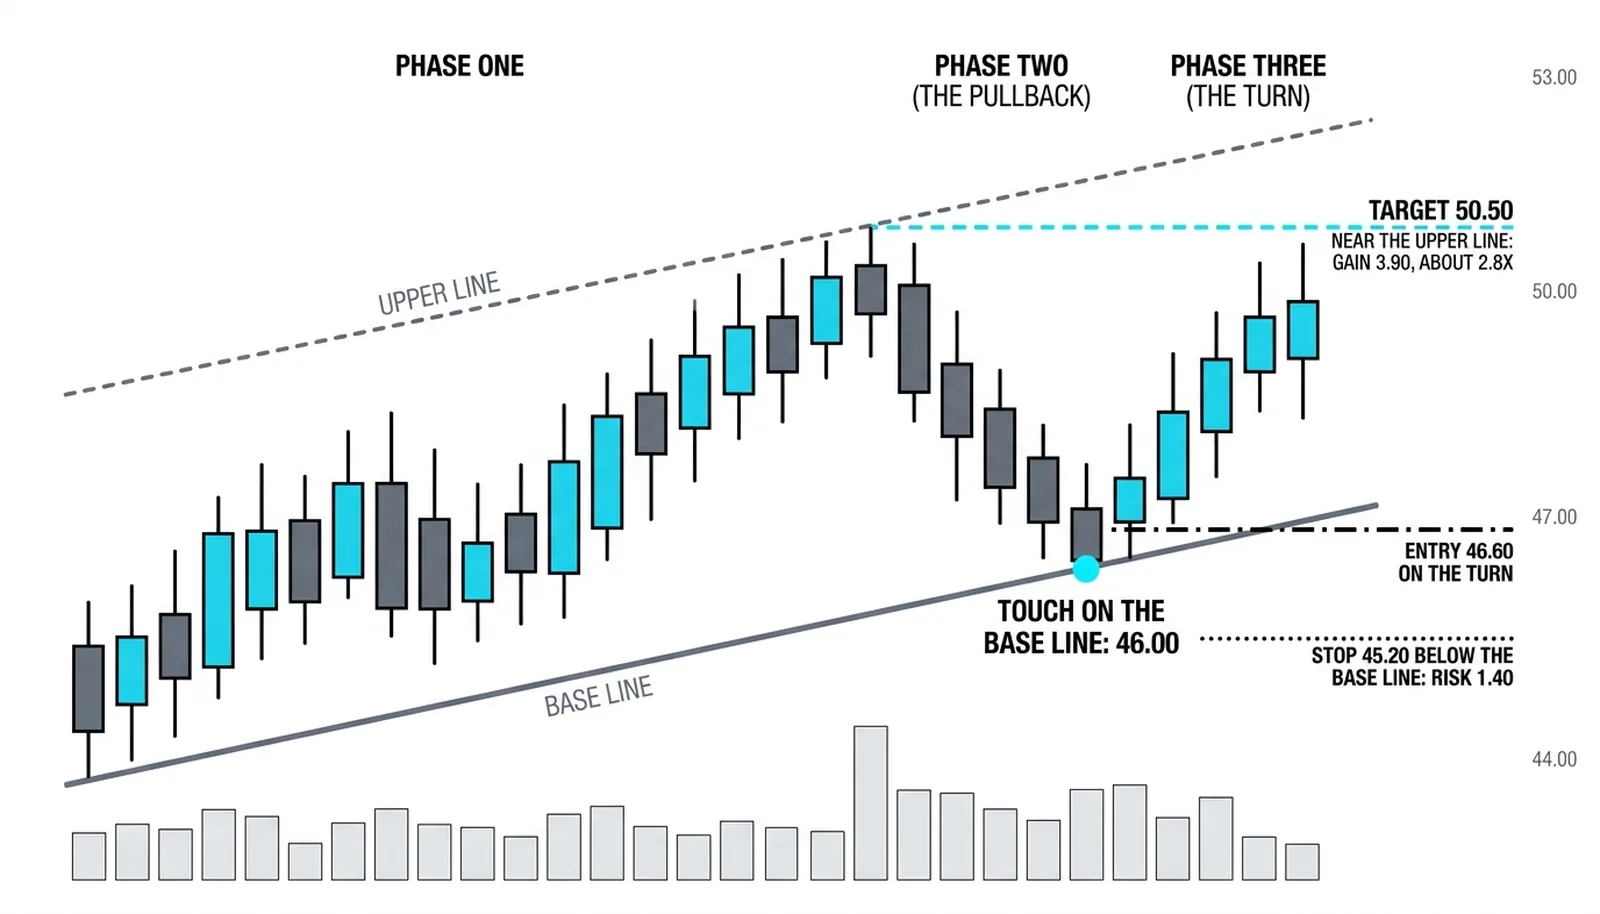
The Base Line at 46.00
A hypothetical uptrend makes lows at 40.00 and 43.00. The base line rises through them. The first significant high prints at 45.50, and the parallel drawn through it gives a channel width of 3.70 measured at that bar. The market trends on, then pulls back.
At the touch bar, the base line stands at 46.00. Price dips to it, holds, and prints a reversal candle closing at 46.50. The long is taken at 46.60 on that close. The stop sits at 45.20, below the base line, risking 1.40 per share.
The channel's top line, projected forward to the exit bars, stands near 50.50. Price works up the channel and reaches it. The exit at 50.50 pays 3.90 against the 1.40 risked, about 2.8 times the risk. The channel did its whole job: the base defined the entry and the risk, the top defined the reward, and the width tied the two together.
The failed version is just as clean. Price returns to the base line and does not hold. The close prints at 44.60, below the line. The ride is over, the channel's read of the trend is dead, and the trader who honored the stop at 45.20 is already flat and watching. The trader who moved the stop to give it room owns a falling position and a broken tool.
| The Rail | Width Rule | What It Projects | The Break That Ends It |
|---|---|---|---|
| Base line | Zero, the reference | Where pullbacks should hold | A close below it |
| Channel top | 1.0 width above the base | The ceiling of normal travel | Repeated failure to reach it, trend cooling |
| 0.618 rail | 0.618 of a width above the top | First extension target after a throw-over | A close back below the top that keeps falling |
| 1.618 rail | 1.618 of a width above the top | Full extension of an accelerated move | Arrival followed by loss of the channel top |
Channel Questions, Answered
What is a fibonacci channel?
A fibonacci channel is a set of parallel trendlines: a base line through the trend's confirmed lows, a parallel through the first significant high, and additional parallels projected at fibonacci ratios of the channel's width, typically 0.618 and 1.618. It maps both boundaries of a trend and projects where an extension beyond them would reach.
How do you draw a fibonacci channel?
Draw the base line through at least two confirmed lows, ideally three. Draw a parallel through the first significant high to fix the width. The tool then places the ratio rails automatically, each parallel to the base and rising at its angle. If the swings keep breaking the base, the trend has not confirmed yet, and the honest move is to wait rather than redraw.
What is a throw-over in a channel?
A throw-over is an overshoot: price pushes above the channel's top line, then returns inside. In a strong trend it signals urgency and continuation, not reversal. Shorting the first poke above the rail fights the pressure the channel was drawn to measure; the return inside the channel is the read that matters.
Do channels work in ranges?
They degrade badly. A range has no rising base line, so the channel's geometry has nothing to anchor to, and the rails project a width that the sideways market never asked for. In a range, horizontal support and resistance do the job the channel does in a trend. Match the tool to the structure, not the other way around.
The time section closes here: when and where aligned, the calendar's rhythms, and now the drawn tools that bend and extend the lines. Next, the course turns to how price actually trades hands, the volume profile's horizontal view read bar by bar, where the market accepted price and where it refused.