Dow Theory
Dow Theory is the framework for reading markets that grew out of classical Dow theory market commentaries around the turn of the twentieth century, and almost every technical-analysis idea you have learned so far descends from it. Trends, support and resistance, confirmation, volume. All of it traces back to a handful of newspaper editorials.

If technical analysis is a language, Dow Theory is its grammar.
Understanding it will not give you a new indicator. It will show you why the tools you already use work the way they do, and where their limits come from.
The Man Behind the Name
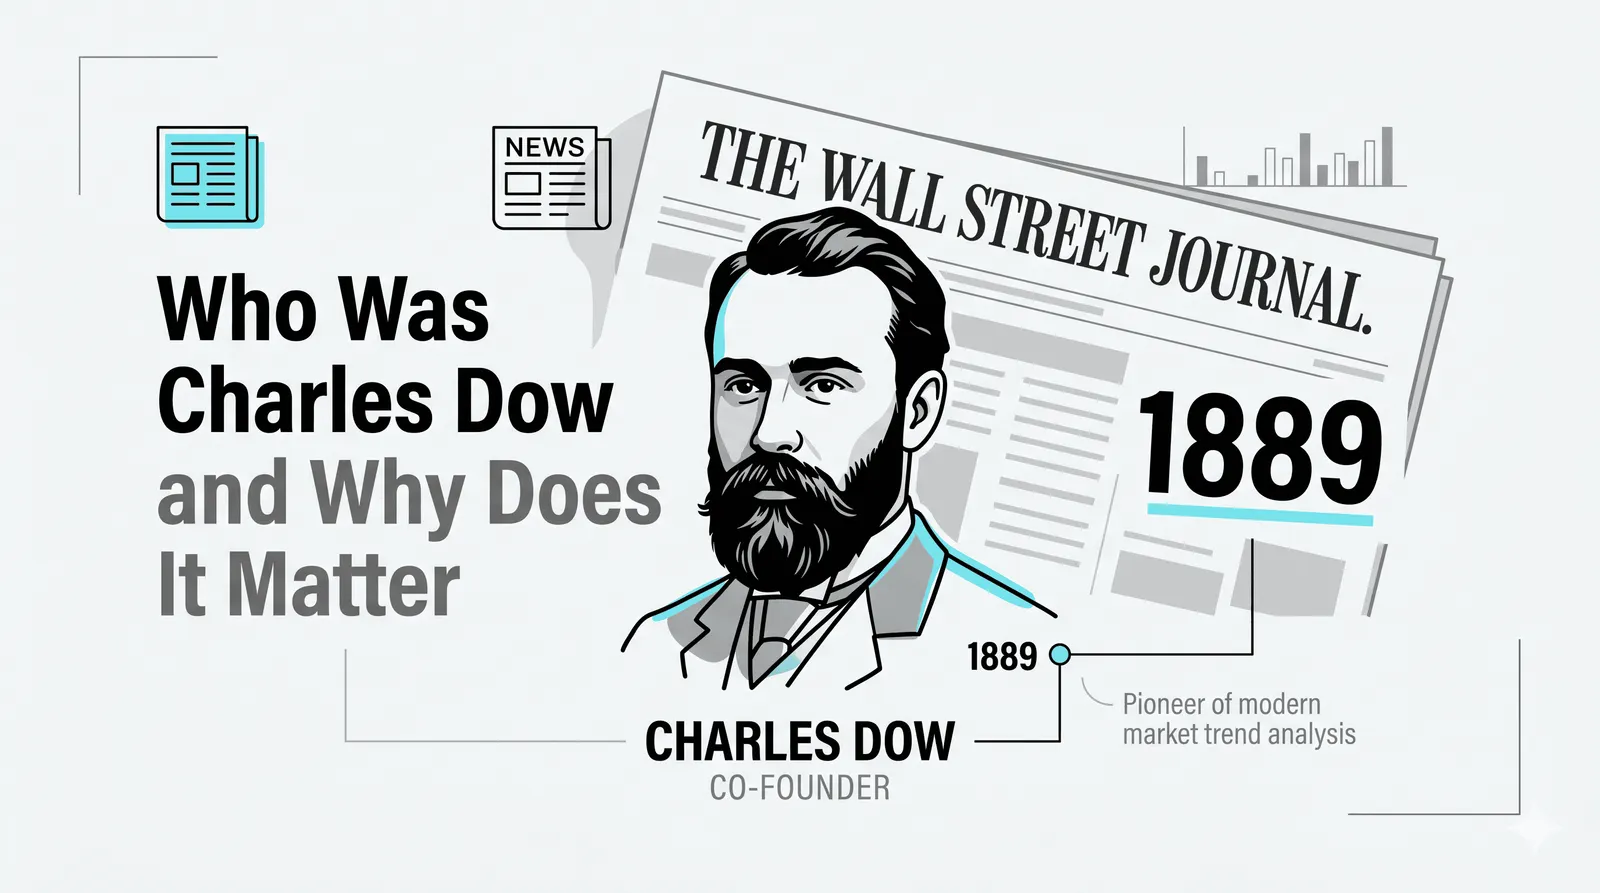
Classical Dow theory came from financial journalism, not from trading and not from academia. He co-founded Dow Jones and Company and served as the first editor of The Wall Street Journal, where he wrote short market commentaries for his readers.
Most people get the next part wrong. Dow never published a theory. He never wrote a book, never listed tenets, never used the phrase "Dow Theory." He wrote observations about how the market behaved, one editorial at a time.
After his death, later writers collected those editorials and organized them into a coherent system. William Peter Hamilton and Robert Rhea did most of that work. So what we call Dow Theory is really a set of market observations, structured and formalized by later practitioners.
That origin matters. This is not a backtested model. It is a set of hard-won generalizations about crowd behavior, written by a man who watched the tape every day.
The Six Tenets in Plain Language
The system rests on six ideas. You have already met most of them in other forms.
- The market discounts everything. All known information, and the crowd's expectations about the future, are already reflected in the price. This is the same idea behind the first of the three core principles you learned earlier.
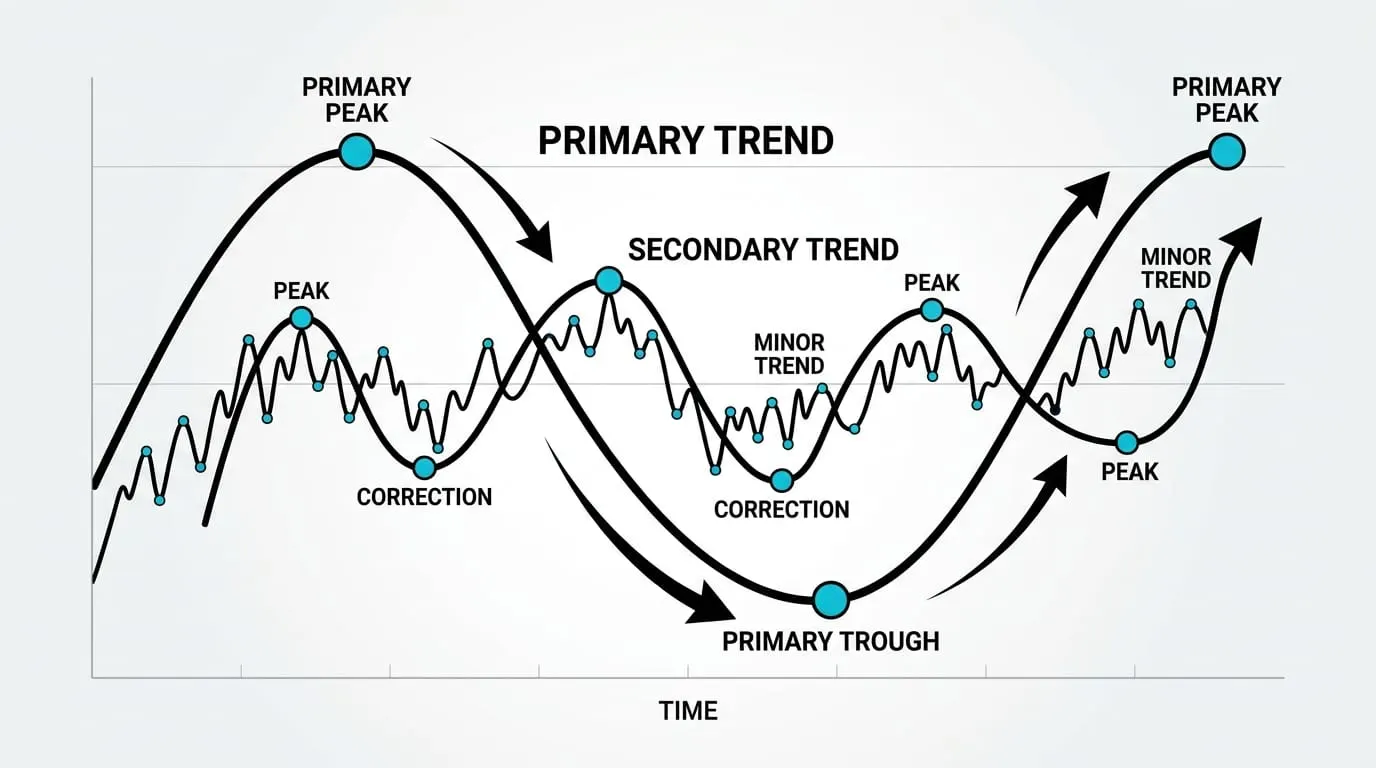
- Markets move in three kinds of trends. A primary trend lasting months to years, a secondary reaction lasting weeks to months, and minor fluctuations lasting days.
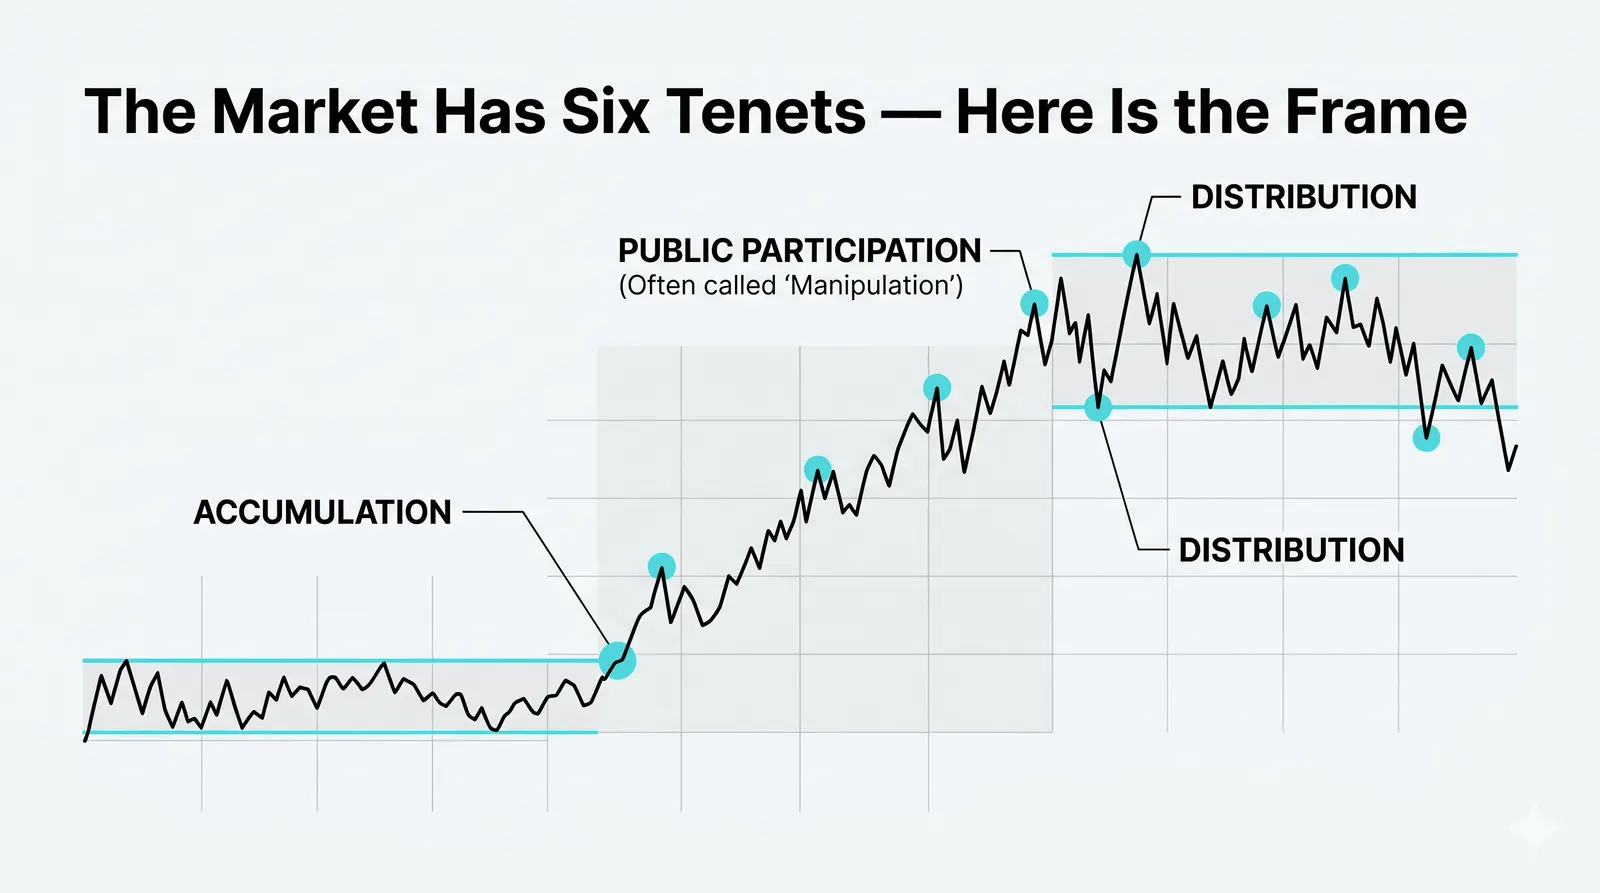
- A primary trend has three phases. Accumulation, public participation, and distribution. More on these below.
- Related indexes must confirm each other. A real move shows up across the market, not in one corner of it.
- Volume should confirm the trend. Rising prices on expanding volume carry more weight than rising prices on thinning volume.
- A trend stays in force until a clear reversal. The default assumption is continuation, not turning. You need actual evidence to declare a trend dead.
Read that list again and notice something. None of it requires a formula. It is a way of organizing what you see on a chart.
Accumulation, Participation, Distribution
The three phases describe who is doing what, and when. This is the most useful part of the whole framework for a developing trader.
Accumulation comes first. The decline has run its course, sentiment is miserable, and nobody wants to hear about the market. The informed few start buying quietly into that apathy. Price stops falling and begins to grind sideways or slightly up, and almost nobody notices.
Public participation follows. The trend becomes visible. Higher highs and higher lows are obvious on the chart, news coverage turns, and the crowd joins in. This is the longest and most tradeable phase, and it is where most trend-following money gets made.
Distribution ends the cycle. Prices are high, optimism is loud, and latecomers are buying eagerly. The early buyers from the accumulation phase sell into that enthusiasm, quietly exiting while the crowd provides the liquidity.
The crowd buys excitement and sells despair. The informed money does the opposite, and it does it early.
A Hypothetical Walk Through the Phases
Imagine a market that bottoms at 100 after a long, grinding decline. Nobody is talking about it. The forums are silent, the headlines have moved on.
Over the next stretch of months, price grinds up to 112, pulls back to 106, then pushes higher again. Volume is modest but picks up on the up moves. Then the broader related index makes a new high of its own, confirming the move, and the first cautious headlines appear.
That quiet climb from 100 to 112 was accumulation. The informed buyers were active while sentiment was still dead. The confirmed push beyond 112, with the crowd now paying attention, is participation beginning.
Now fast forward. Price reaches 150. Everyone is bullish, your neighbor is asking how to open an account, and volume is enormous on up days but the highs are getting harder to make. That is distribution. The people who bought near 100 are selling to the people who just discovered the trend.
Same market, same chart, three completely different crowds.
Why Confirmation Matters
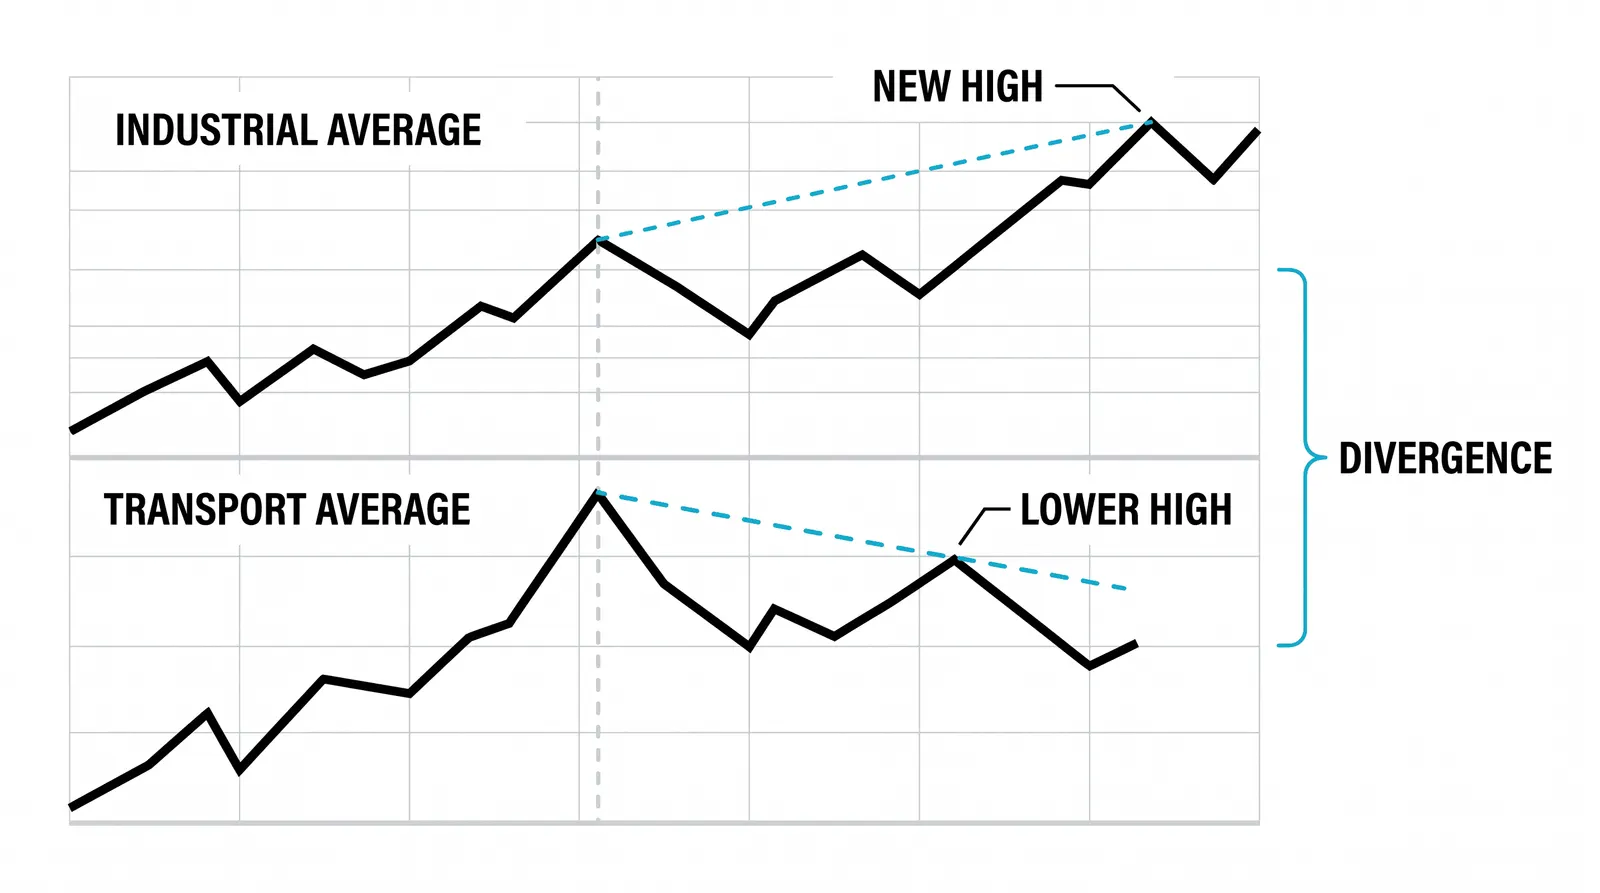
Dow built his system around two indexes, and he insisted they agree. One index making a new high while its partner lags is a warning, not a signal. Agreement is the evidence.
The logic is simple. A genuine economic expansion lifts everything. If one slice of the market is making new highs while the rest stalls, something is off. The move may be narrow, speculative, or running on a story rather than on broad strength.
You can apply this today without any railroad stocks. Watch whether a stock's breakout is backed by its sector. Watch whether the index you trade is confirmed by related indexes. Divergence between things that should move together is information.
Non-confirmation does not tell you to short. It tells you to demand more proof before trusting the move.
What Holds Up and What Shows Its Age
The core ideas have aged remarkably well. Discounting, trends within trends, the three phases, volume confirmation. These are the foundation of everything on this site, and they describe crowd behavior that has not changed in over a century.
The letter of the rules has aged, though. The two indexes in classical Dow theory were railroad and industrial companies, built for an economy of freight and factories. Applying the original confirmation rule literally, with its original components, makes little sense in a market dominated by technology and services.
There is also a cost baked into the design. Confirmation arrives late by definition. Waiting for two indexes to agree, for a trend to prove itself, means you give up the first part of every move. Dow Theory will never get you in at the bottom. It was never trying to.
That trade-off is honest. You exchange the exciting early entry for a higher probability that the trend you join is real.
The Three Trends at a Glance
| Trend | Typical Span | What It Represents |
|---|---|---|
| Primary | Months to years | The main direction of the market, the tide |
| Secondary | Weeks to months | Corrections and reactions against the primary trend |
| Minor | Days | Short-term noise and daily fluctuations |
Most losing trades come from confusing one row of this table with another. A trader takes a position against the primary trend because a minor fluctuation looked like a reversal. Knowing which trend you are trading, and which one you are fighting, is half the battle.
Questions About Dow Theory
Is Dow Theory still relevant?
Yes, because it describes crowd behavior rather than any specific market. The original indexes are dated, but discounting, trend structure, phases, and confirmation show up in every liquid market today, from stock indexes to currencies to crypto.
Do I need to memorize the six tenets?
No. You need to internalize two habits: assume the trend continues until proven otherwise, and look for agreement across related markets before trusting a move. If those two become reflexes, you are already applying the theory.
How is this different from what I already learned?
It is the source material. The trend definitions, support and resistance behavior, and volume ideas you studied earlier are classical Dow theory observations repackaged. Learning Dow Theory does not add new tools; it explains why your existing tools are built the way they are.
What is the biggest practical takeaway?
Trade with the primary trend and treat unconfirmed moves with suspicion. Most of the damage new traders take comes from fighting the main trend or chasing breakouts that nothing else in the market supports.
Your next step is to pull up a daily chart of a major index and label it yourself. Mark the primary trend, find one secondary reaction, and try to spot where accumulation and distribution happened. Dow Theory only becomes useful when you start seeing it in live price, and the next lesson on trend analysis will give you the tools to do exactly that.