The Three Core Principles of Technical Analysis
The core principles of technical analysis come down to three ideas, usually credited to classical Dow theory: the market discounts everything, prices move in trends, and history tends to repeat itself. Every chart pattern, indicator, and trading method you will ever study rests on these three claims. If you understand them deeply, you understand why technical analysis works when it works, and why it fails when it fails.

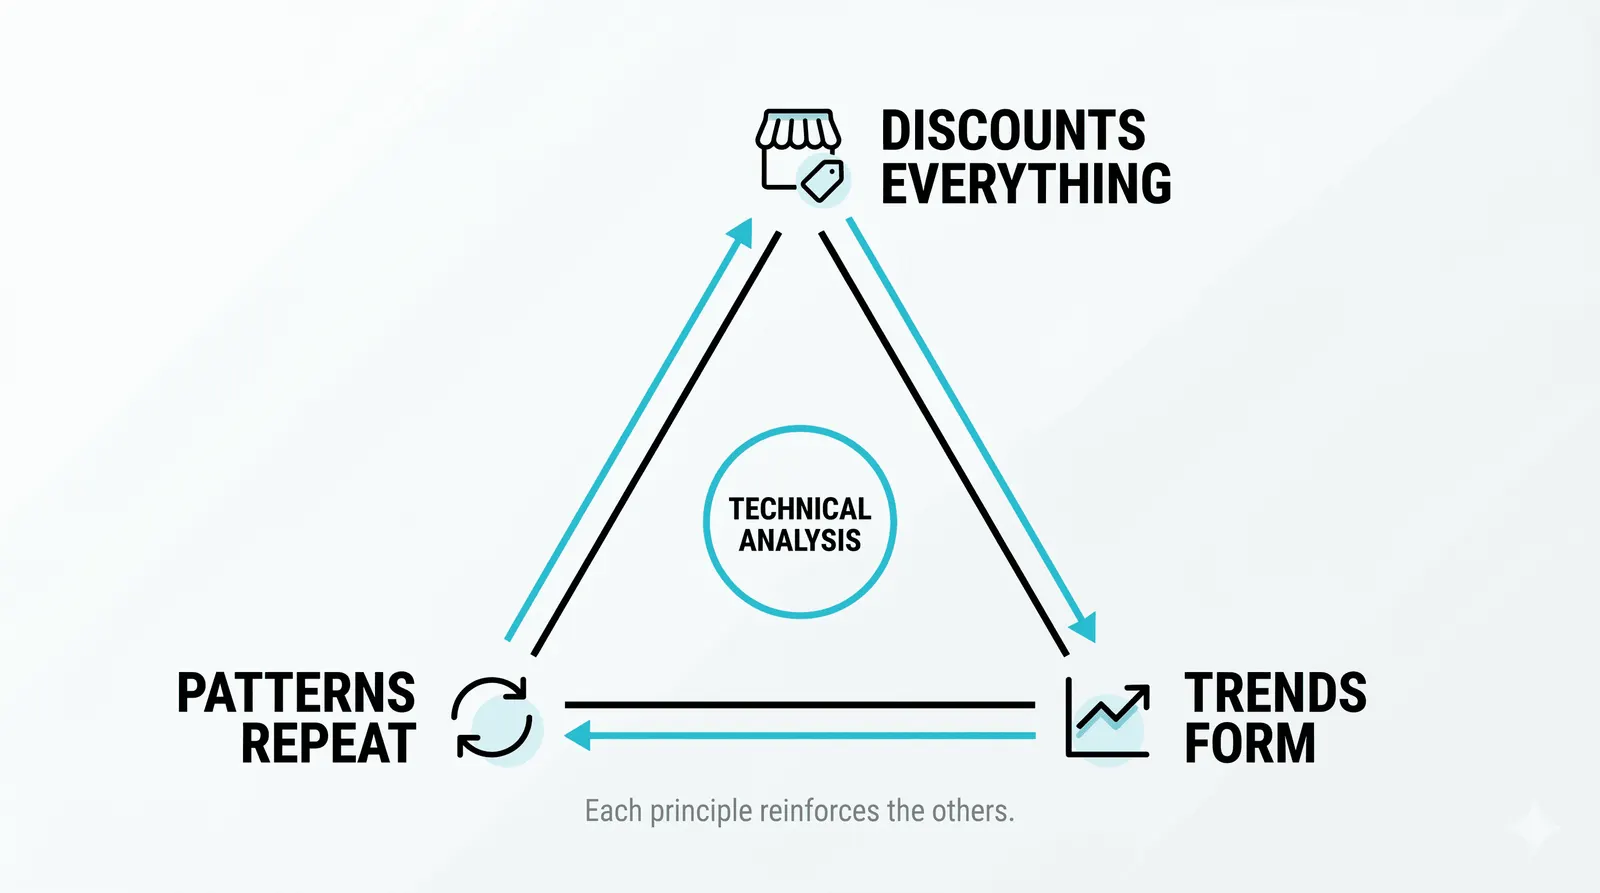
Think of the three principles as the legs of a stool: remove one and the whole seat tips over. Each leg supports the others, and your job as a trader is to know what each one can and cannot carry.
Principle One: The Market Discounts Everything
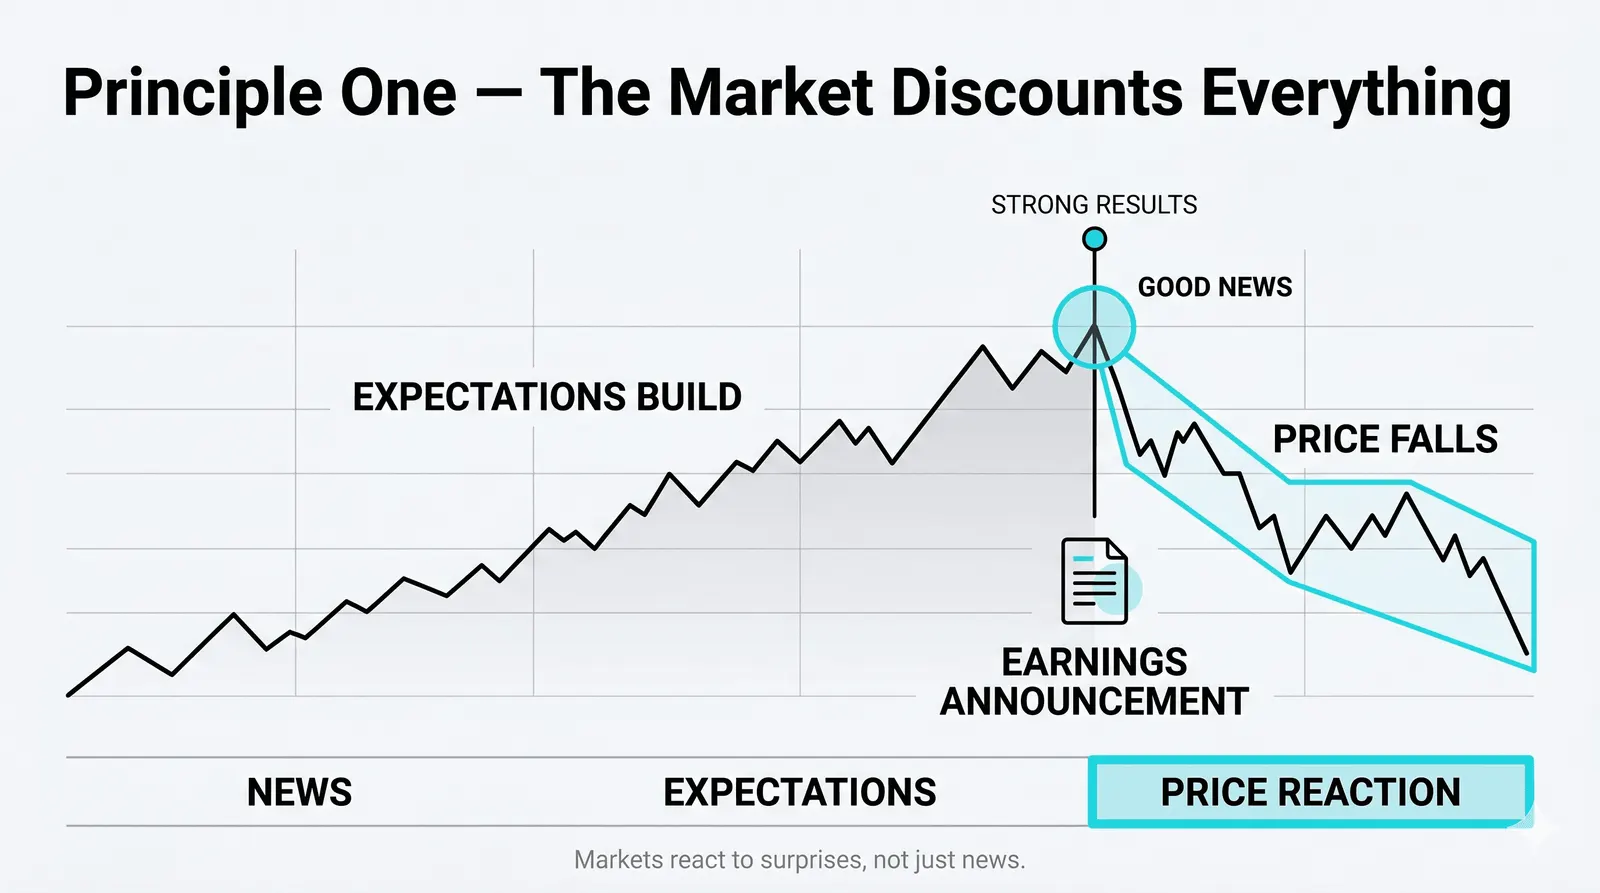
The first principle says that every known fact and every expectation about the future is already inside the price. Earnings, interest rates, wars, weather, rumors, fear, greed. All of it gets compressed into a single number: the last traded price.
This is a bold claim. It means the chart is not just a record of transactions. It is the sum of every opinion in the market, weighted by how much money each opinion is willing to risk. A pension fund buying ten million shares moves the price more than a hundred retail traders combined, so the chart reflects conviction, not just headcount.
The practical payoff is huge. You do not need to read every news story or predict every earnings report. You need to read what the price is doing, because the price already includes the news. When bad headlines hit and the price refuses to fall, the market is telling you the bad news was already priced in. That is information no article can give you.
Here is the blunt version: if your analysis requires you to out-research the entire market, you will lose. The discounting principle frees you from that race. Your edge comes from reading the reaction, not from knowing the fact first.
Principle Two: Prices Move in Trends
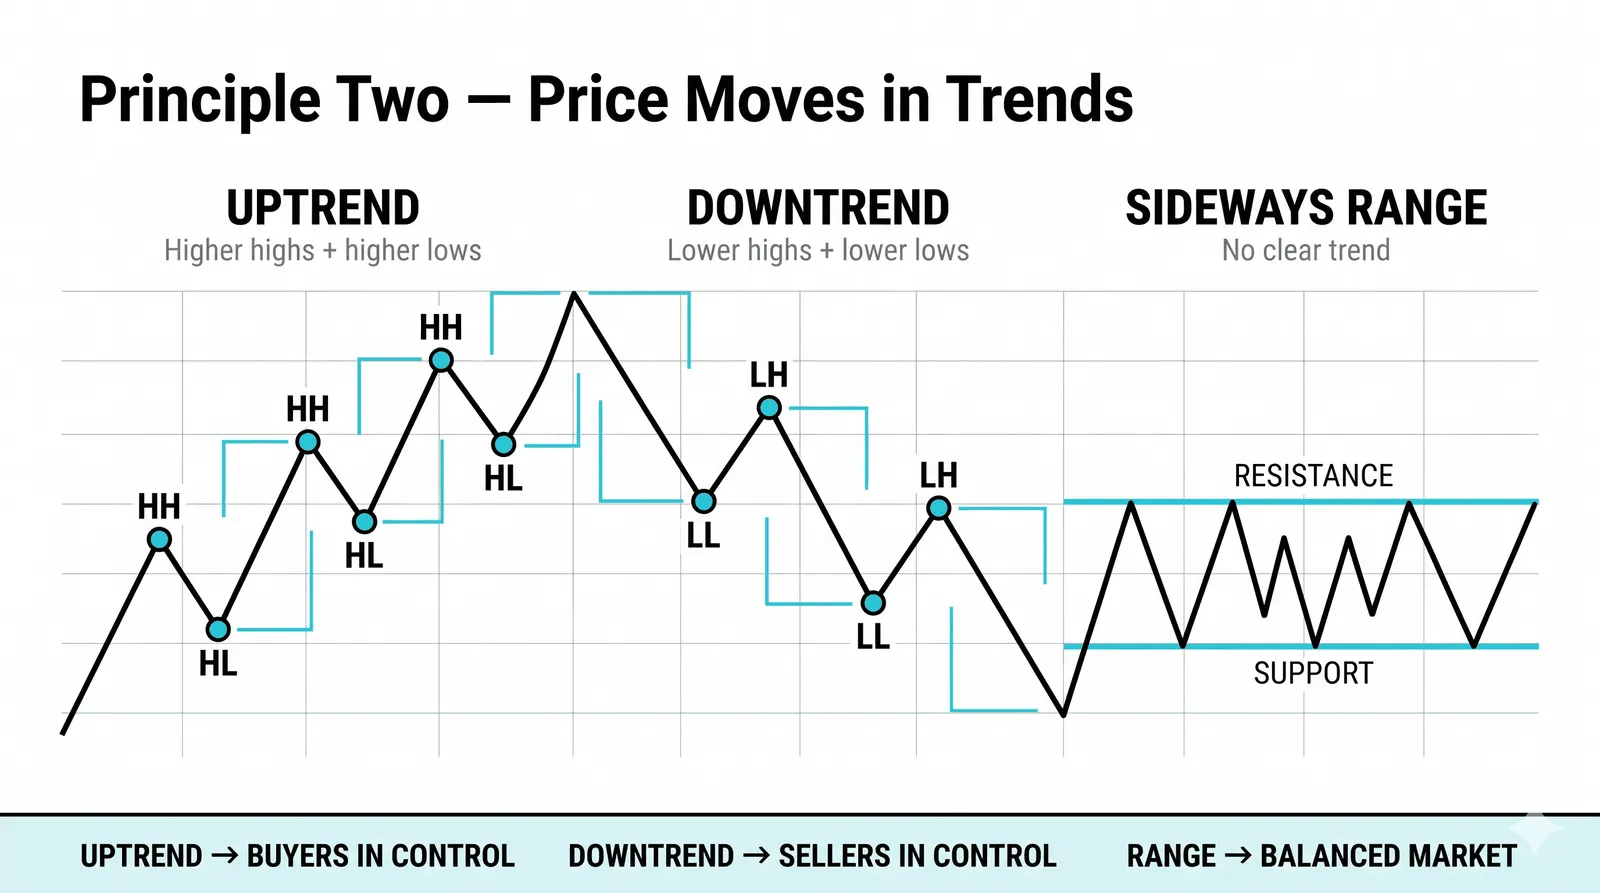
The second principle says that once a price starts moving in a direction, it is more likely to continue than to reverse. Trends persist. This is the single most useful assumption in all of trading.
If prices moved randomly, no method could give you an edge, and technical analysis would be astrology with better graphics. The whole discipline exists because prices do not move randomly. They trend, and trends give you odds better than a coin flip.
You already know the basics of trends from earlier lessons: uptrends make higher highs and higher lows, downtrends make lower highs and lower lows. Within those trends, prices swing. They push forward, pull back, and push forward again. Those swings are normal breathing, not signs the trend is dead.
The trader's job under this principle is simple to state and hard to do. Find the trend, trade in its direction, and stay with it until the price action proves it over. Most beginners do the opposite. They sell winners early and hold losers, betting against the one force that actually pays.
Principle Three: History Repeats, or at Least Rhymes
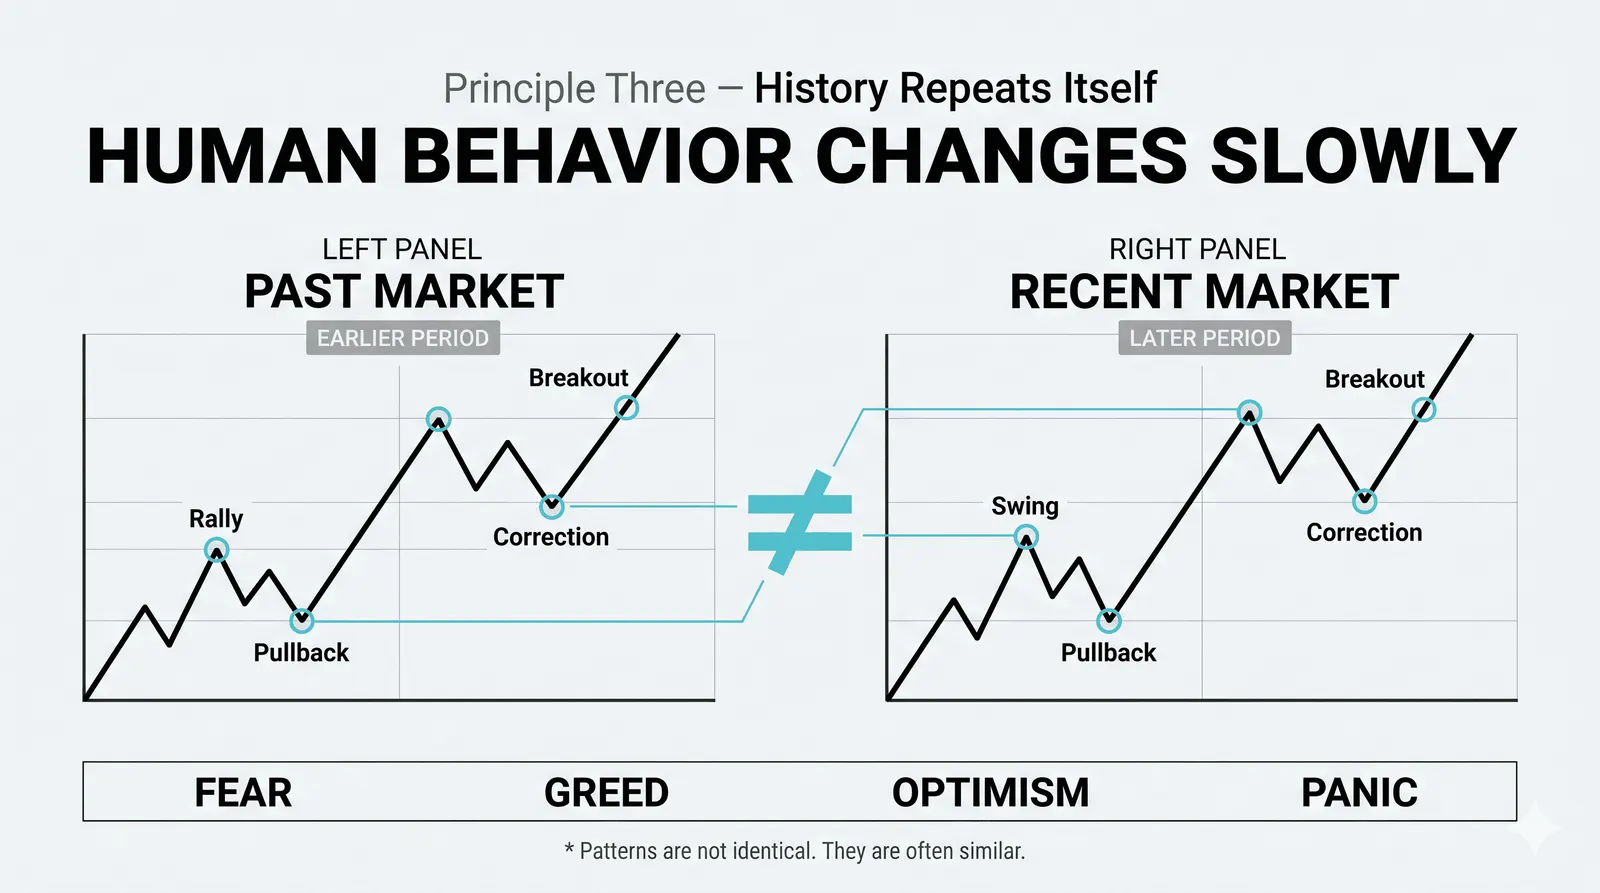
The third principle says price patterns recur because human behavior recurs. The crowd's reaction to pressure and relief has not changed much in a century. Fear looks the same on a chart in 1929 as it does today. So does greed.
This is why patterns like double bottoms, breakouts from bases, and failed rallies keep showing up. They are not magic shapes. They are echoes of the same emotional cycle playing out again: doubt, hope, euphoria, denial, panic. The names of the stocks change. The feelings do not.
Notice the careful wording. History rhymes. It does not photocopy. A pattern that worked the last ten times can fail the eleventh, and it will fail exactly when the most people believe in it. The principle gives you a tendency, not a guarantee.
A Worked Example With Round Numbers
Here is a hypothetical stock trading at 40. Say it drops to 40 three separate times over two months, and each time buyers step in and push it back up. Then it breaks above 45 on strong volume.
All three principles are visible in that one chart. First, the discounting principle: the stock fell to 40 on bad news, but it stopped falling there, which tells you the bad news was already absorbed. Second, the trend principle: each bounce off 40 ended a little higher than the last, building a quiet uptrend of higher lows before the breakout. Third, the repetition principle: the base-and-break shape is one of the oldest patterns in the book, and traders recognized it because they had seen it hundreds of times before.
A trader acting on this might buy the breakout at 45 with a stop below 42, risking 3 to make a first target of 51. The numbers are clean because the example is hypothetical. Real charts are messier, but the logic is identical.
Where the Principles Bend and Break
Honest teaching requires the other side. Each principle has a failure mode, and knowing it keeps you from becoming a true believer.
- Discounting fails when facts change fast. A surprise rate decision or a sudden scandal is not in the price yet. The market discounts what is known, not what is about to be known.
- Trends end. Every trend you ride will eventually reverse, and the chart rarely rings a bell at the top. This is why stops and exits matter more than entries.
- History rhymes badly under new conditions. A pattern formed in a low-volume, quiet market may mean nothing during a panic. Context decides whether the rhyme holds.
None of this kills technical analysis. It just means the principles describe probabilities, not laws of physics. You trade the odds and manage the times the odds lose.
The Three Principles Side by Side
| Principle | What It Assumes | What It Lets You Do |
|---|---|---|
| The market discounts everything | All known information and expectations are already in the price | Trade the chart without chasing every headline |
| Prices move in trends | Motion persists more often than it reverses | Trade with the trend for better-than-random odds |
| History repeats itself | Crowd psychology is stable, so patterns recur | Recognize familiar setups and act on them early |
Read the table as a chain. Discounting tells you the chart is worth reading. Trending tells you which direction to trade. Repetition tells you when to act. Pull one out and the method collapses into either news-chasing, random guessing, or pattern superstition.
Questions About the Core Principles of Technical Analysis
Are the three principles proven?
No, they are working assumptions, not proven laws. Decades of market data support the existence of trends and recurring patterns, but no study can guarantee they will hold tomorrow. Treat them as a useful model of how markets behave, and size your trades so a broken assumption costs you a little, not a lot.
Do the principles apply to all markets?
Yes, they apply to any liquid market with free price movement: stocks, forex, futures, crypto, and commodities. They work worst in thin, manipulated, or heavily controlled markets, where a single player can override the crowd. Liquidity is what makes the crowd's opinion meaningful.
Which principle matters most for a beginner?
The trend principle matters most, because it directly shapes every trade you take. Beginners lose the most money by fighting trends, and they fix that problem fastest by learning to trade only in the trend's direction. The other two principles explain why the chart is trustworthy; this one tells you what to do with it.
What came after Dow?
These ideas were expanded by later writers into what became Dow Theory, and later analysts built chart patterns, indicators, and volume methods on top of the same foundation. A separate lesson covers Dow Theory in detail. For now, treat these three principles as the ground floor everything else is built on.
Your next step is to open a chart and test these ideas yourself. Find a stock that based and broke out, and mark where each principle showed up. Once you can see all three on a live chart, you are ready to study how trends are confirmed and traded in the lessons ahead.