Donchian Channels, Explained
Donchian Channels mark the actual extremes of the recent market: the highest high of the last N bars as the upper line, the lowest low of the last N bars as the lower line, and the average of the two as a middle reference. No smoothing, no statistics, no engine between the price and the line. When a new 20-bar high prints, the upper channel steps up to meet it that bar.

A high-water mark on a bridge pylon does the same job for a river. The line sits at the level the water actually reached, not at an average of recent levels, and it only moves when a new record arrives. Everything the channel shows is a fact about what happened, which is both its honesty and its blindness: the line knows where the extremes were, and nothing about what comes next.
This lesson belongs to the same volatility category as the channel tools covered already, and it pairs with the Bollinger Band breakout lesson, which owns the close-versus-touch and head-fake mechanics this lesson applies to a rawer line.
The Construction: Raw Extremes
The default channel uses 20 bars. The upper line is the highest high of those 20 bars, the lower line is the lowest low, and the middle line, which many platforms plot, is the average of the two. That middle line is also the level a mean-reverting trade would target, the center of the recent range.
Because the lines are computed from extremes, they move in steps. Between new records, the channel is perfectly flat. A new high lifts the upper line by exactly the amount the new high exceeds the old one, then it freezes again. Traders used to smoothly curving indicators find the staircase look odd at first; it is the visual signature of a tool that refuses to average anything.
The Trend Use: Breakouts and the 4-Week Rule
The channel was the trend-follower's tool long before the modern volatility channels existed. Richard Donchian, the mid-century futures pioneer, built a systematic trend approach on exactly this structure, and the classic rule bearing the idea carries a four-week window: buy when price makes a new four-week high, sell when it makes a new four-week low. The Turtle traders' famous program later ran variations on the same skeleton with shorter and longer channels together. The logic has not aged: a market can only be in a genuine trend if it keeps printing new extremes, and buying new extremes is the only way trend-following can be true to itself.
The execution mechanics transfer straight from the breakout lesson: a close beyond the channel is the event, a wick through it is a visit, and the strongest breakouts depart from channels that had been pinching narrow. What the Donchian line adds is purity, the breakout level is the actual extreme price reached, with no average in the way.
The Whipsaw Cost
The cost arrives in flat markets, and it is steep. A range keeps nudging new 20-bar highs by a hair, the channel buys them, and the range immediately pulls price back to the lower extreme where the symmetric rule sells. Repeat for months. Each crossing loses a small amount, and the strategy's entire profit comes from the rare trend that pays for all of them.
Two defenses exist and both are older than the channel itself. The trend filter: only take upside breakouts when the market's trend-strength read, the one covered in the ADX lesson, agrees that a trend regime is plausible. And the second channel: run a longer Donchian for the trend bias and a shorter one for timing, so the whipsaws at least stop contradicting the position. The fake-breakout problem has no cure, only management; order-flow writers who studied fake patterns in detail concluded the same thing the channel pioneers knew, that some breakouts exist purely to trap the crowd, and survival means paying the small losses on schedule.
Donchian vs Bollinger vs Keltner
Three channel tools, three definitions of the edge. The Donchian line sits where price actually went, the extreme itself. The Bollinger line sits two standard deviations from an average, a statistical envelope that can sit inside the Donchian extreme when closes cluster, and outside it when a wick-heavy bar stretches the deviation. The Keltner line sits 1.5 average true ranges from its average, an envelope of typical travel. In trends, the Donchian line rides farthest out, because trends keep making real extremes. In quiet, all three pinch, which is why every squeeze-style measurement has cousins built on each engine.
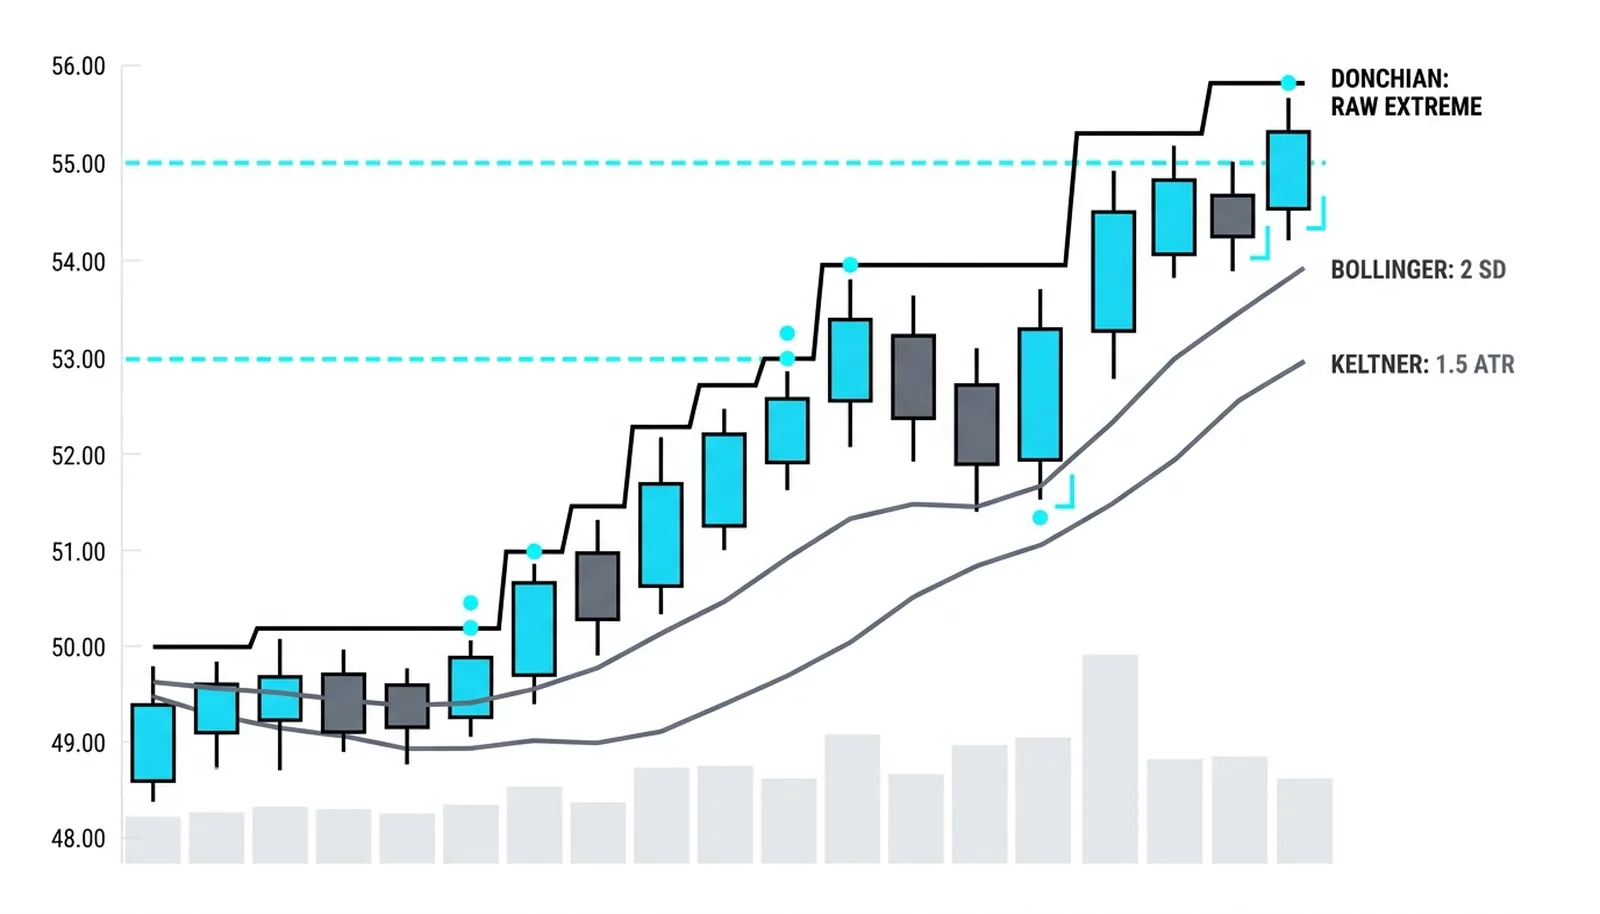
Choose by intent. Breakout trading wants the raw extreme, because that is the level the crowd watches and the level a record represents. Statistical reads want Bollinger's deviation. Pace-of-travel reads want Keltner's ATR. The lines disagree most at turning points, which is where the choice actually costs or earns money.
One Channel, Traded
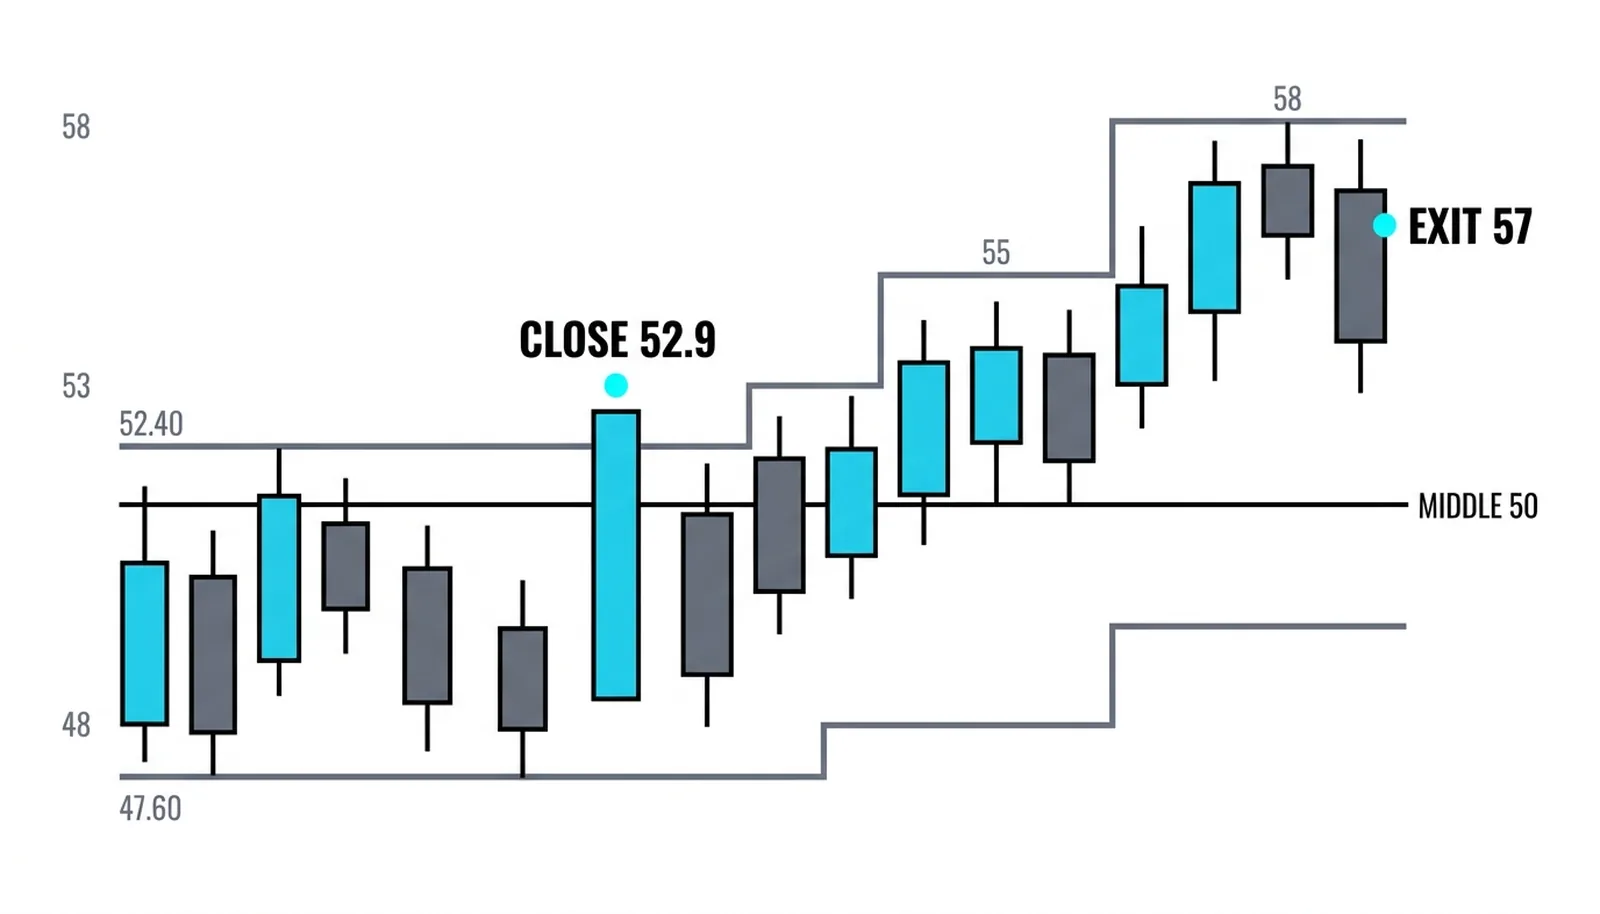
Round numbers, all hypothetical. A market has ranged between 48 and 52 for two months. The 20-bar Donchian upper line sits at 52.4, the low at 47.6, the middle at 50.0.
Tuesday the market closes at 52.9, above the channel. The breakout rule buys, with the stop at the channel middle, 50, because a trend trade that returns through the full recent range is no longer a trend trade. Three weeks of stair-stepping highs follow, the upper channel ratcheting from 52.4 to 55 to 58, each step a new fact. Then a close back below the middle channel at 57 takes the exit, roughly 8 percent over entry.
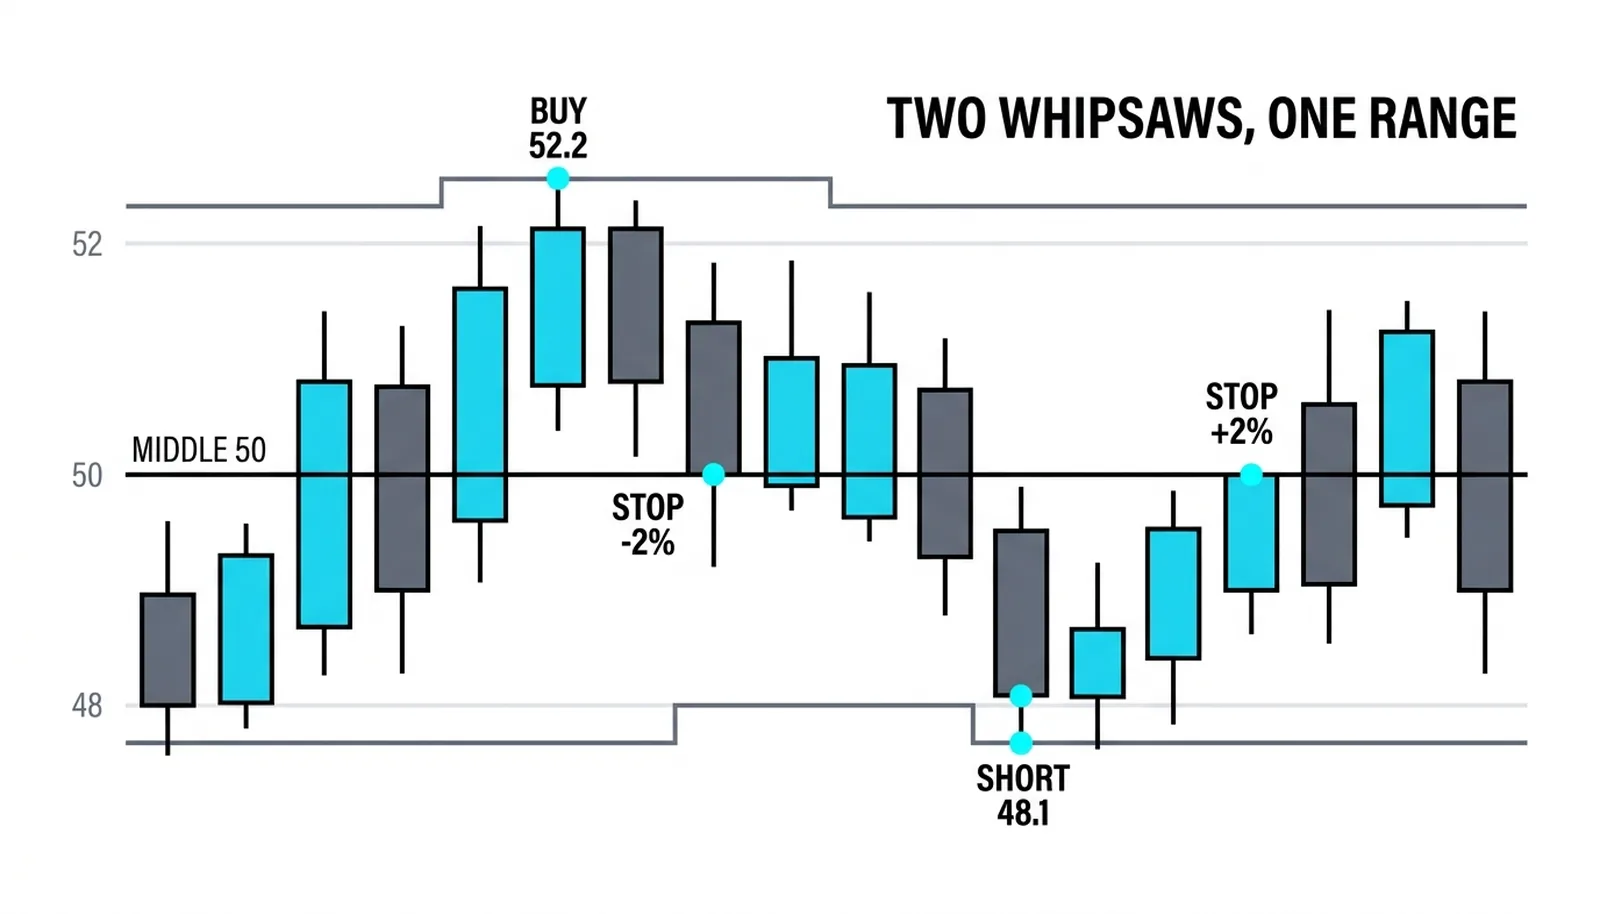
The whipsaw ledger from the same market, one quarter earlier: a close at 52.2 above the then-channel bought, price returned inside two sessions and stopped out at 50 for about 2 percent. Two weeks later the symmetric short at 48.1 stopped for another 2 percent. The trend trade at the end paid for both, which is the channel strategy's whole business model stated in numbers.
| Channel state | What it says | The appropriate response |
|---|---|---|
| Close above the upper channel | A new N-bar extreme; trend condition possible | Breakout entry per the regime filter, stop at the middle or structure |
| Close below the lower channel | New N-bar low; downside trend condition | Symmetric treatment, same filter |
| Channel narrow and flat | A two-month range; extremes are close together | Expect whipsaws; the squeeze-style logic applies |
| Channel stepping steadily in one direction | Trend regime; records keep arriving | Hold per the trailing rules; the steps are the trend |
Donchian Channels, Answered
What are Donchian Channels?
The highest high and lowest low of the last N bars, drawn as two lines with their average in the middle. Twenty bars is the common default. The lines are raw extremes, so they move in steps, updating only when a new record prints.
What are Donchian Channels useful for?
Breakout and trend trading: closes beyond the channel are new N-bar extremes, which is the raw definition of a trend condition, and the four-week rule built on this structure is one of the oldest systematic trend approaches on record. The middle line doubles as the natural target for range-trading between the lines.
Why do Donchian breakouts fail so often in ranges?
Because in a range every small nudge past the old extreme is a marginal new record, the channel buys it, and the range pulls back. The failure rate is the premium paid for catching genuine trends, which is why regime filters and a second, longer channel exist: they trim the trades that fund nothing.
How is the Donchian Channel different from Bollinger Bands?
The Donchian line is the actual extreme price reached; the Bollinger line is two standard deviations from an average. One is a record, the other a statistic. Donchian rides farthest out in trends and steps flat between records, while Bollinger's smooth envelope tracks the scatter of closes and responds to wicks and clusters the Donchian ignores.