Pivot Points: The Classic Levels, Explained
Every trading morning, before the first order fills, seven price levels can be computed from yesterday alone, and they behave like the round numbers every trader watches, except with arithmetic instead of psychology behind them. High, low, close, one formula, and the day gets a map: a central pivot with three resistance levels stacked above and three support levels below. These are the classic pivot points, the oldest pre-computed levels in trading, and the reason they matter is self-fulfilling in the useful sense. Enough traders watch them that price tends to react where the formula says it should.

The picture that fits them: buoys set out before a voyage. The harbor master places the marks before any boat leaves, and every captain navigates by the same buoys. Nobody moves a buoy mid-voyage, which is exactly what makes them useful for planning. Unlike indicators that calculate as the session runs, pivot levels are fully known at the open, and that changes how you trade them. Where the levels come from, and how the classic, Fibonacci and Camarilla families differ, is this lesson. The deeper game of stacking horizons lives in the daily, weekly and monthly pivots lesson.
The Classic Formula: Seven Levels From Three Numbers
The floor-trader formula needs only the prior session's high, low and close, and the levels it draws behave as a ready-made layer on top of any support and resistance work you already do. The central pivot is their average: P = (high + low + close) ÷ 3. Then the ranges fan out symmetrically:
| Level | Formula | Role |
|---|---|---|
| R3 | R1 + (high − low) | Extreme resistance; rare on a calm day |
| R2 | Pivot + (high − low) | Usual ceiling of a strong day |
| R1 | 2 × Pivot − low | First resistance above the pivot |
| Pivot (P) | (high + low + close) ÷ 3 | The day's fairness line; heaviest weight |
| S1 | 2 × Pivot − high | First support below the pivot |
| S2 | Pivot − (high − low) | Usual floor of a weak day |
| S3 | S1 − (high − low) | Extreme support; rare on a calm day |
A worked session makes the distances concrete. Yesterday traded between a high of 106.00 and a low of 104.00 and closed at 105.40. The pivot is (106.00 + 104.00 + 105.40) ÷ 3 = 105.13. The range was 2.00 points, so R1 = 2 × 105.13 − 104.00 = 106.27 and S1 = 2 × 105.13 − 106.00 = 104.27. R2 and S2 sit a full range away at 107.13 and 103.13, and R3 and S3 at 108.27 and 102.27. Seven numbers, known before the open, spaced by arithmetic rather than opinion.
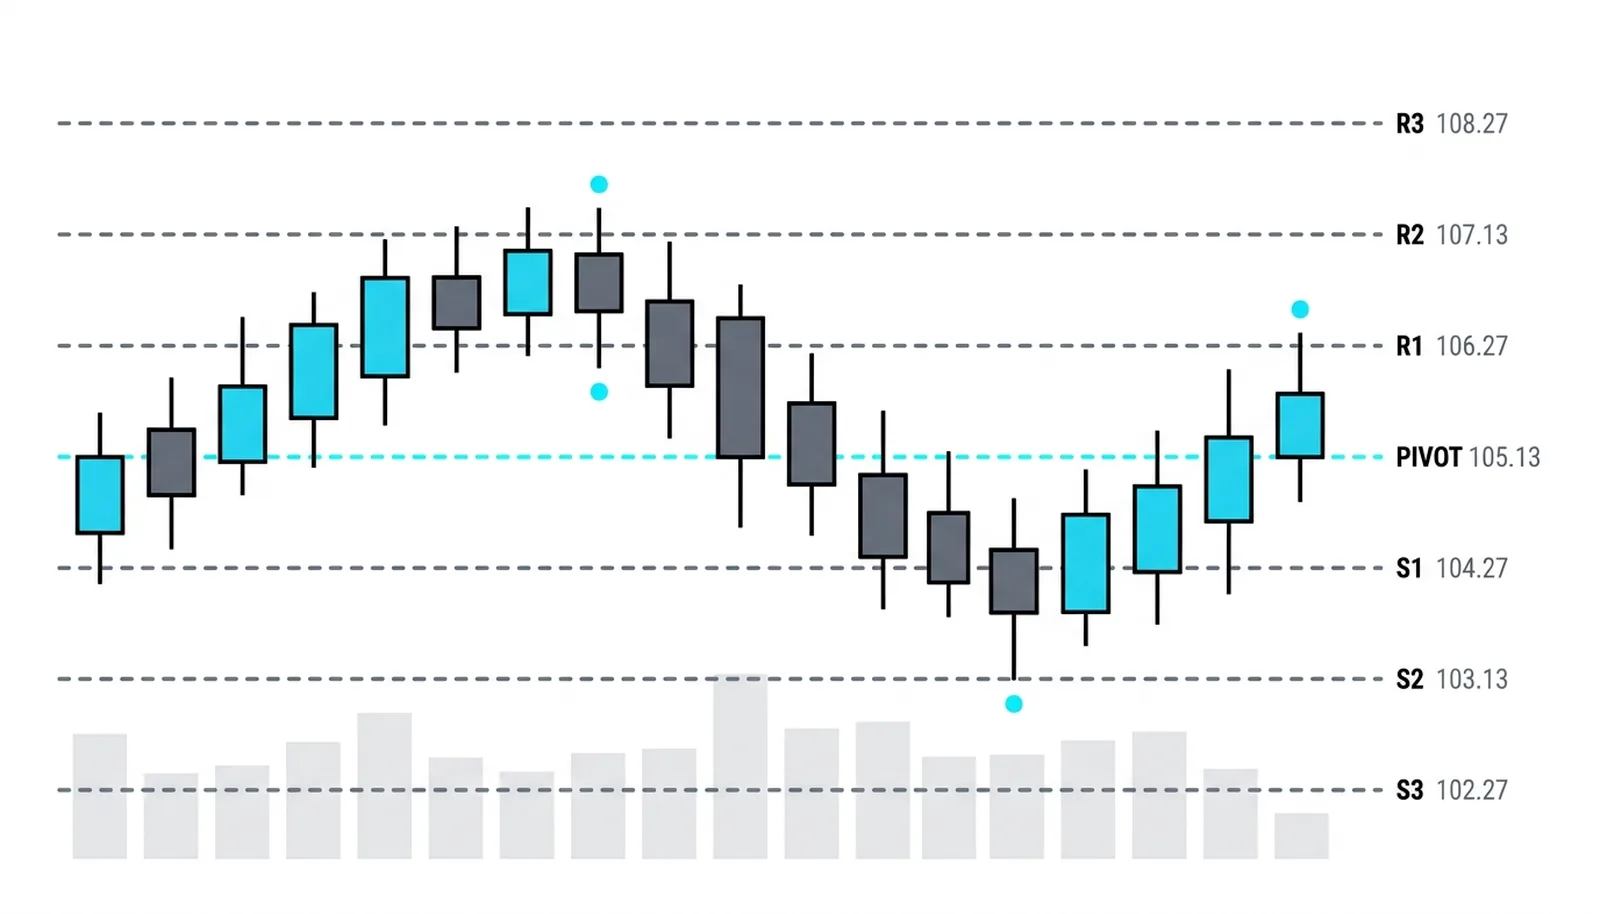
The session above spent its whole day inside the ladder. That is the normal case: most days live between R2 and S2, and touches of R3 or S3 mark genuinely unusual sessions.
Two Day Types, Two Playbooks
Day trading practice sorts sessions by how price behaves at key levels, since these levels are traded on index futures daily. The trend day: price pushes through a level, pauses, then keeps going. The trade is the first pullback to the broken level after the push. The chop day: price pokes a level, stalls, and drifts back the way it came, all day long. The trade is the fade, selling the poke at resistance and buying the dip at support, with standing orders at the levels.
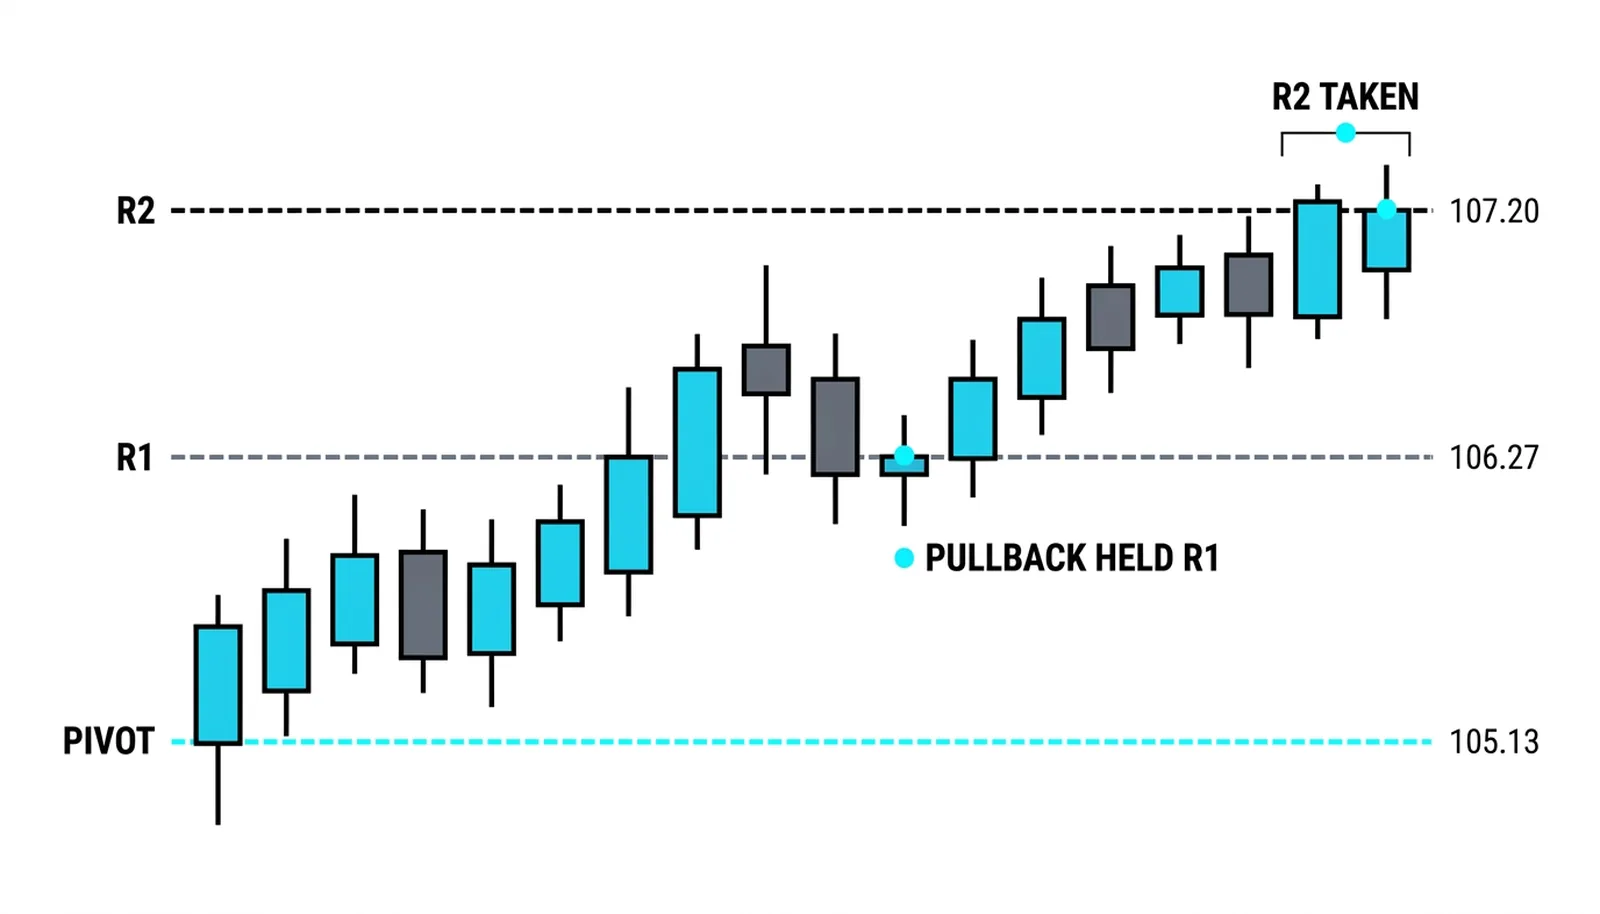
The trend day above never closed below the pivot after the first half hour. Open above the fairness line, hold it, and the ladder becomes a staircase: R1 taken, pullback to it, then R2. The read that matters is the open's relation to the pivot, because trading above the central pivot is the bullish tell, and below it the bearish one, per the classic interpretation.
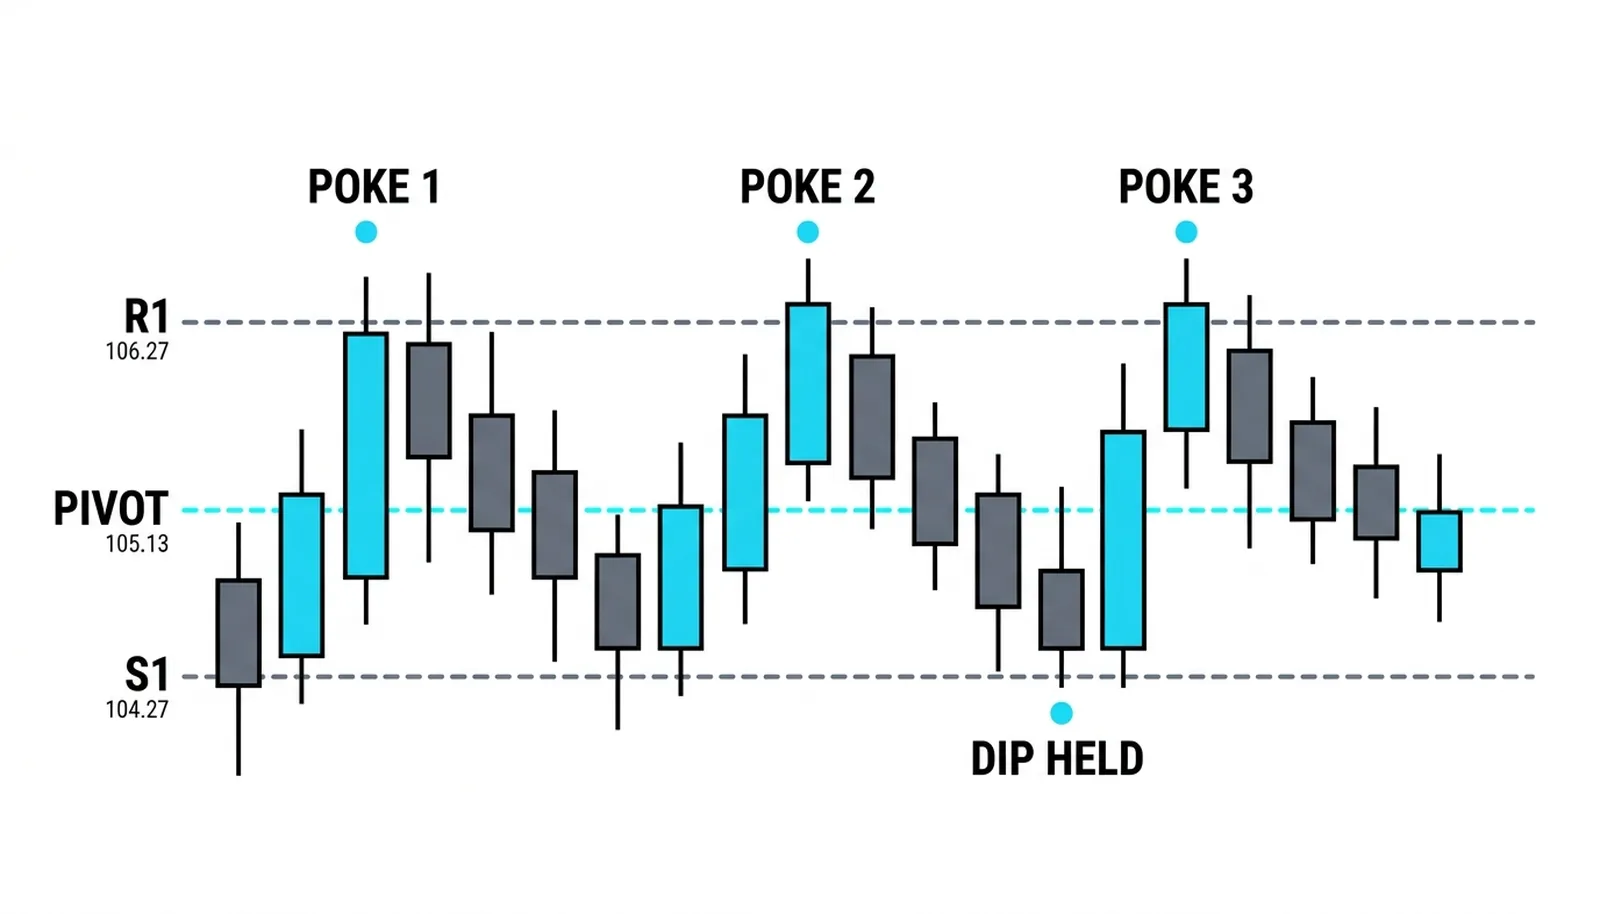
The chop day inverts everything. Three separate touches, three rejections, and the session fades between the levels instead of climbing them. The practical observation from day trading practice is this: on these days the indicator traders get their buy signals at the tops and their sell signals at the lows, and the levels are where that money gets taken. Knowing which day you have, trend or chop, decides whether the same level is an entry or a trap, and the first hour usually shows it.
The Fibonacci and Camarilla Variants
Two other families share the same skeleton: a central pivot from yesterday's prices, with bands fanning out by different spacing rules. The Fibonacci variant keeps the same pivot and spaces R1 through R3 at 0.382, 0.618 and 1.0 times the prior range above it (S1 through S3 mirrored below). Traders already fluent in Fibonacci retracements read these naturally; the bands land where retracement eyes already look, which is the entire appeal. The exact multipliers vary by platform, with some using 0.764 for the outer band, so check your own chart's convention before comparing notes.
Camarilla levels take a different shape entirely: eight levels computed from the close and the range, multiplied by fractions of 1.1, with the tightest pair hugging the close and the outer pair, R4 and S4, sitting beyond the classic R1 and S1. The set is attributed to Nick Stott, a bond trader working in the late 1980s. The Camarilla playbook treats the inner band as a fade zone and the outer band as the breakout trigger: price closing through R4 or S4 has left the range the equation drew.
The quick way to keep the families straight: classic floor pivots space their bands by range multiples, symmetric around the pivot, and suit index and futures day traders. Fibonacci pivots space theirs at the retracement fractions and suit traders who already think in those terms. Camarilla spaces eight levels off the close itself and suits range-faders who want an outer breakout trigger. Same skeleton, three spacing philosophies, and the one on your chart matters more than the one with the best story.
Pivot Points, Answered
Which prior session do the levels come from?
The one that just closed: yesterday's high, low and close for daily pivots, last week's for weekly, last month's for monthly. On futures the settlement price is the one that counts, and using a midnight-to-midnight bar instead can shift every level on the chart.
Do pivot points work on all markets?
They work best where lots of traders share the same session clock: index futures, large-cap stocks, the big forex pairs. Anything with thin or round-the-clock volume distributes the attention that makes the levels react, and the reactions get softer.
Should I enter at the level automatically?
No. The level is where something is likely, and the entry still needs the price behavior: the push-through-and-pullback on trend days, the stall and reject on chop days. Levels tell you where to watch, and the confirmation habits from ordinary support and resistance carry over unchanged. The difference is preparation: the levels exist before the session starts, so the watchlist is built while the market is closed and the decision at each level was made hours ago, not in the heat of the move.
The seven levels are the single-day map. The same formula computed on weekly and monthly bars, stacked with the daily set, is where the method gets its real depth, and that stack is the next lesson.