Cup and Handle Pattern
A cup and handle pattern is a rounding bottom followed by a small, shallow pullback, and it becomes a trade when price closes above the rim of the cup. The cup is the market rebuilding after a decline. The handle is the last shakeout before it leaves. You will see this shape on weekly charts of stocks that survived a rough patch and quietly recovered, and it is one of the more reliable continuation-and-reversal hybrids you can learn to read.

Think of it like a ball rolling in a smooth bowl, then bouncing off the rim one last time before it clears the edge. That single image carries most of the logic. The rest of this lesson is about reading each part with enough precision to trade it, and enough skepticism to skip the bad ones.
The Cup: Where Selling Runs Out
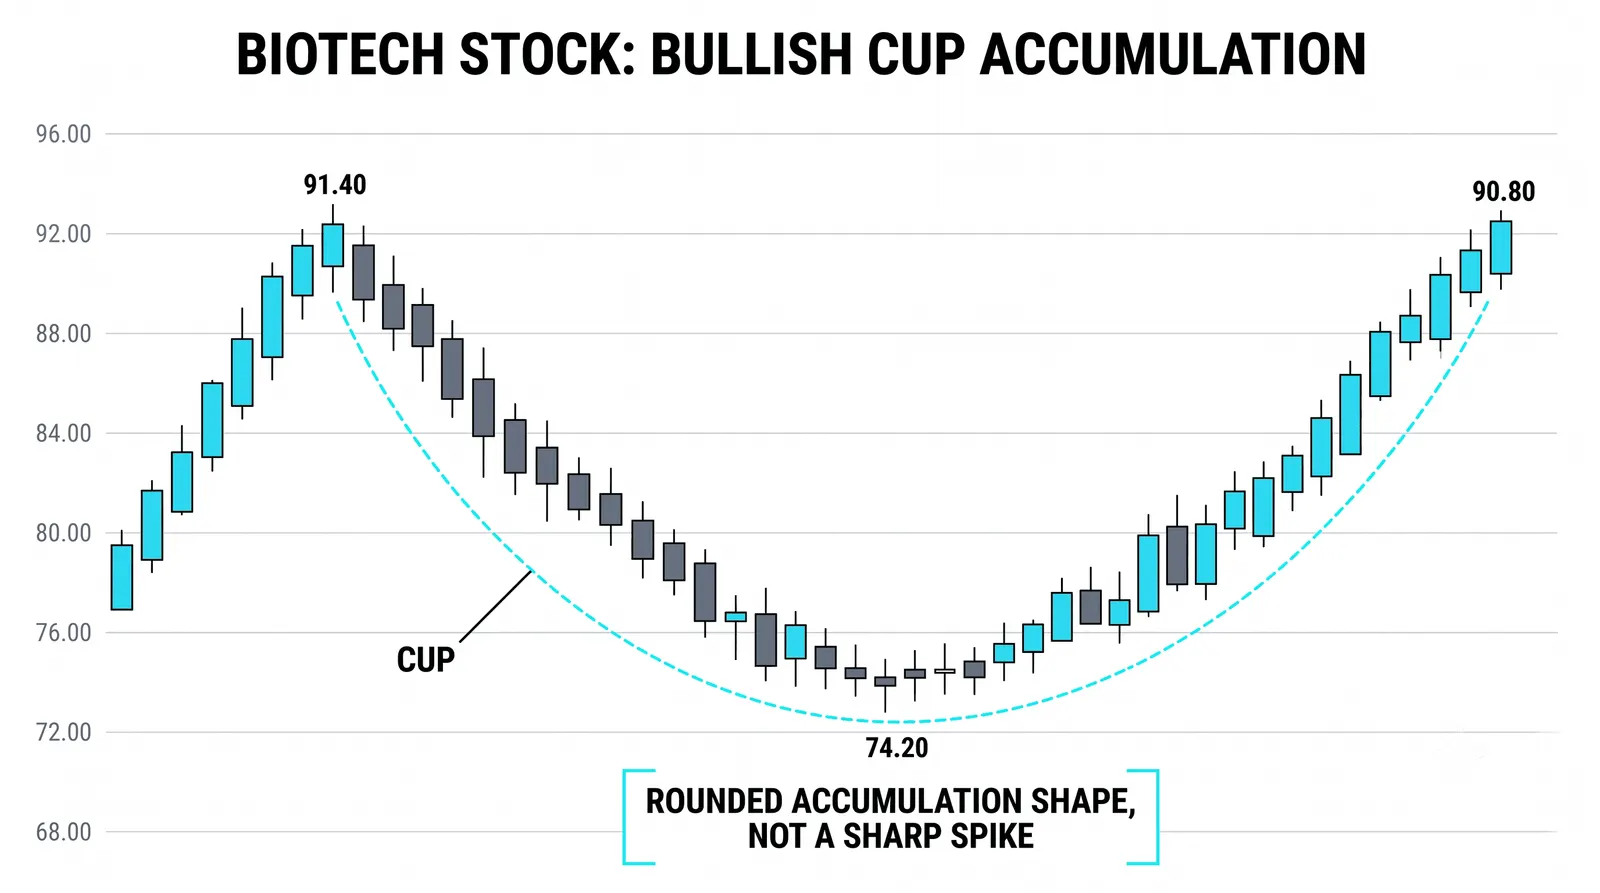
The cup is a rounded base. It forms over weeks to months, not days. Price drifts down, flattens, and drifts back up to roughly where the decline started. That recovery level is the rim.
What the cup records is a transfer of ownership. Early in the decline, sellers are in control and every bounce gets sold. Somewhere along the bottom, the selling fades. Volume dries up. Down moves get shallower. Then buyers start returning, quietly, and the lows begin to rise.
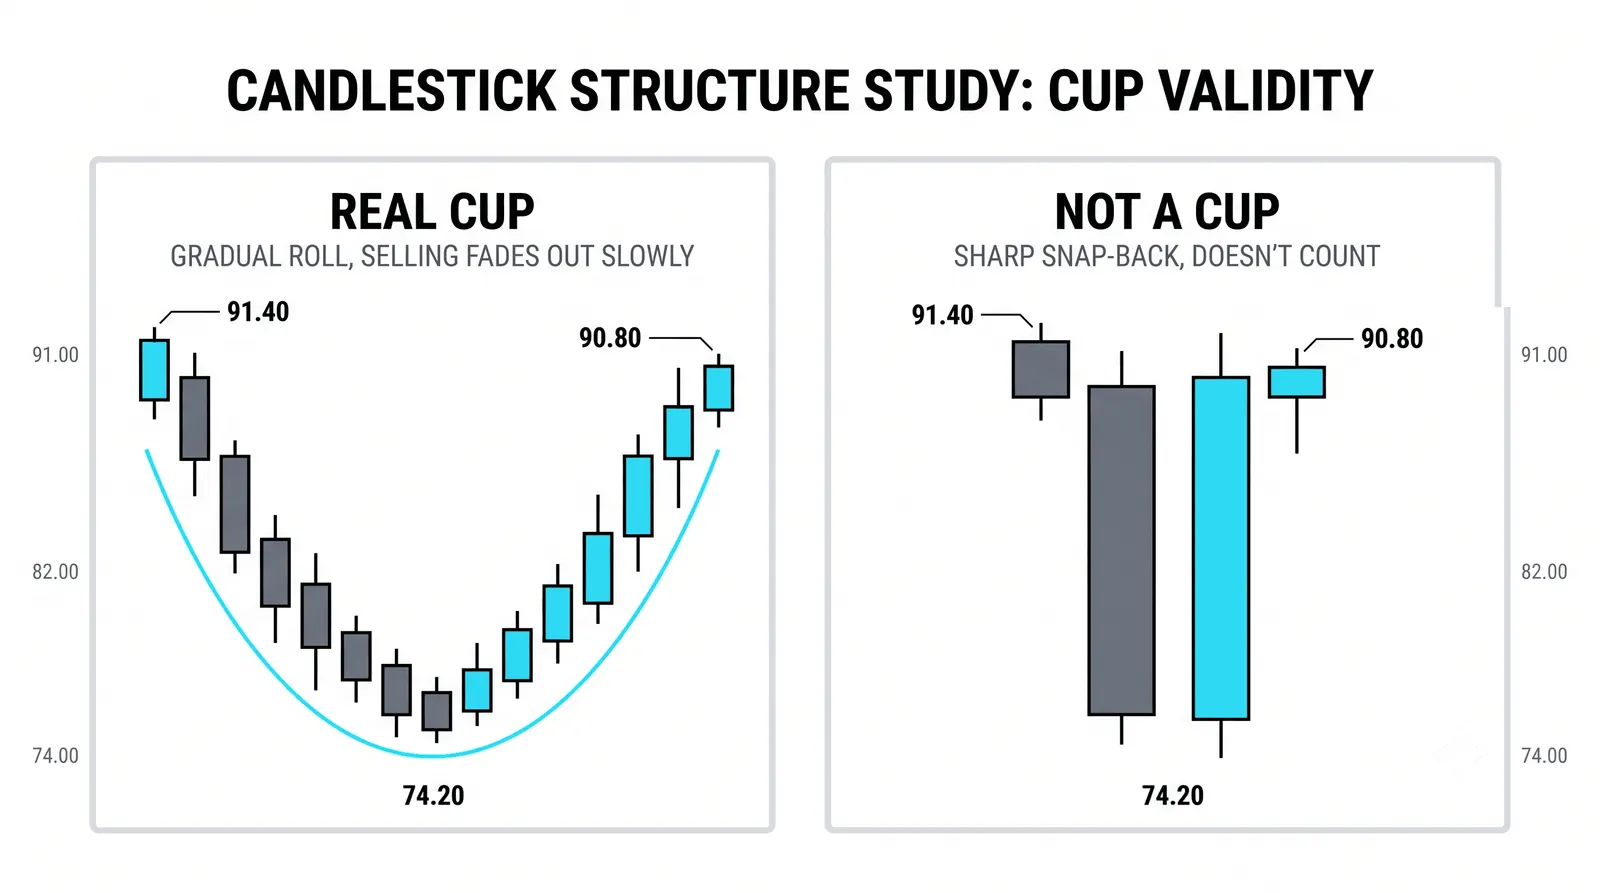
The rounded shape matters more than most beginners expect. A V-shaped recovery tells you one violent swing happened, often on a single news event, and those moves frequently give back their gains just as fast. A rounded bottom tells you the balance shifted gradually. Gradual shifts tend to hold, because they reflect many participants changing their minds over time rather than a few reacting to one headline.
When you evaluate a cup, check a few things:
- Symmetry. The left side down and the right side up should take roughly comparable time. A two-month slide followed by a three-day spike back is not a cup.
- Depth. A reasonable cup retraces a meaningful chunk of the prior advance but does not collapse through it. Extremely deep cups carry more overhead damage.
- Volume behavior. Ideally volume contracts through the bottom of the cup and expands as the right side builds. That is the signature of accumulation.
- The rim. Both sides of the cup should top out near the same price. That level becomes your line.
The Handle: The Last Shakeout
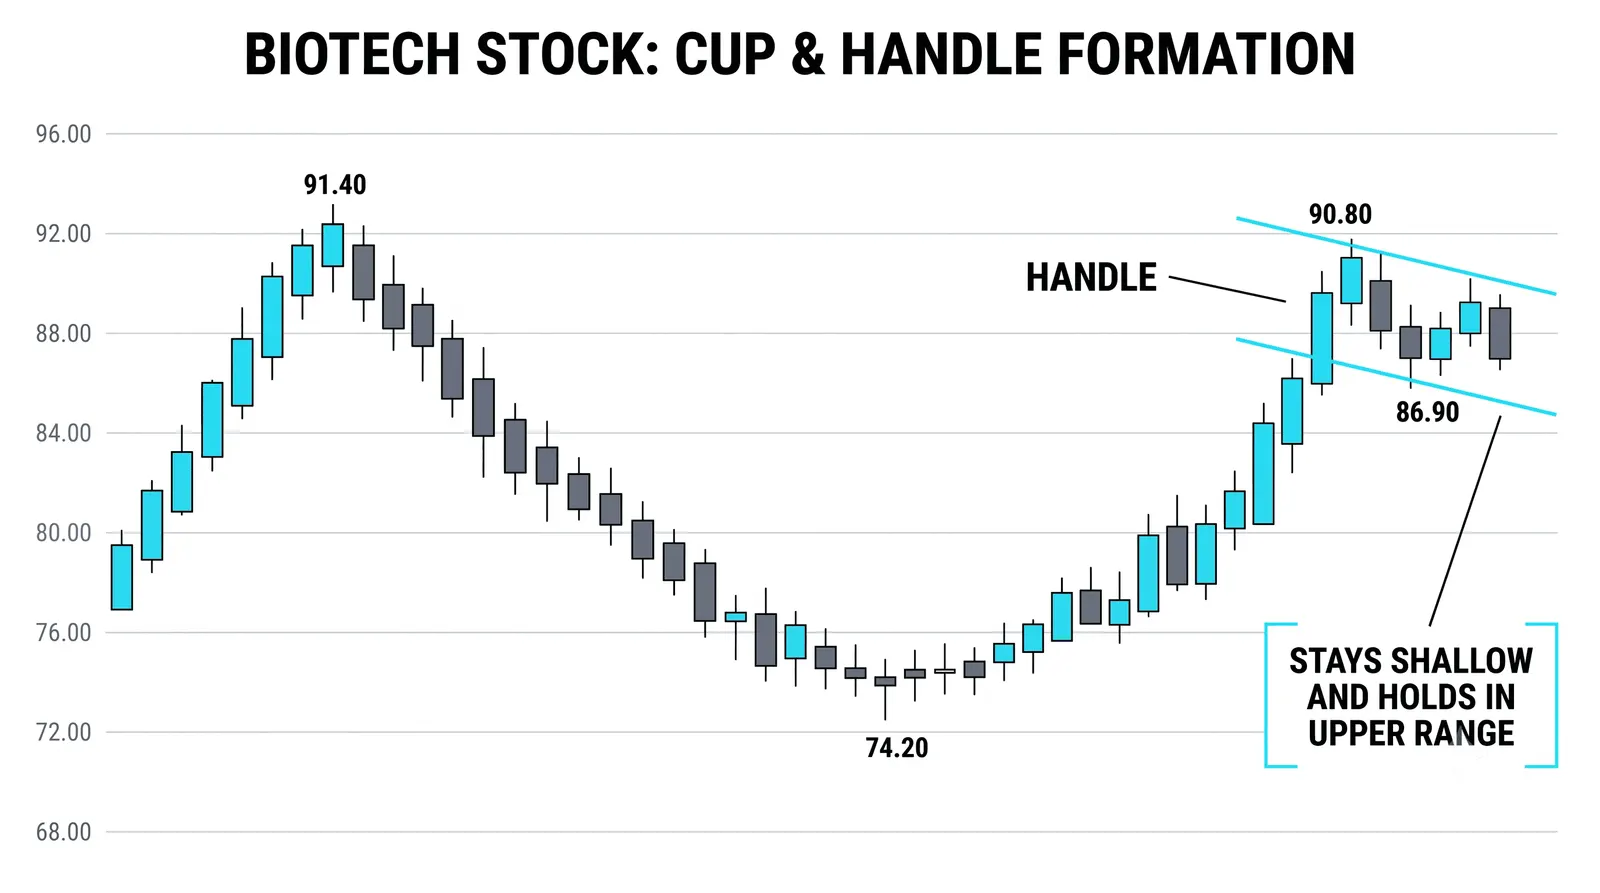
After price climbs back to the rim, it usually hesitates. That hesitation is the handle: a small drift lower or sideways, typically lasting one to two weeks on a daily chart.
The handle exists because of who is left holding the stock. Some buyers from the old highs finally get back to breakeven and sell with relief. Some recent buyers from the bottom take quick profits. That supply pushes price down a little. The handle is that supply being absorbed.
Depth is the tell. A healthy handle stays in the upper half of the cup. If the cup runs from 24 to 30, the handle should live above 27, and ideally shallower than that. A handle that sags into the lower half of the cup is a warning. It means sellers still have enough ammunition to drag price deep into the base, and the "recovery" story is weaker than the shape suggested.
A deep handle is not a trade. Skip it and wait for the chart to rebuild.
Also watch the handle's slope and volume. A gentle downward drift on shrinking volume is exactly what you want: nobody is panicking, sellers are just trickling out. A handle that drops hard on heavy volume is distribution, not a shakeout. Same label, opposite meaning.
The Breakout and Its Job
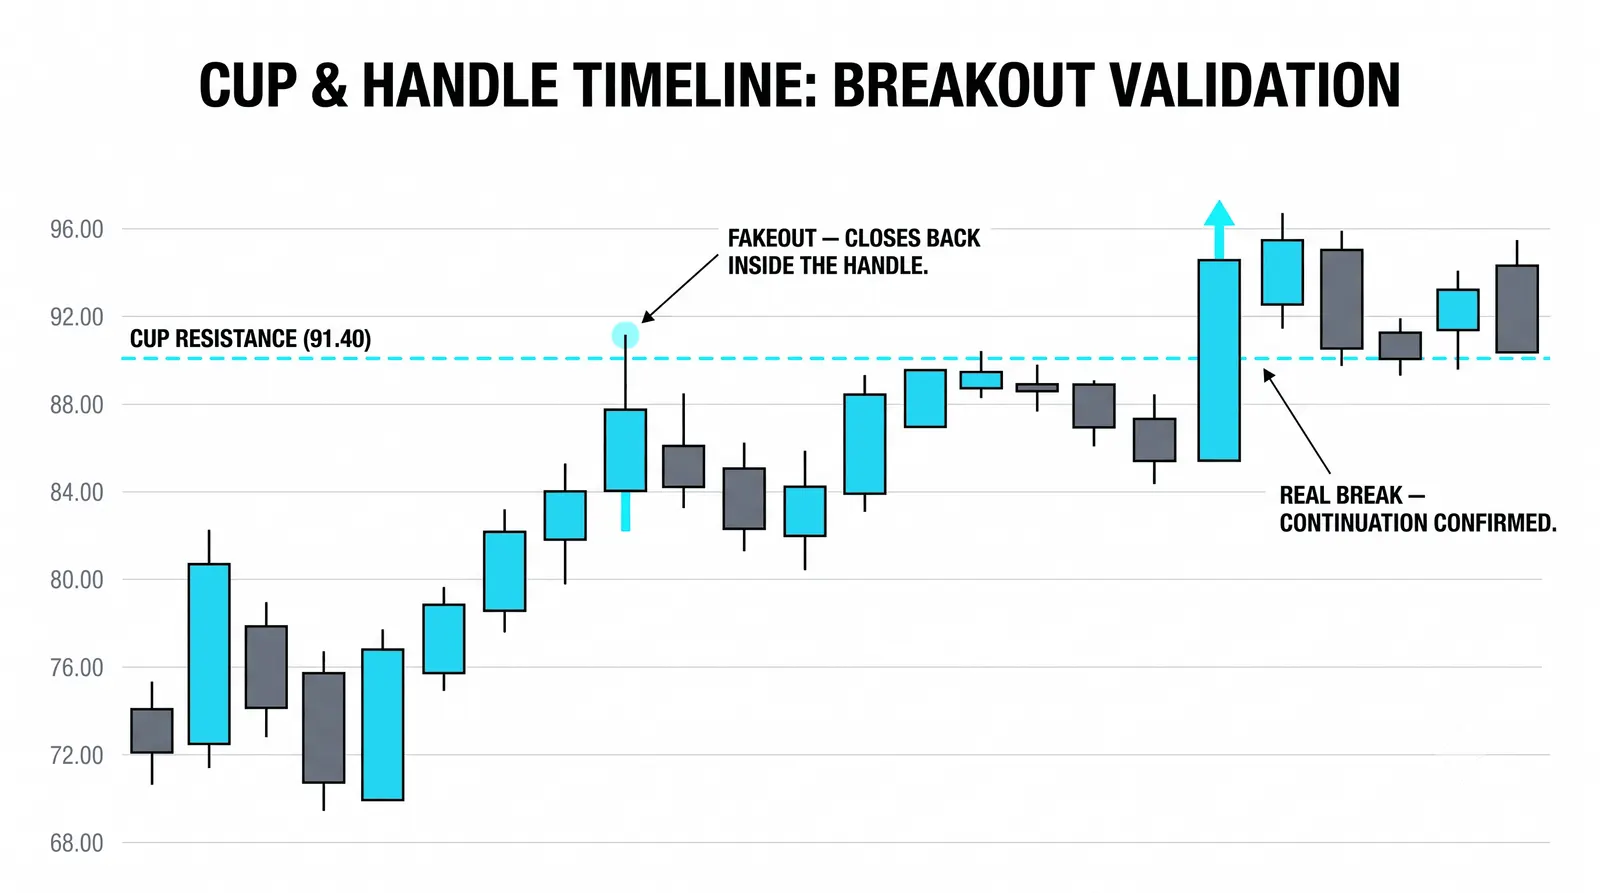
The confirmation is a close above the rim. Not an intraday poke. A close. Intraday spikes through resistance fail constantly, and the traders who bought them become the fuel for the reversal.
Once price closes above the rim, the pattern has done its job and the trade thesis is live, with the rim now expected to act as support. The standard way to frame a target is the measured move: take the cup's depth, from the bottom of the cup up to the rim, and project that same distance upward from the rim. Treat this number as a guide, not a promise. Markets do not owe you arithmetic. The measured move tells you whether the trade offers enough room to justify the risk, and it gives you a sensible zone to start managing profits.
Invalidation is just as important as the target. If price breaks out and then closes back below the handle, the idea is wrong. The shakeout failed, the buyers who pushed the breakout are trapped, and trapped buyers sell. Your exit belongs below the handle low, decided before you enter, not negotiated after.
One more honest point: breakout volume helps but is not mandatory. A breakout on expanding volume carries more conviction. A quiet breakout can still work, especially in a strong market, but it deserves a smaller position or a tighter leash.
The Quiet Base Is the Point
Practitioners who have traded this pattern for years will tell you something the textbooks skip: the drawn shape is the least important part. What pays is the behavior underneath it.
The cup and handle is a packaging of a simple story. A decline exhausts itself. Accumulation replaces distribution. Higher lows appear. The last weak holders exit at the rim. Then price leaves. If you can read that story in the raw structure, in the shrinking ranges and rising lows and drying volume, you do not need the shape to be pretty. You will spot the behavior in charts that never draw a textbook cup, and you will avoid pretty cups where the behavior is wrong.
This is why two traders can look at the same "perfect" cup and handle and reach opposite conclusions. One sees the outline. The other sees that the right side of the cup was built on three gap-ups on news, that volume never contracted at the bottom, and that the handle is sagging. Same outline, different market. Train yourself to read the base first and name the pattern second.
The Bowl and the Rim
Here is a hypothetical walkthrough with round numbers, so you can see every decision priced out.
A stock drifts down from 30 to 24 over two months. It rounds along the bottom for a few weeks, then climbs back to 30 over the next two months. The cup is complete: rim at 30, bottom at 24, depth of 6.
Now the handle forms. Over eight sessions, price drifts from 30 down to 28.50 and stalls. Check the depth: the cup's midpoint is 27, so 28.50 sits comfortably in the upper half. Volume shrinks during the drift. The handle passes.
Then price closes at 30.40, above the rim. That close is the trigger. The trade is now defined by three numbers:
- Entry: 30.40, on the confirmed close above the rim.
- Stop: 28.20, just under the handle low of 28.50. Risk per share is 2.20.
- Target: the cup depth of 6, projected from the rim of 30, gives 36. Potential reward is 5.60 per share.
Risk 2.20 to make 5.60. That is roughly a 2.5-to-1 reward-to-risk ratio, which is a workable trade on paper. If the measured target had come out at 32 instead, the same setup would offer less than one-to-one, and the right decision would be to pass even though the pattern looked identical.
Now the failure path. Suppose instead that after the breakout, price sags and closes at 28.10, back below the handle. The idea is dead. You exit at the stop, lose the 2.20 per share you agreed to risk, and the loss is boring. Boring losses are the goal. The traders who get hurt on this pattern are the ones who move the stop down "to give it room" and turn a planned 2.20 loss into an 8-point one.
Cup and Handle, Answered
How deep can the handle be?
The handle should stay in the upper half of the cup, measured from the rim down to the cup's low. Shallower is generally better, because a shallow handle means sellers have almost no power left. Once a handle drops past the cup's midpoint, treat the setup as compromised and either skip it or wait for the structure to rebuild.
Does the cup have to be perfectly round?
No. Real cups are lumpy, and a slightly uneven bottom with a couple of undercuts is normal. What you actually need is the behavior the roundness represents: fading selling pressure, a period of quiet, and a gradual return of buyers. A jagged base that shows that behavior is tradable. A smooth-looking arc built on two news spikes is not.
What if the breakout fails and price falls back in?
You exit at your predefined stop below the handle and take the small loss. Failed breakouts are common, and they are information: the market told you the supply at the rim was not fully absorbed. Some failed cups set up again weeks later with a second handle, and those can be traded fresh, but only as a new trade with new levels, never as a reason to hold the old losing one.
Does this pattern work on lower timeframes?
It appears on intraday charts, but reliability drops as the timeframe shrinks. The pattern's logic depends on a genuine transfer of ownership over weeks, and a fifteen-minute "cup" is mostly noise shaped like a bowl. If you trade it intraday, demand the same ingredients, volume contraction and a shallow handle, and cut your expectations accordingly.
Once you can read a base this way, the natural next step is learning how the same structure behaves across timeframes: a cup on the daily chart sitting inside a larger weekly base changes both the odds and the size of the trade you can justify. That layered read is where pattern vocabulary turns into actual structure analysis.