The Three Triangle Patterns
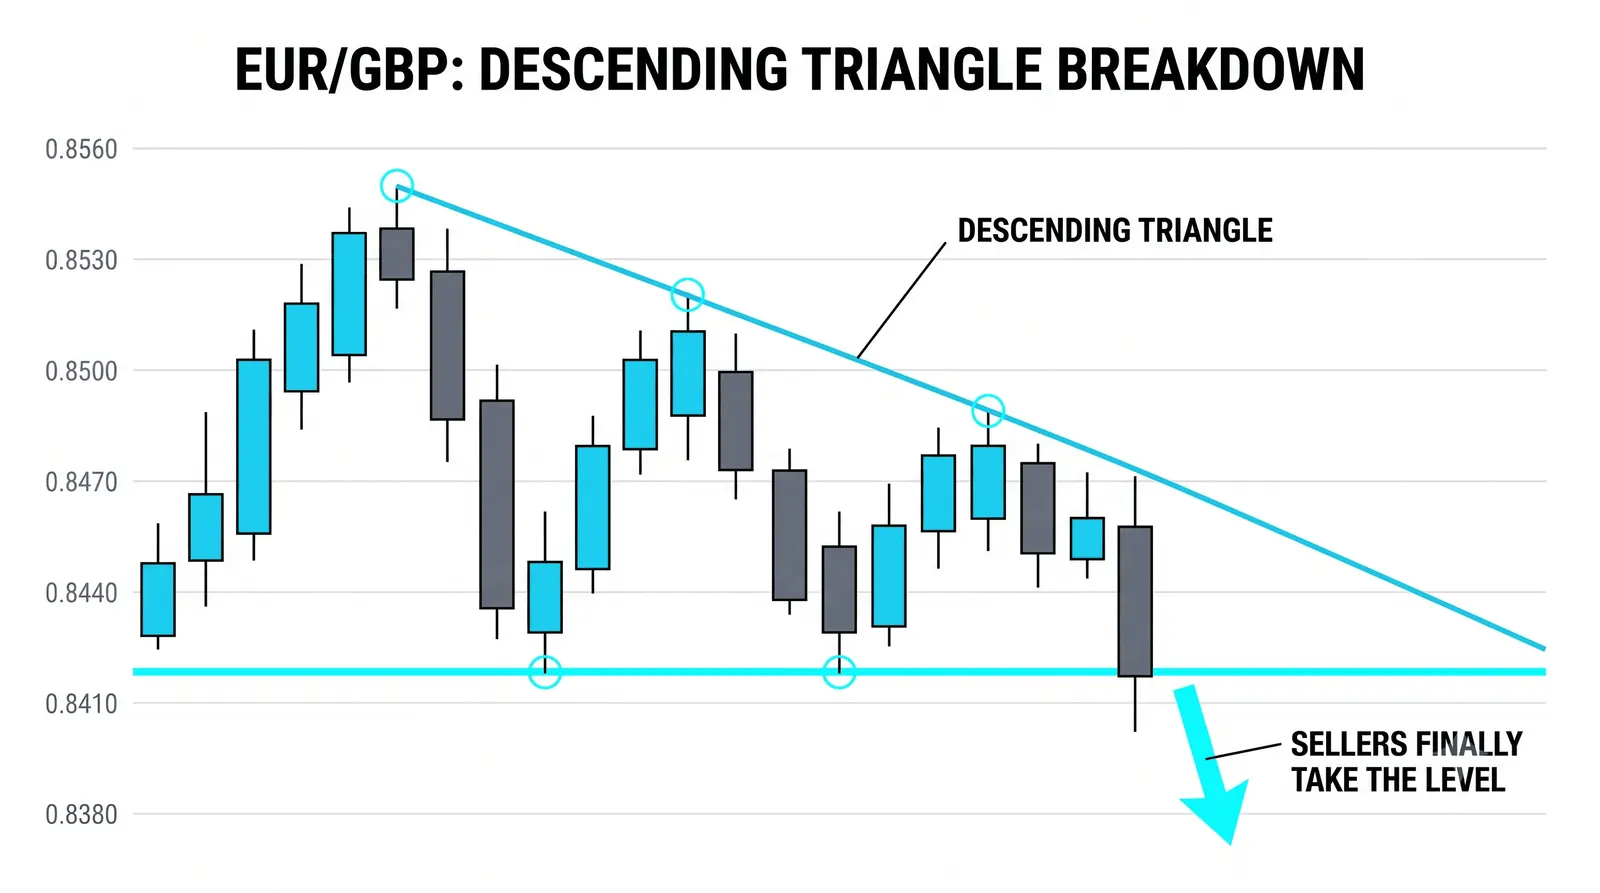
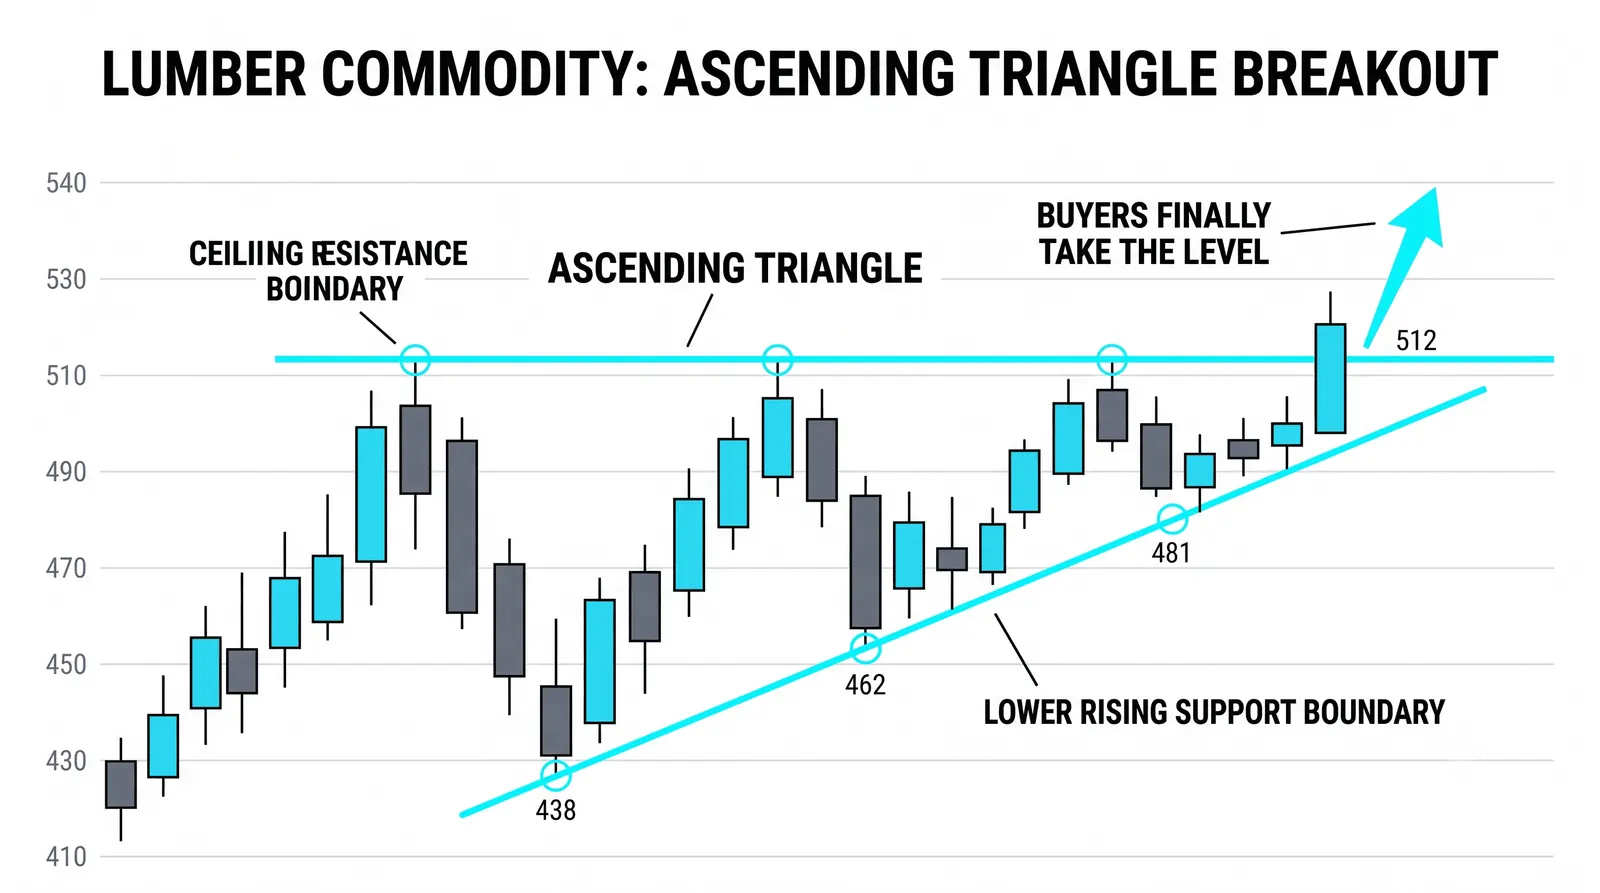
A symmetrical triangle is one of three classic triangle patterns, and all three share the same core idea: the range between highs and lows keeps narrowing until price has nowhere left to go. The symmetrical version has both sides converging. The ascending triangle has a flat top with rising lows. The descending triangle has a flat bottom with falling highs. Each one is pressure building, and the break usually tells you which side gave in.

Think of price moving through a funnel: it sloshes around near the wide end, but the exit comes near the narrow one.
What Convergence Actually Means
Convergence is simple to define. Each swing high prints lower than the last, each swing low prints higher than the last, or one side stays flat while the other side creeps toward it. The walls of the pattern close in.
The meaning underneath matters more than the shape. When ranges shrink, disagreement shrinks. Early in a move, buyers and sellers are far apart on what price is worth, so swings are wide. As the triangle forms, both sides accept tighter and tighter prices. The market is agreeing faster than it was before.
That agreement is temporary. Compressed disagreement stores energy, and when one side finally refuses to keep conceding, price leaves the pattern with force. Your job is not to predict which side wins. Your job is to recognize the compression and wait for the answer.
One contrast before moving on. A rectangle has parallel walls, a flat top and a flat bottom, and it is covered in its own lesson. Triangles have converging walls. If both walls are flat, you are not looking at a triangle at all.
The Symmetrical Triangle
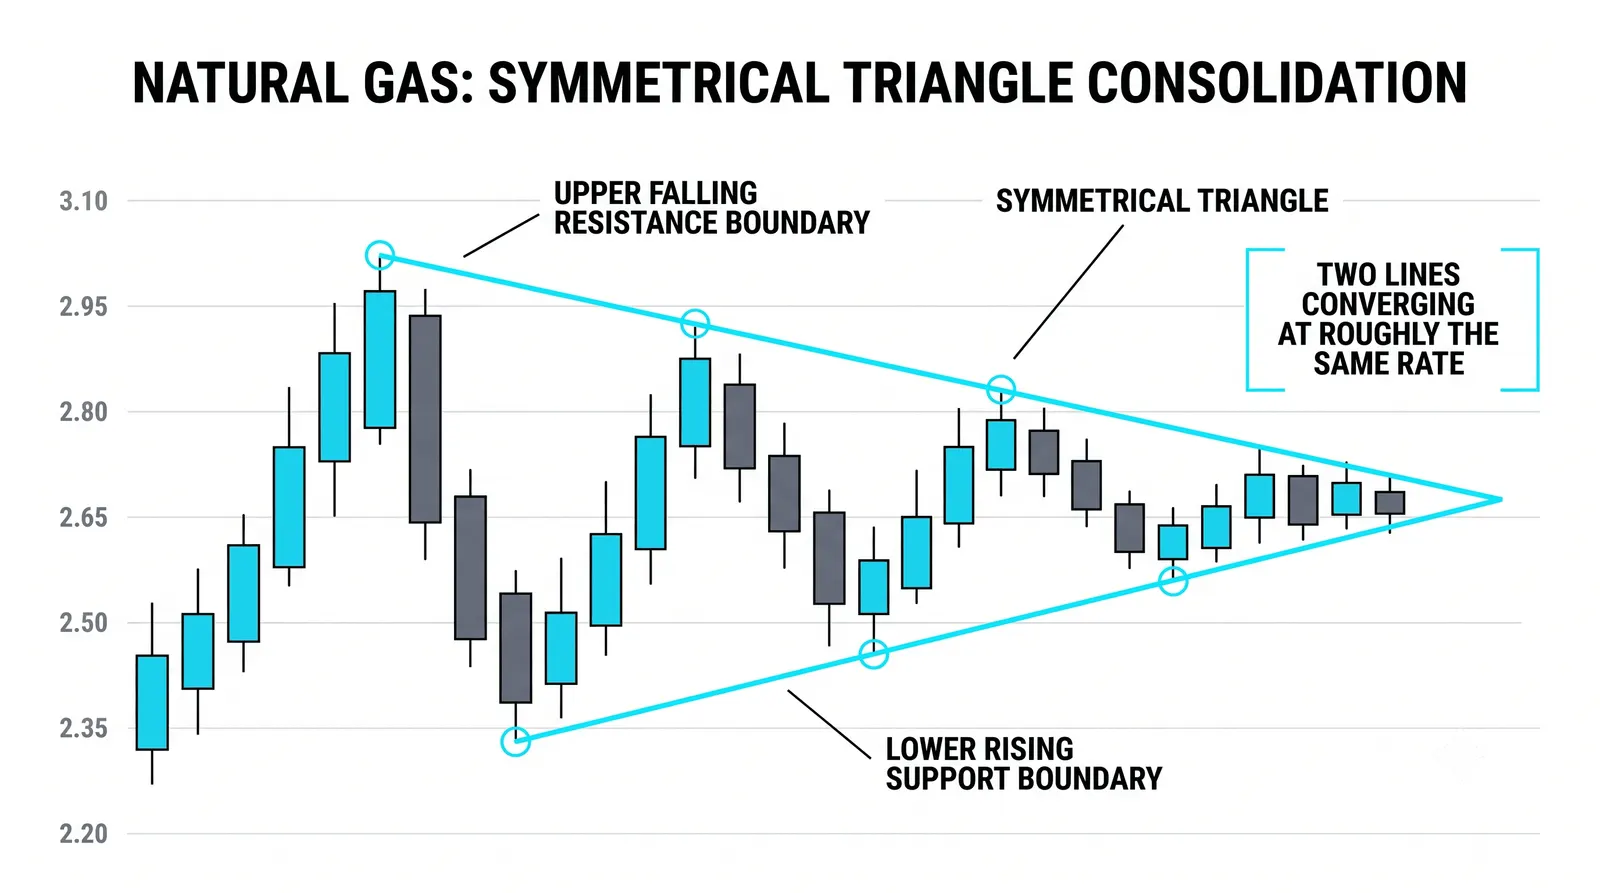
In a symmetrical triangle, the highs step down and the lows step up at roughly similar rates. Draw a line across the lower highs and another across the higher lows, and the two lines meet at a point called the apex.
This pattern is genuinely bilateral. Neither buyers nor sellers are clearly winning. Buyers are paying more each dip, but sellers are selling earlier each rally. The tape is balanced, and balanced patterns can break either way.
That is why the symmetrical triangle demands a trigger rather than a prediction. Guessing the direction in advance is a coin flip with extra steps. Wait for a close outside one of the trendlines, ideally with expanding range or volume, and let the market declare itself first.
Breaks that happen well before the apex tend to be more reliable. A pattern that drifts all the way into the apex often just fizzles, because the compression ran out of participants rather than resolving.
The Ascending Triangle
The ascending triangle flattens one wall. Resistance sits at a clear horizontal level, and sellers defend it repeatedly. Meanwhile, the lows keep rising.
Read the behavior. Buyers are willing to pay more on every pullback, while sellers refuse to budge from the same ceiling. Each dip gets bought higher, which means demand is creeping closer to supply. Pressure points up.
The flat top also creates a visible pool of orders. Stops from shorts and breakout entries from buyers sit just above that ceiling, so a clean break through it can move quickly.
None of this makes an upside break guaranteed. Ascending triangles fail, and when they do, the failure itself is information. But the structure leans upward, and that lean is what you are trading.
The Descending Triangle
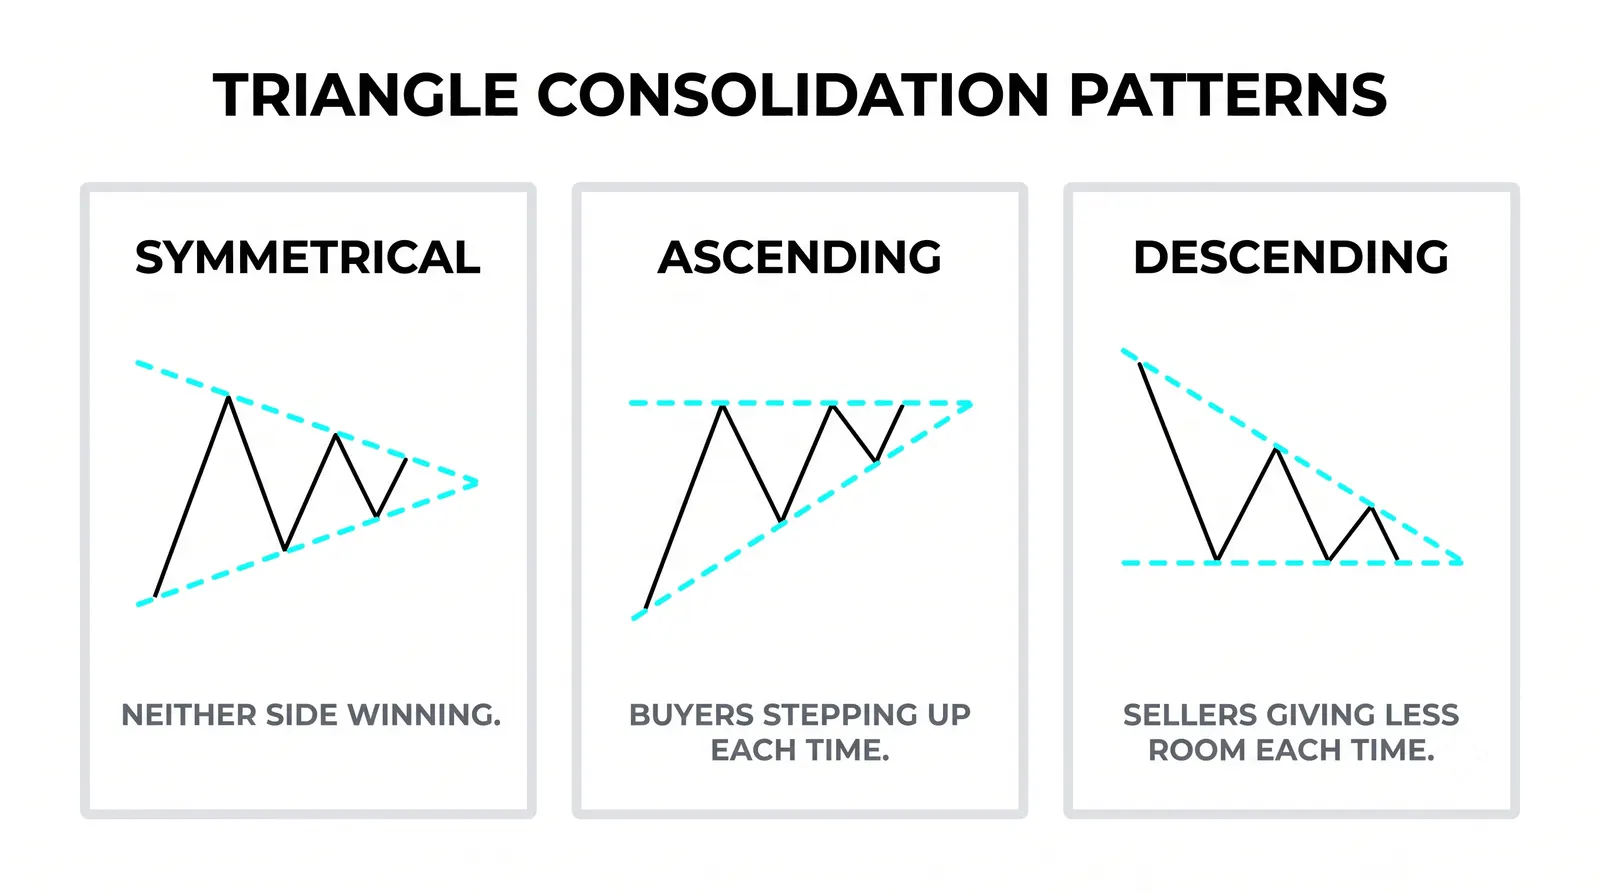
The descending triangle is the mirror image. Support holds at a flat level, and buyers defend the same floor again and again. The highs, though, keep falling.
Sellers are accepting less on every rally while buyers only show up at one price. Supply is pressing down on a fixed shelf of demand. Pressure points down.
A floor that gets tested repeatedly with weakening bounces is a floor under stress. Each tap consumes some of the buy orders sitting there. When those orders are finally absorbed, the break can be sharp, because there is nothing left underneath until the next real demand zone.
Same caution applies in reverse. Descending triangles can and do break upward, especially when the broader trend disagrees with the pattern. The bias is a lean, not a law.
The Narrowing Range Over 45
Here is a hypothetical worked example with round numbers, so the mechanics stay visible.
Suppose a stock prints swing highs at 45, then 44, then 43. Over the same stretch, the swing lows rise from 40 to 41.50 to 43. Both walls are converging, so this is a symmetrical triangle, tightening toward the 43 area.
Price then closes at 43.50, above the last lower high at 43 and above the descending trendline. That close is the trigger. The widest part of the triangle was the first swing, 45 minus 40, which is 5 points. The classic measured move adds that width to the breakout point: 43.50 plus 5 gives a rough target of 48.50.
Now the ascending case in one line: if the top had been flat at 45 with lows rising through 43, a close above 45 would project the same 5-point width upward, targeting about 50.
Treat the measured move as a planning tool, not a promise. It gives you a sensible place to take partial profits and a way to check whether the reward justifies the risk. If your stop sits below the last higher low at 43 and the target is 48.50, the trade offers roughly five points of potential against half a point to a point of risk. That arithmetic is the real reason traders like these patterns.
Plenty of breakouts never reach the measured target. Some exceed it. The number organizes your thinking; it does not obligate the market.
The Three Triangles Side by Side
| Pattern | What Converges | Pressure Reading | Natural Bias |
|---|---|---|---|
| Symmetrical | Lower highs and higher lows, both walls sloping toward each other | Balanced; neither side is winning, disagreement is shrinking | Neutral; needs a confirmed break in either direction |
| Ascending | Flat resistance with rising lows | Buyers paying more for the same ceiling; demand pressing up into supply | Bullish lean; upside break expected but not guaranteed |
| Descending | Flat support with falling highs | Sellers accepting less for the same floor; supply pressing down on demand | Bearish lean; downside break expected but not guaranteed |
Notice what the table does not say. It never says "will break." Every triangle carries a lean at most, and the symmetrical carries none at all. The pattern frames the trade; the confirmed break executes it.
Questions About Triangle Patterns
Does a triangle always break out before the apex?
No, and a break near the apex is often weaker. The most reliable breaks tend to occur somewhere between roughly two-thirds and three-quarters of the way into the pattern. When price drifts all the way into the point, the compression frequently dissolves into sideways noise instead of resolving with force. A triangle that reaches its apex without breaking has usually told you the participants lost interest, which is a reason to stand down rather than a reason to keep waiting.
What if the break is a wick and not a close?
A wick through the trendline is not a confirmed break. Wicks probe; closes commit. Intraday pokes beyond the line happen constantly, often triggered by stop runs, and price snaps back inside the pattern. Require a close beyond the trendline on your trading timeframe before acting, and accept that this discipline means you will never enter at the exact extreme. That trade-off is worth it.
Can an ascending triangle break down?
Yes, and it happens often enough that you must plan for it. The flat top and rising lows create an upward lean, but if the broader trend is down or the ceiling holds one time too many, price can fall out through the rising trendline instead. When an ascending triangle fails downward, the move can be fast, because trapped breakout buyers become forced sellers. The bias guides your preparation; the actual break dictates your position.
How do I measure the target?
Measure the widest part of the triangle, which is usually the first swing, and project that distance from the breakout point. In the worked example above, the first swing ran from 40 to 45, a width of 5 points, so a break at 43.50 projected to 48.50. For a downside break, subtract the width instead. Use the result as a reference zone for taking profits, not as a certainty, and always compare it against nearby support or resistance that might interrupt the move first.
Once you can read converging walls on sight, the next skill is judging the quality of the break itself: closes versus wicks, volume behavior, and what a failed breakout tells you. That is where triangle reading turns into trade management, and it is where the next lessons pick up.