Double Tops and Triple Tops Explained
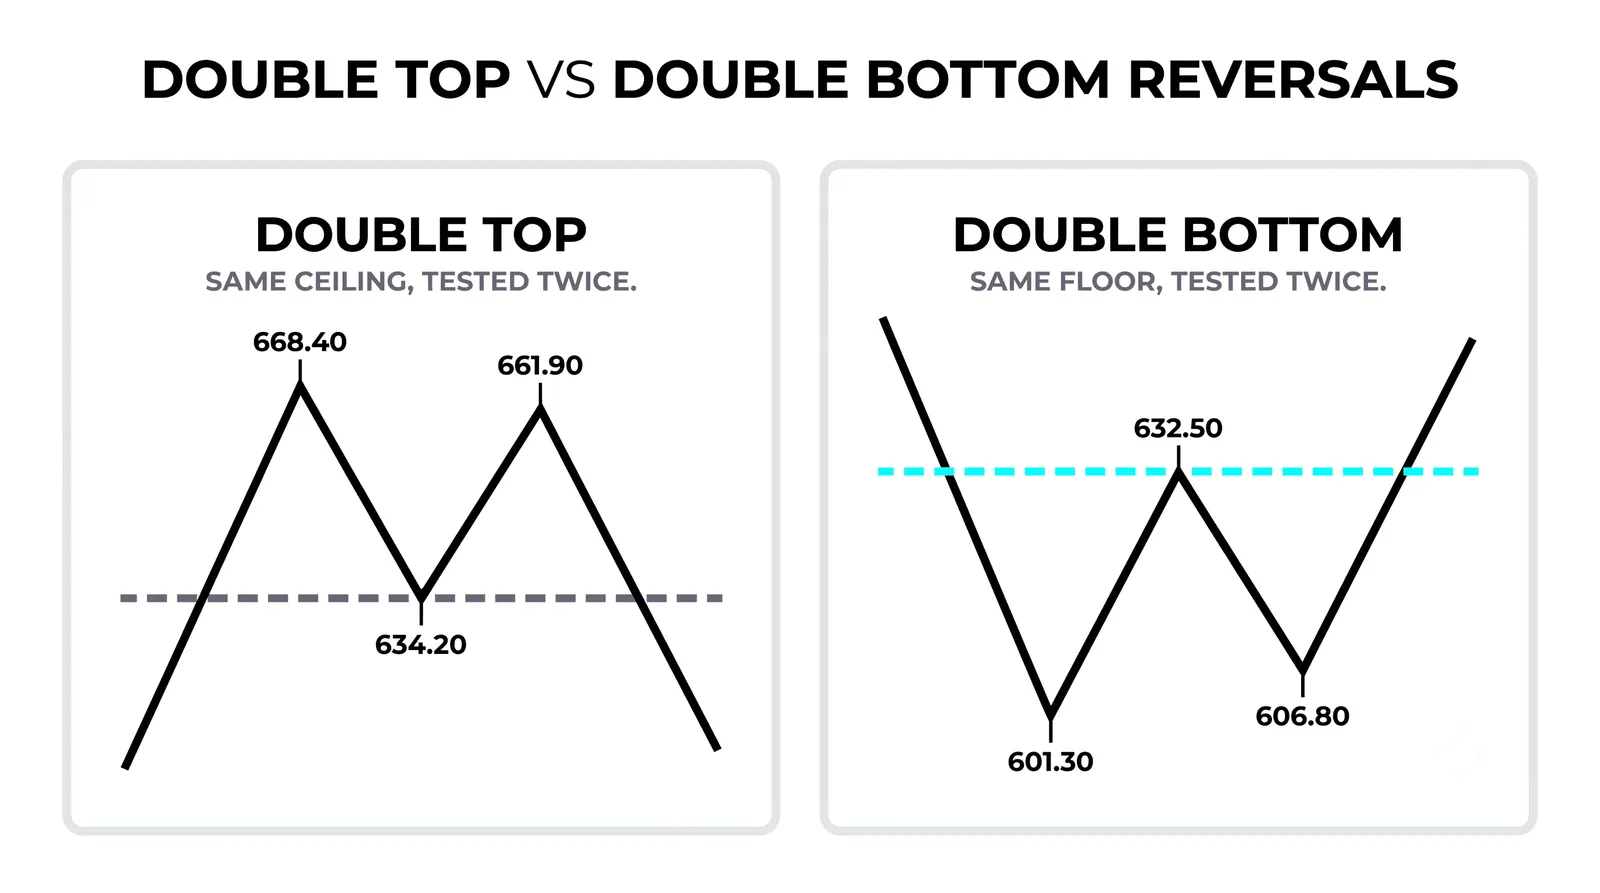
A double top is two failed attempts at the same ceiling separated by a pullback, and it only becomes a real pattern when price closes below the valley between those two attempts. The double bottom is the same structure mirrored at a floor. Everything else in this lesson hangs off that one definition.

Think of it like standing up under the same low beam twice: the second knock convinces everyone to duck. Price hits a level, gets rejected, tries again, gets rejected again, and the crowd stops paying for another attempt.
The Anatomy of a Double Top
The pattern has four pieces, and each one carries information.
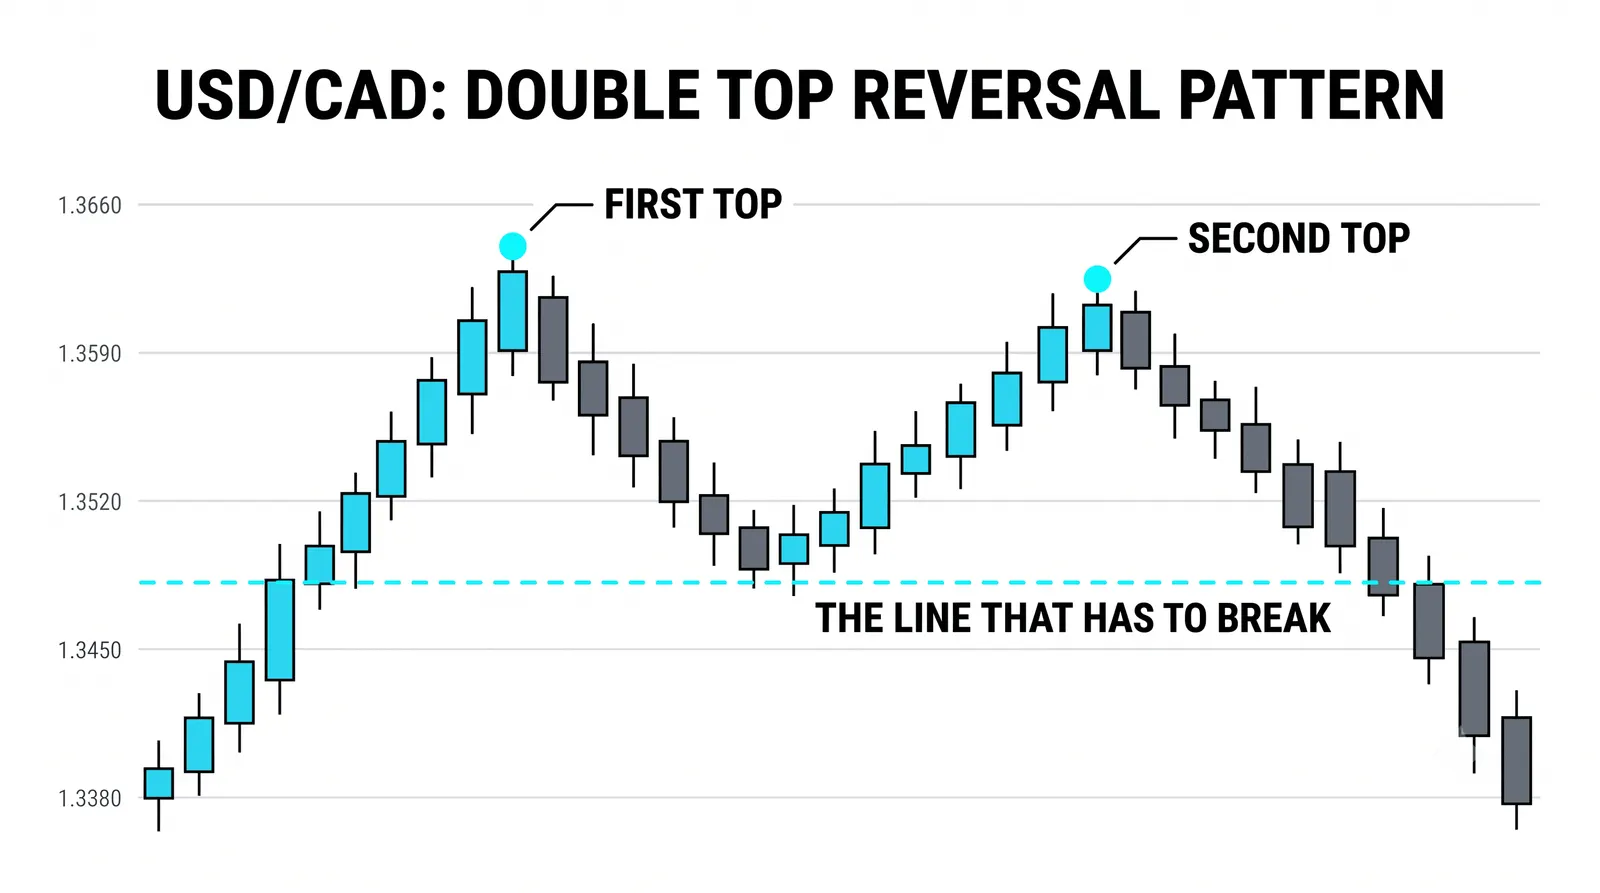
The first peak marks supply. Price rallied into that level and sellers showed up in enough size to stop the move. That alone tells you nothing unusual. Every rally ends somewhere.
The valley marks the last buyers still willing to pay. After the rejection, price pulls back and finds support. Buyers step in, confident the uptrend is intact. This low becomes the most important price on the chart, though nobody knows it yet.
The second peak proves the supply is still there. Price rallies back to roughly the same level and fails again. The sellers at that ceiling were not a one-time event. They defended it twice.
The neckline break is the trigger. When price falls through the valley low and closes below it, the last group of buyers is now trapped underwater. Their exits add fuel to the decline.
Why Two Failures Change the Picture
One rejection at a level is normal. Two rejections at the same level is information.
The second attempt consumes the late buyers. Everyone who missed the first rally, everyone who bought the pullback expecting new highs, gets used up in a push that goes nowhere. That is exhaustion at that price, not bad luck.
After the second failure, the pool of remaining buyers at that level is thin. The sellers, meanwhile, have now seen the level hold twice and grow more confident. The balance of the auction has shifted, and the chart is showing you the shift in plain sight.
This is why the pattern belongs in a structure-reading toolkit. You are not memorizing a shape. You are reading who is trapped, who is confident, and who has run out of ammunition.
The Confirmation Rule
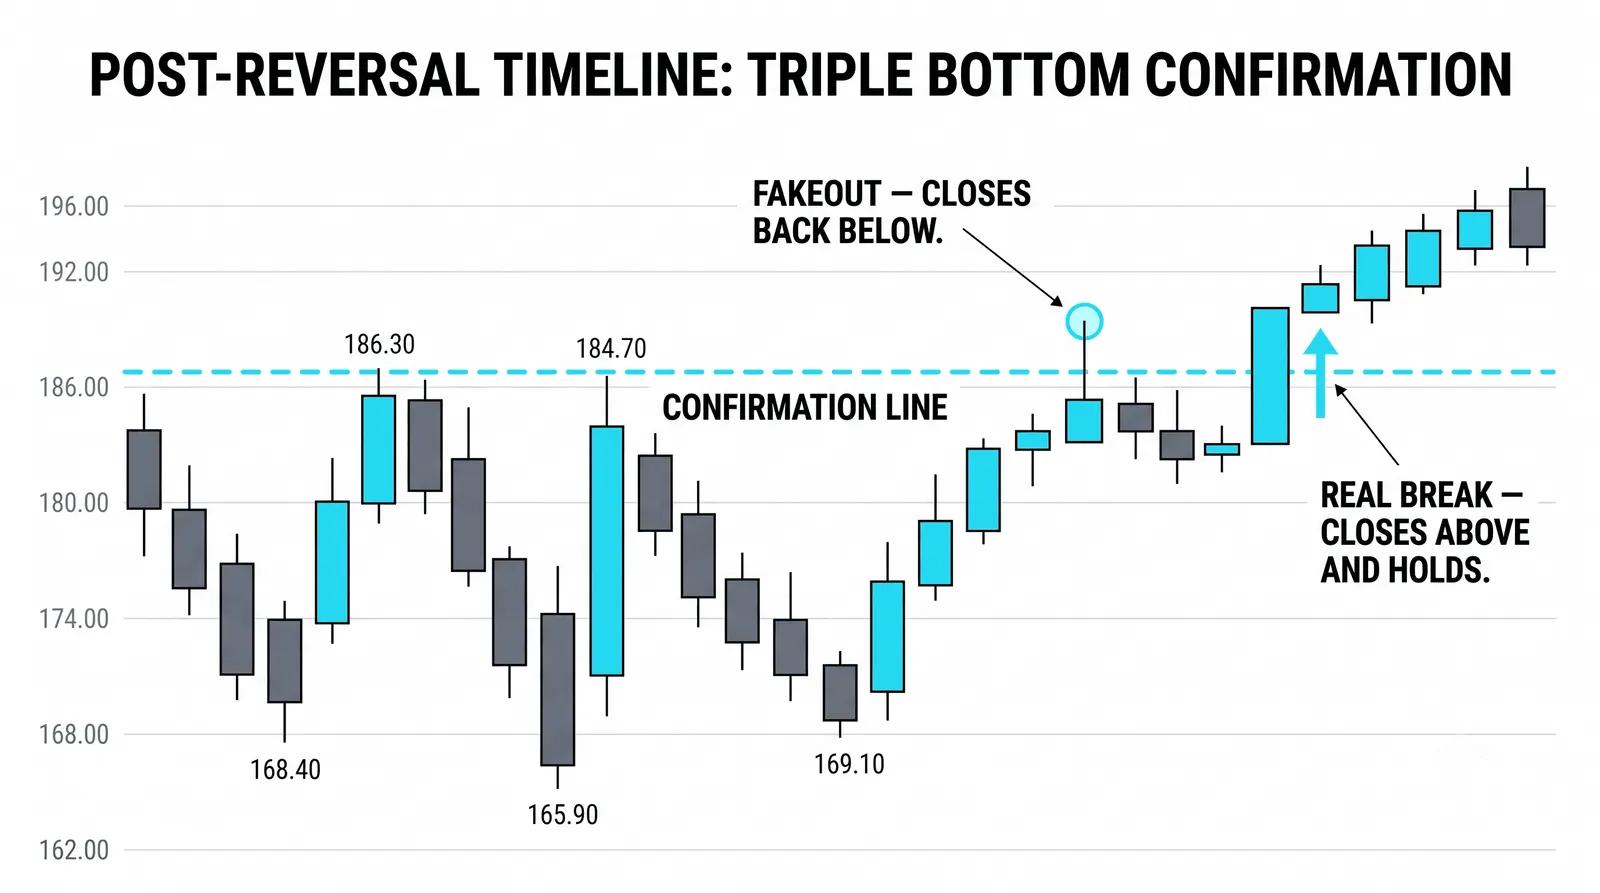
A double top without the neckline break is just two swings on a chart. The break is what turns a shape into a pattern.
Plenty of two-peak formations never complete. Price tags the same high twice, dips, then rips through to new highs and leaves everyone who shorted early holding a losing position. The shape alone is not a signal.
Confirmation is a close below the valley low. Not a wick through it. A close. Wicks probe; closes commit.
The break also tends to produce a level flip. The old valley support, once broken, often acts as resistance on the first retest. Former buyers become sellers trying to exit at breakeven. That retest is where many patient traders look for entry, rather than chasing the initial breakdown.
Patience here costs you some points on the trades that work. It saves you far more on the ones that do not.
Triple Tops and Bottoms
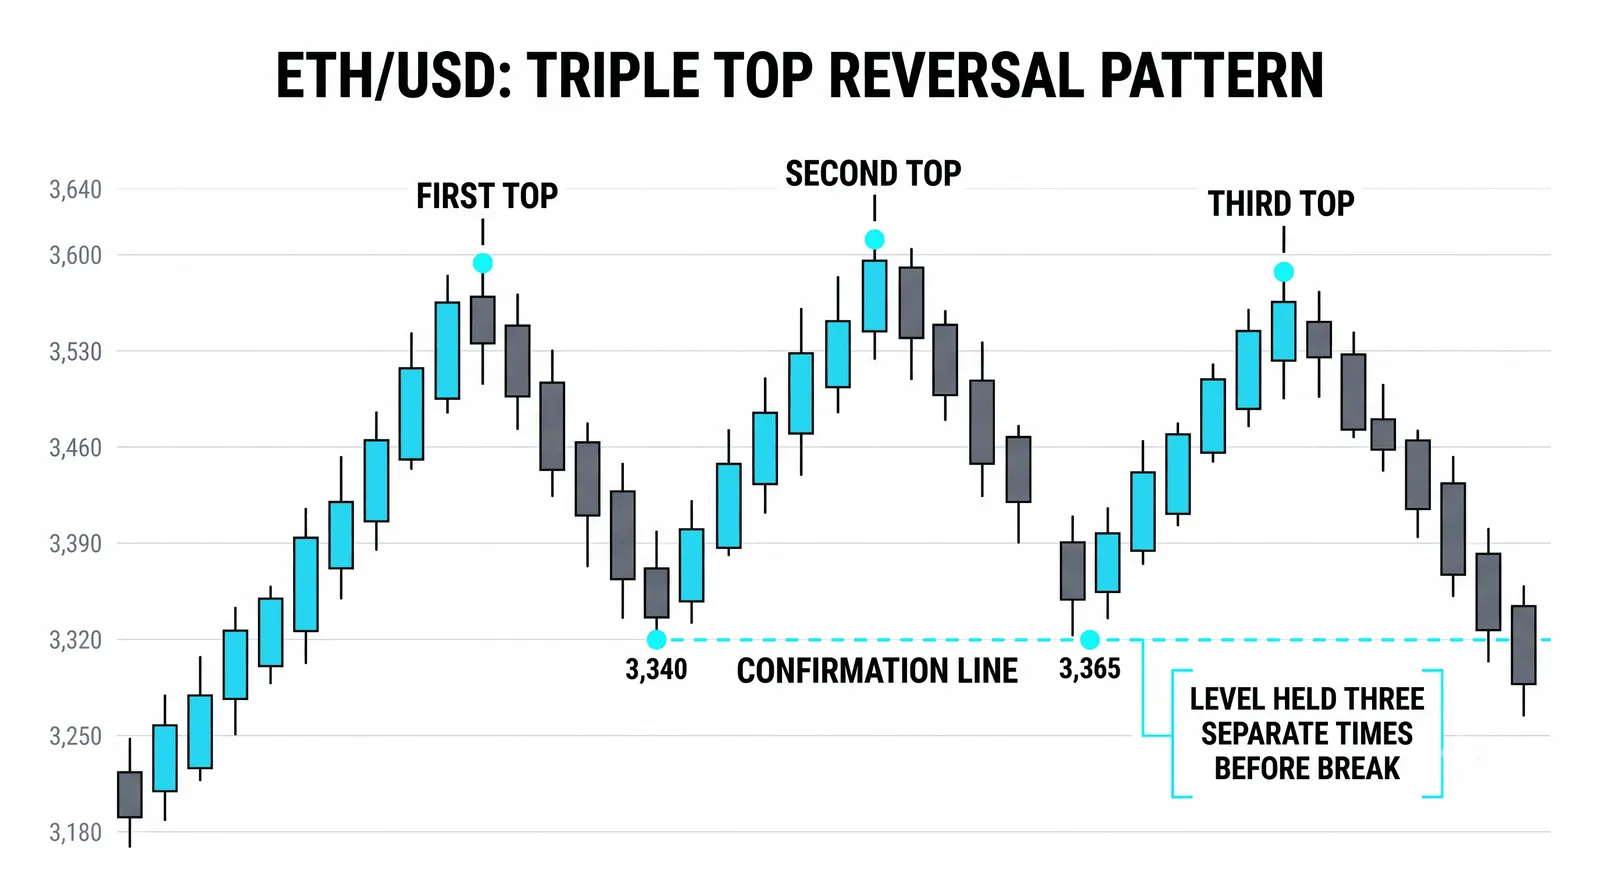
Add one more attempt and you get the triple top: three failures at the same ceiling, with the same neckline logic underneath. The triple bottom mirrors it at a floor.
These are rarer, and when they finally break, the move is often heavier. The reason is mechanical. Each test of a level spends orders. Buyers who would have defended the valley get used up across three attempts instead of two. By the third failure, the level has absorbed more buying and there is less left to catch the fall.
Each test weakens a level. That idea runs through all of structure reading, and the triple top is its clearest expression. Three touches means three rounds of trapped or exhausted participants, all leaning the same way when the break finally comes.
Do not go hunting for triple tops on every chart. They are uncommon. When one does appear with clean, well-separated peaks, treat it with more respect than a double, not less.
Two Tops, One Ceiling
Here is a hypothetical worked example with round numbers, so the mechanics are easy to follow.
A stock rallies and peaks at 52. Sellers step in. That is the first peak, and it marks supply.
Price pulls back to 46, where buyers defend. That is the valley, and 46 is now the neckline.
Price rallies again and reaches 52.2, a hair above the first peak, then stalls and rolls over. That is the second peak. The supply at 52 held. Note that the second peak does not need to match the first exactly. 52.2 counts.
Price then falls and closes at 45.5, below the 46 neckline. The pattern is confirmed. The buyers who purchased between 46 and 52 are now underwater.
The pattern height is 6 points: 52 minus 46. The rough measured target projects that height down from the neckline: 46 minus 6 gives 40.
Measured targets are guides, not promises. Price may blow through 40, stall at 42, or reverse at 44 and never get there. Use the target as a reference for whether the trade offers reasonable reward for the risk, not as a destination you count on.
The Connection to Structure
The double top matters because it is a specific, named way for a downtrend to begin.
A downtrend is a sequence of lower highs and lower lows. The double top manufactures the first two pieces of that sequence. The second peak, at or below the first, is the lower high. The close below the valley is the first lower low.
So when you spot a completed double top, you are not just seeing a pattern. You are watching the opening move of a potential trend change, with defined levels already drawn for you. The second peak marks invalidation. The neckline marks the line the new downtrend must hold below.
This is also why multi-timeframe thinking sharpens the pattern. A double top on the hourly chart that forms at a major daily resistance level carries more weight than one forming in the middle of nowhere. Context decides which patterns deserve your capital.
Double Top vs Triple Top
| Double Top | Triple Top | |
|---|---|---|
| Touches of the ceiling | Two peaks at roughly the same level | Three peaks at roughly the same level |
| What it signals | Supply defended twice; late buyers exhausted | Supply defended three times; more orders spent at the level |
| Confirmation | Close below the valley (neckline) | Close below the lowest valley between the peaks |
| How rare | Common on most timeframes | Uncommon; often heavier when it breaks |
Common Questions About Double Tops
Must the two peaks be exactly equal?
No. The second peak can sit slightly above or below the first and the pattern still counts. A second peak that pokes marginally higher, like 52.2 against 52, can even be a stronger signal, because it swept the obvious stops and still failed. What you are checking is whether the same supply zone rejected price twice, not whether two wicks match to the tick.
What counts as the neckline?
The neckline is the low of the pullback between the two peaks. In a clean double top there is one valley, so there is one neckline. In messier versions with a choppy middle, use the lowest meaningful low between the peaks. That is the level whose break traps the most buyers.
Can a double top fail and turn into continuation?
Yes, and it happens regularly. If price forms two peaks but then closes above the second peak instead of breaking the neckline, the pattern is dead and the level has been absorbed. Failed patterns often fuel strong moves in the opposite direction, because everyone who positioned for the breakdown has to exit. Respect the invalidation level and a failed pattern costs you little.
Do I have to wait for full confirmation?
Waiting for the neckline close is the standard rule, and for newer traders it is the right one. Some experienced traders position earlier near the second peak with a tight stop above it, accepting a lower win rate for a better price. That trade-off only makes sense once you have tracked enough of these to know your own numbers. Until then, let the pattern complete.
Next, take this same lens to the mirror image: double and triple bottoms at support, where the trapped party is the shorts and the neckline break points up. The logic transfers completely, and recognizing both sides of it is what turns pattern vocabulary into actual chart reading.