Breakout Confirmation Using Volume
Confirmation is what separates a real breakout from a feint, and volume delivers it in two parts. First, expansion on the break itself, clearly above the recent average. Second, acceptance beyond the level, price holding and building on the far side instead of snapping back. A break without the volume is a claim without evidence.

The previous lesson framed every signal as either validated or anomalous. This lesson applies that frame to the single most attacked setup in trading, the breakout. Think of a snowball rolled downhill: a real breakout gathers size as it travels, and the lump that never grows was never going to be an avalanche. Price can cross any line on the chart. Only participation tells you whether the cross means anything.
Volume Before, During, and After
A genuine break has three volume phases, and each one says something different about who is in the market.
Before the break, volume typically dries up as price coils under the level. Sellers who wanted out have sold. Buyers are waiting. The quiet tape is not weakness; it is the absence of urgent opposition. A range that tightens on shrinking volume is a range storing energy.
During the break, the bar prints volume well above average, often the heaviest bar in days. Two groups act at once. Traders trapped on the wrong side exit, and new entrants pile in. The expansion has a mechanical cause too: resting stop orders trigger into market orders, and short-sellers buy back to cover. The order flow framework describes these stop cascades, and they explain why a real break feeds on itself in the first minutes.
After the break comes acceptance. Pullbacks to the broken level hold on shrinking volume, because sellers at the old ceiling no longer have conviction. Further pushes come on renewed expansion, because new buyers keep arriving. Volume price analysis is built largely on exactly this rhythm: effort, result, then confirmation in the follow-through.
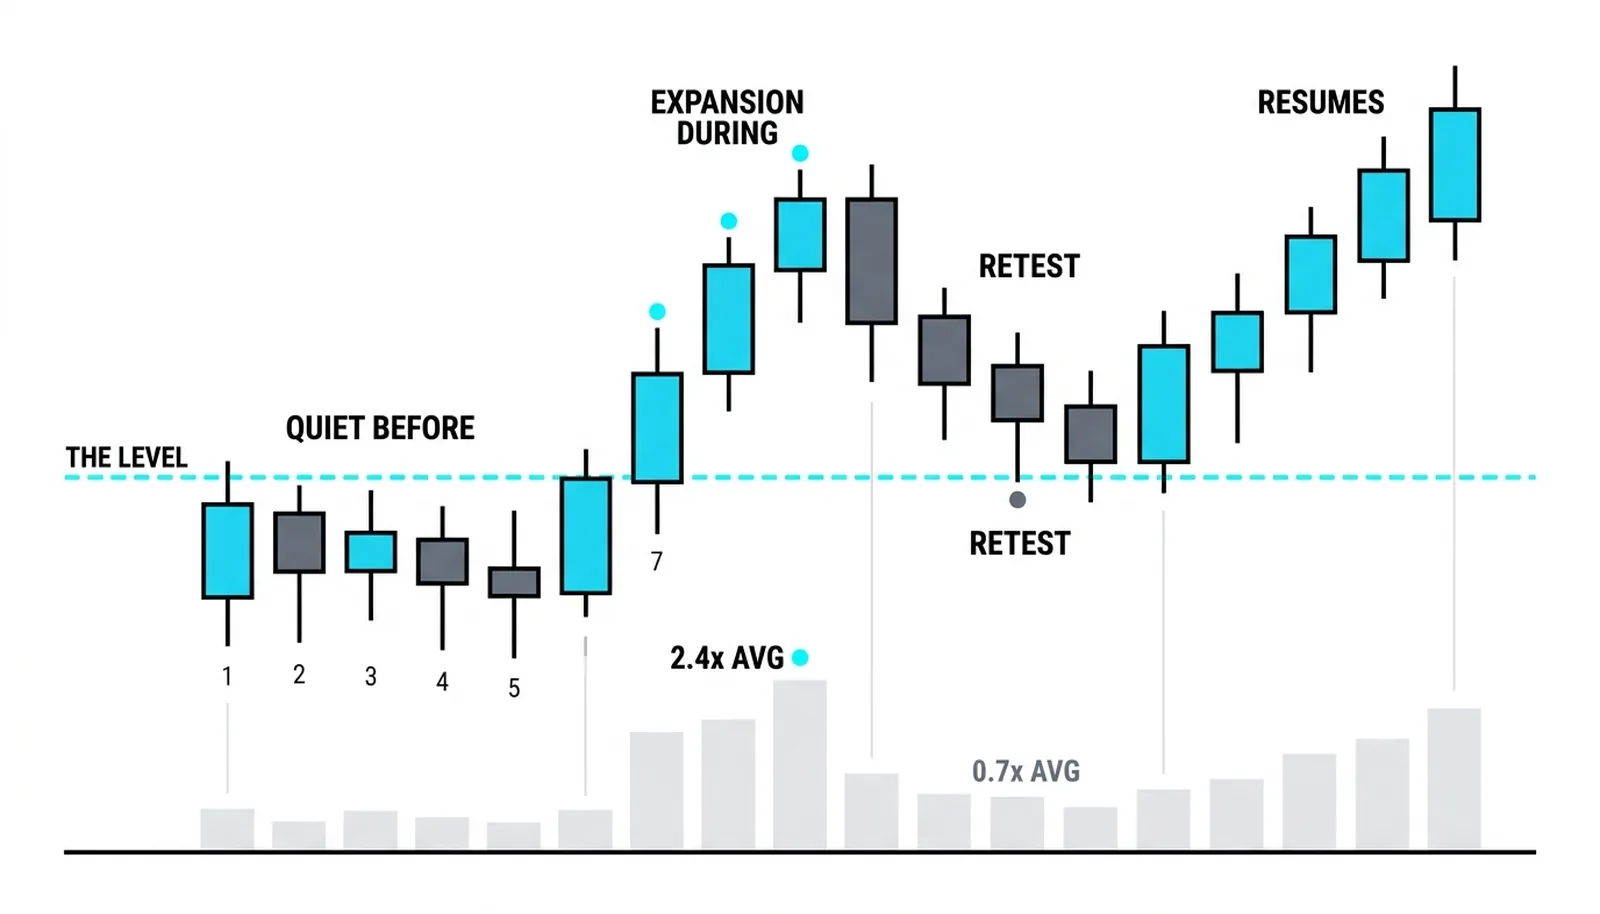
- Quiet before: volume dries up as price coils under the level.
- Expansion during: the break bar runs well above average, often the heaviest in days.
- Acceptance after: retests hold on dry volume, pushes come on fresh expansion.
What a Failed Break Prints
The failed version looks different at every phase. The break prints on average or below-average volume, which usually means nobody with size believed it. Price pokes through the level, finds no follow-through, and closes back inside the range the same session or the next.
The snap-back is the tell. A level that took days to build does not give way quietly and then hold. When the break bar is thin and the next bars drift back under the line, the market has answered: the move was an anomaly, not a validation. Trapped breakout buyers become the fuel for the return trip, because their exits push price back into the range faster than it left.
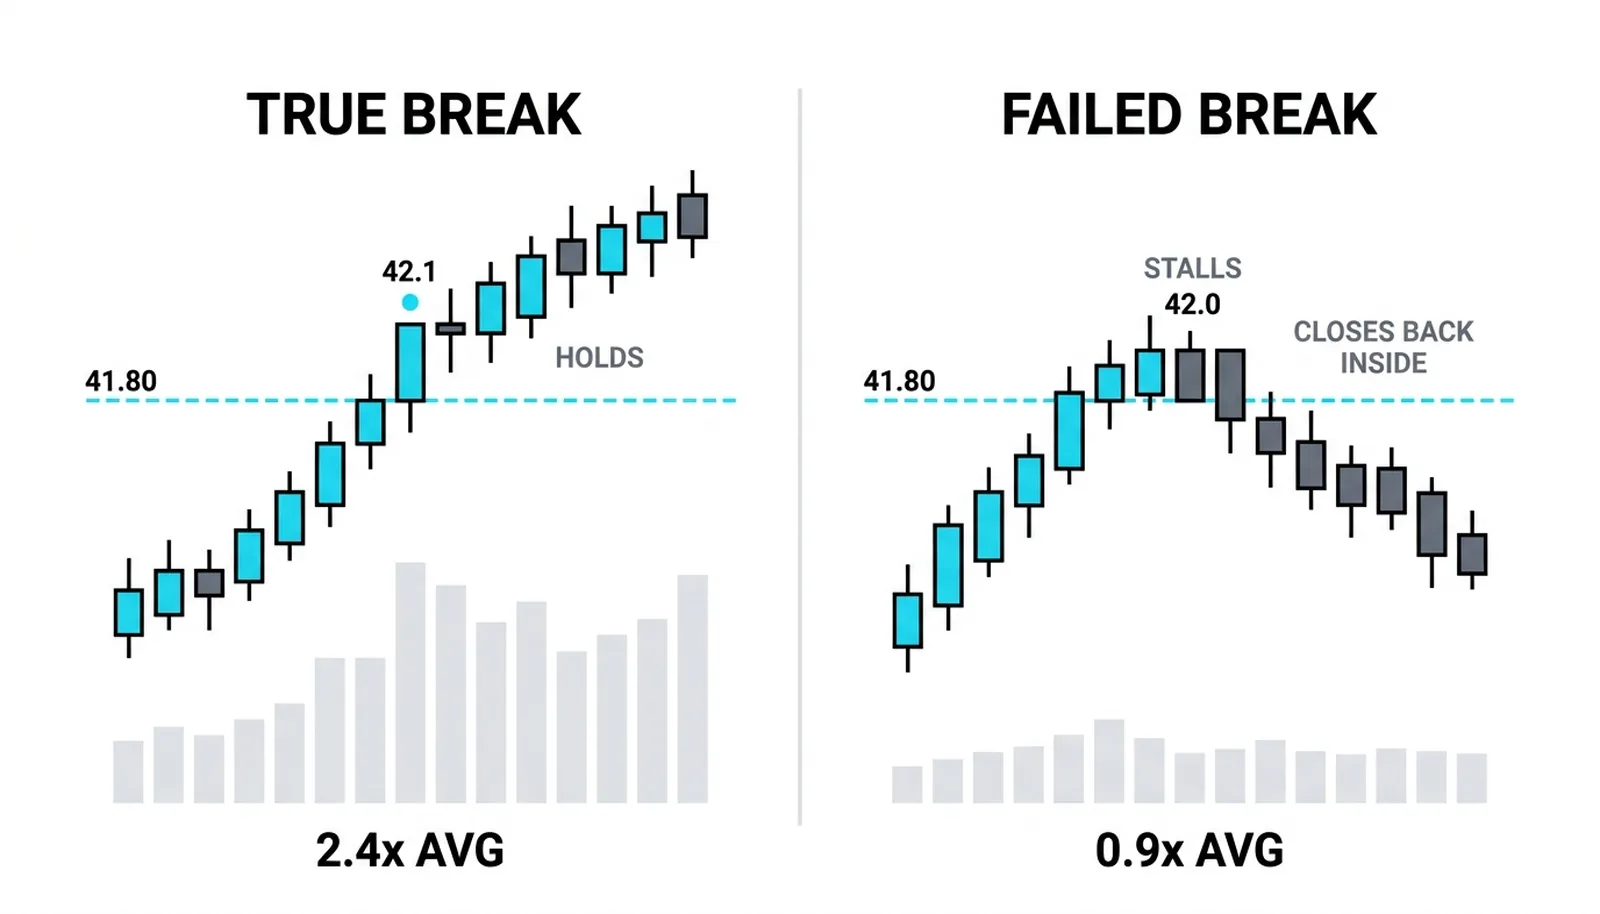
One caution matters here. A low-volume break is not automatically a short signal. Some of the cleanest breaks start quietly and expand on the first pullback, when larger participants step in at the retest. Weak volume is a reason to wait, not to fade. The fade only earns its place when price closes back inside the range.
Acceptance Beats the Break Candle
Expansion on the break bar alone is not permission to chase. The heaviest bar of a move is often the exhaustion bar, the moment the last buyer buys. When you chase that bar, you are frequently buying the exact print where the move runs out of fuel.
Acceptance carries more weight than the break candle itself. Acceptance is what happens after: price holds above the broken level, the retest arrives on shrinking volume, and the next push builds on the far side. A level that was resistance and now acts as support on dry volume is the market telling you the transfer of ownership completed.
This is why patient traders often get better prices than chasers. The retest on dry volume offers entry near the level with a clear line of invalidation just beneath it. The chase offers entry at the top of the excitement with no structure to lean on. Same breakout, very different trades.
The Break at 41.80
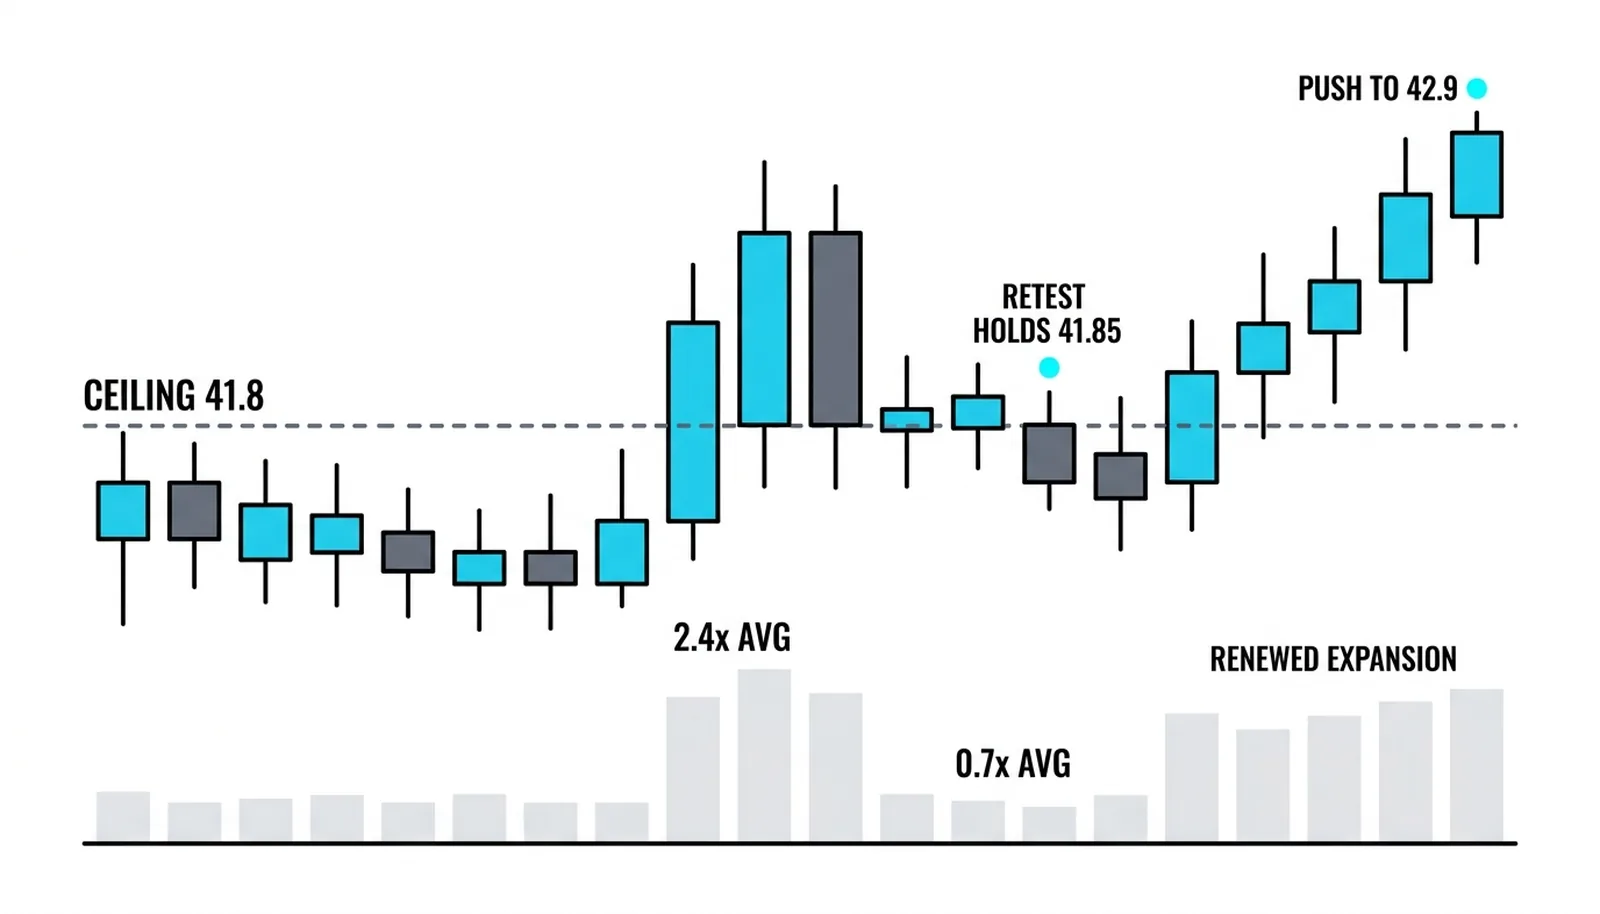
Here is a hypothetical illustration with invented round numbers. A stock coils in a 40.20 to 41.80 range for two weeks. Volume dries toward the top of the range, sliding from an average of one million shares a day down toward 600,000 as price presses under 41.80.
The break bar closes at 42.10 on 2.4 times average volume, roughly 2.4 million shares. That is the expansion phase doing its job. The next day, price retests the old ceiling, touching 41.85 on about 0.7 times average volume, and holds. The day after, a push carries to 42.90 on renewed expansion above two million shares. Quiet before, expansion during, acceptance after. All three phases printed.
Now the contrast read. The same break prints on 0.9 times average volume, stalls at 42.00, and closes back inside the range the same session. No expansion, no acceptance, no trade. The chart drew the same line through 41.80 in both cases. Only the volume told you which break had size behind it.
| Breakout phase | Validating volume | Anomalous volume | The read |
|---|---|---|---|
| Coil under the level | Volume dries up as price tightens | Heavy, choppy volume at the ceiling | Dry means sellers are done; heavy means supply is still being fed |
| The break bar | Well above average, often the heaviest in days | Average or below average | Expansion shows trapped exits plus new entrants; thin means no size believed it |
| The retest | Shrinking volume, price holds the level | Heavy selling into the old ceiling | Dry retest confirms the level flipped; heavy retest warns of failure |
| The follow-through | Renewed expansion on the next push | Price stalls or closes back inside the range | Acceptance completes the breakout; the snap-back voids it |
Breakout Confirmation, Answered
What is breakout confirmation?
Breakout confirmation is evidence that a move through a level is real, delivered in two parts: volume expansion on the break itself and acceptance beyond the level afterward. Price crossing a line is the claim. Volume and holding behavior are the evidence.
How much volume confirms a breakout?
There is no fixed threshold, but a break bar running roughly one and a half to two times the recent average or more is a common working standard. What counts is the clear departure from what the tape has been printing, not any single number. A break on average volume is a break without sponsorship.
Why do low volume breakouts fail?
They fail because no participant with size committed to the move, so there is no one left to defend the new ground. Without expansion, the break attracts no follow-through, and the trapped breakout buyers become sellers on the way back in. The snap-back into the range is those exits printing on the tape.
Should you enter on the break bar or wait?
Waiting for acceptance is the safer default, because the heaviest bar of a move is often the exhaustion bar. The retest on shrinking volume offers entry near the level with a clear invalidation point beneath it. Entering the break bar is a valid style for experienced traders, but it demands fast exits when acceptance never arrives.
The next lesson takes this same validated-versus-anomalous frame to the opposite situation: reversals, where volume has to prove that an old trend is actually finished rather than merely resting.