Two-Candle Patterns and the Last Word
Two-candle patterns put a second candle in charge of interpreting the first, and the three worth knowing are the engulfing pattern, the harami, and the tweezers. The second candle is the argument. The first candle is what it argues with.

Read the pair as a debate between two speakers, where the second one gets the last word and the pattern's meaning comes from what that last word overrides. One candle alone tells you what happened in a session. Two candles together tell you whether the market changed its mind, hesitated, or tested something and held.
Sibling lessons cover single candles and three-candle formations. Everything here is built from exactly two candles, because the pair is where interpretation starts.
The Engulfing Pattern: The Second Candle Takes Over
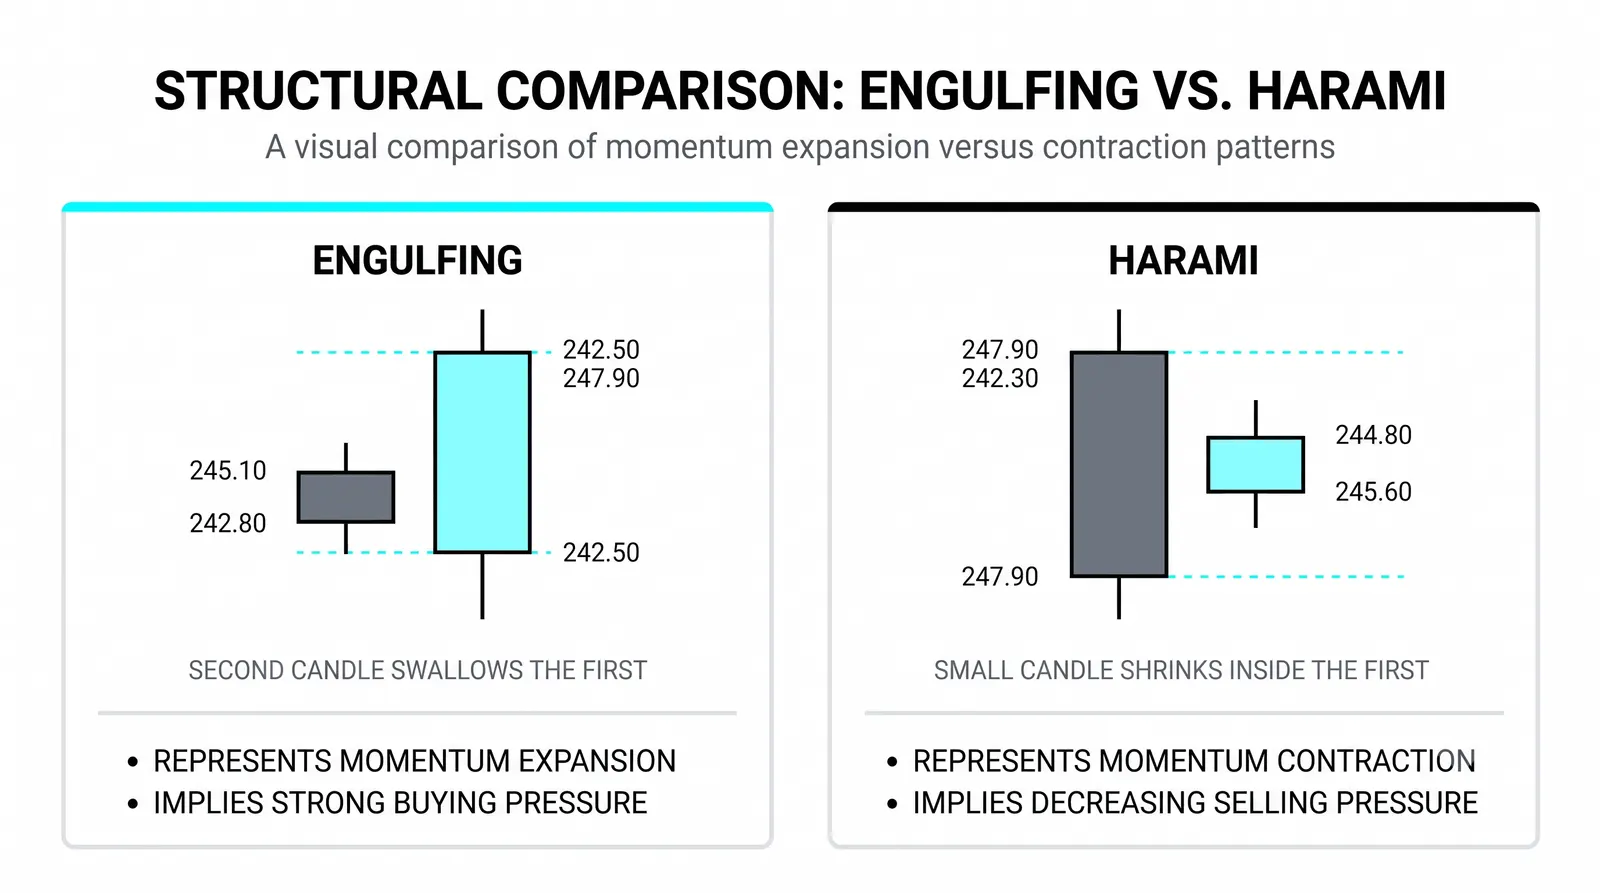
An engulfing pattern forms when the second candle's body completely covers the first candle's body. Open to close, the second session's range swallows the prior session's range. That is a full reversal of the previous session's result, printed in one bar.
A bullish engulfing appears after a decline. The first candle is bearish, closing near its lows. The second candle opens at or below that close and then rallies to close above the first candle's open. Sellers owned session one. Buyers erased all of it in session two.
A bearish engulfing is the mirror. After a rally, a strong up candle gets followed by a down candle whose body covers it entirely. The prior session's gain is gone, and the sellers did the erasing.
Pay attention to bodies, not wicks. The body is where the open and close sit, and the open-to-close battle is where conviction shows. A second candle whose wicks poke past the first candle's wicks but whose body stays inside is not an engulfing. It is noise with long shadows. Body coverage is the claim. Wick coverage is decoration.
The deeper the second body closes into the first one's territory, the louder the statement. A bullish engulfing that closes well above the first candle's open says buyers did more than win the session. They repossessed it.
The Harami: The Opposite Construction
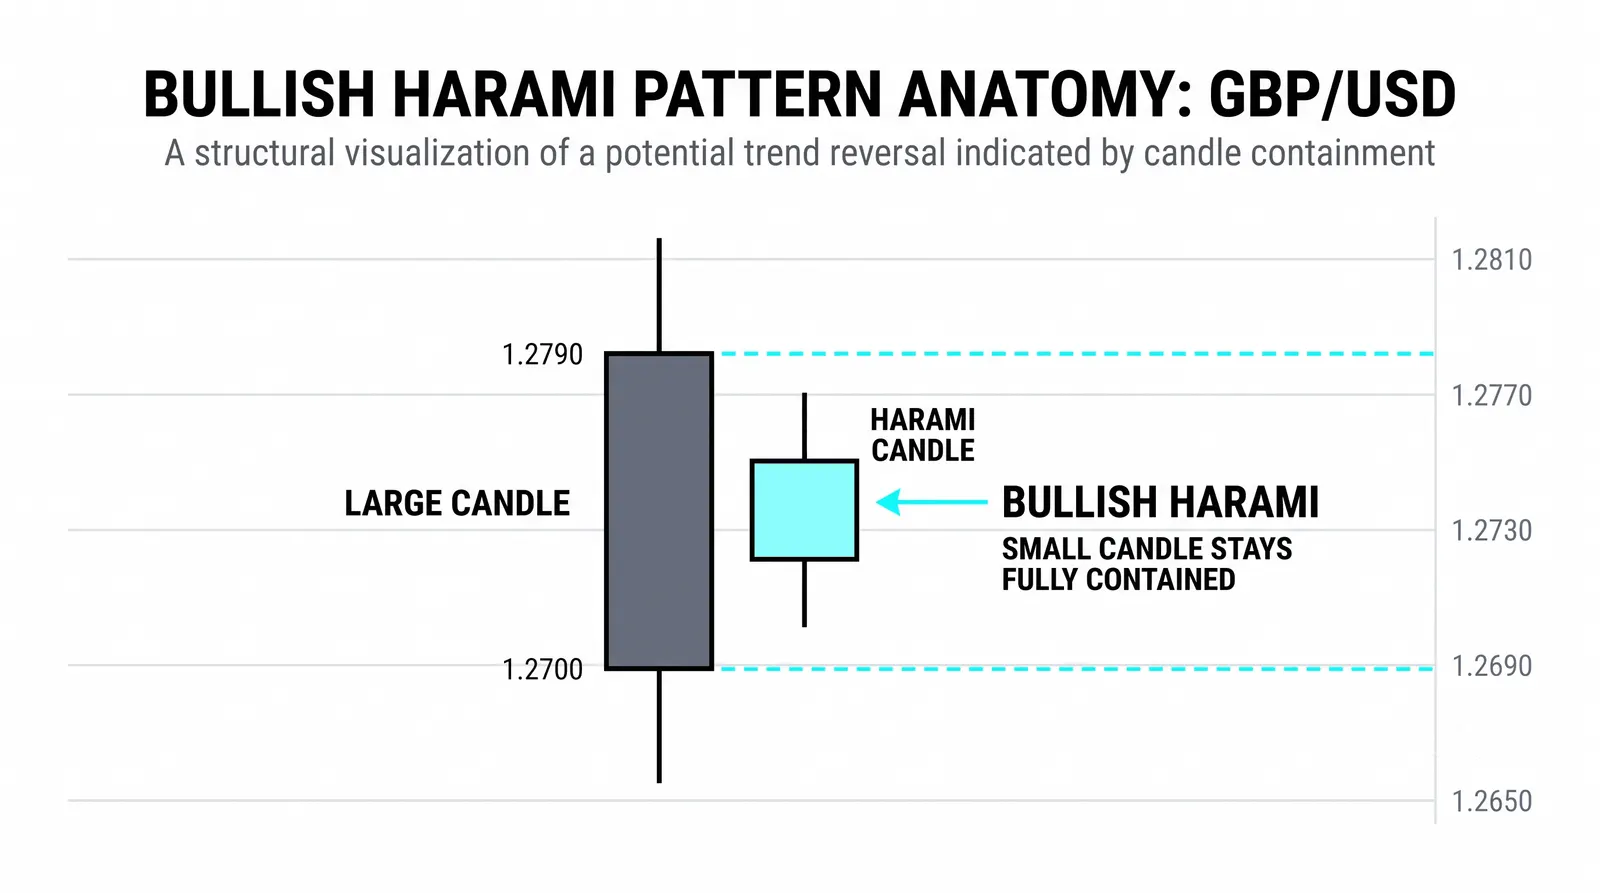
The harami flips the geometry. Here the first candle is large and the second candle is small, sitting entirely inside the first candle's body. Instead of the second session overrunning the first, the second session refuses to leave it.
That refusal is the message. After a strong trending candle, the market produces a small, contained session. The momentum that drove the big candle did not continue. It did not reverse either. It paused.
On daily charts this is the inside-day idea. The second session's entire range fits within the first session's body, which means neither buyers nor sellers could push price into new territory. The trend's fuel gauge just blinked.
Treat the harami as a request for patience, not a trigger. It does not tell you the trend is over. It tells you the trend stopped advancing for a session. Acting aggressively on a harami means acting on hesitation, and hesitation resolves in both directions. The honest response is to mark the pattern, tighten your attention, and let the next sessions reveal whether the pause becomes a reversal or a refuel.
The Tweezers: Same Price, Twice
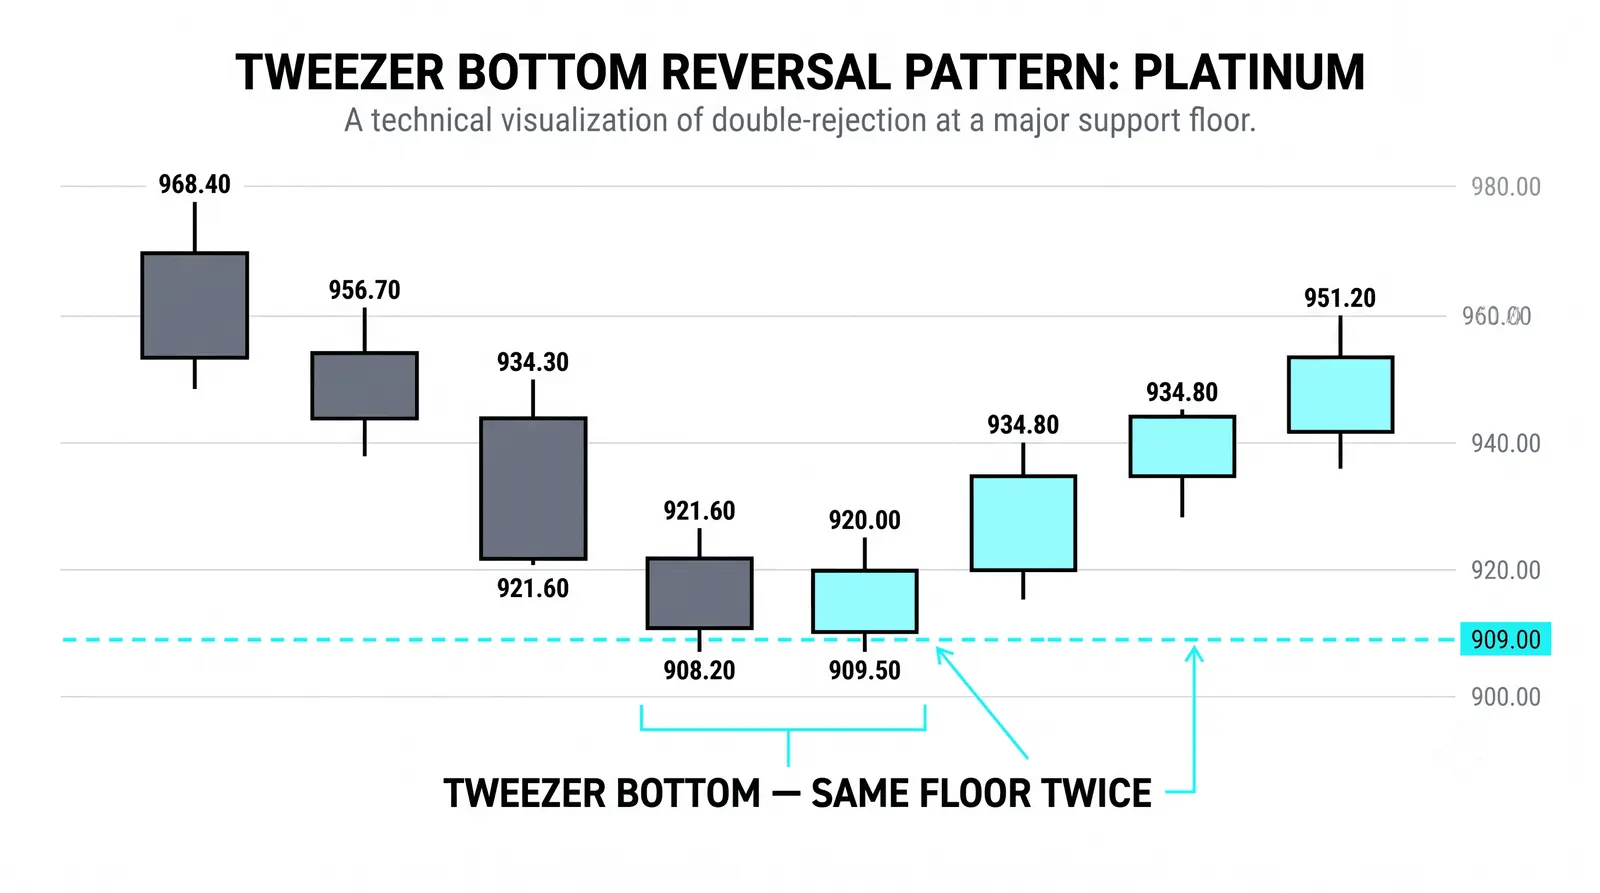
Tweezers form when two candles share the same high or the same low. The bodies can differ. The colors can differ. What matters is that price touched the same level twice and reacted.
A tweezer bottom is the version that matters at support. The first candle falls to a low. The second candle falls to that same low and fails to break it. The market tried twice to push lower and was refused at the same price both times. That is support being found in real time, not drawn afterward.
A tweezer top mirrors it. Two candles reach the same high, and neither can push through. Buyers tested the ceiling twice and got the same answer. Resistance confirmed itself while you watched.
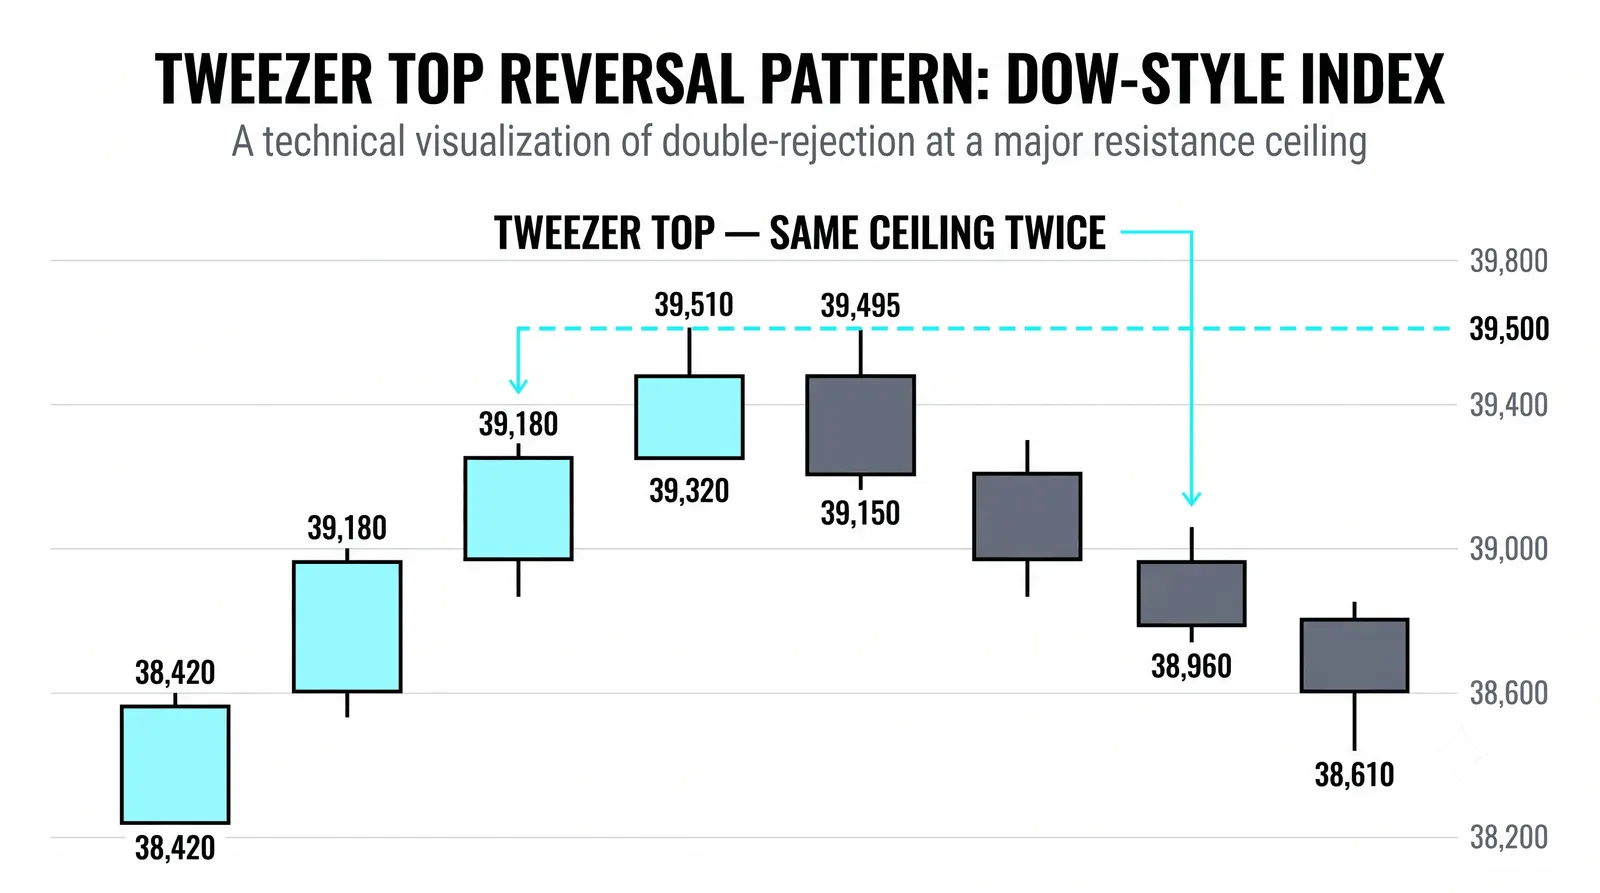
The matching price is the signal. Two separate sessions agreeing on a level means the level is defended, not accidental. One touch can be chance. Two touches at the identical price is behavior.
Which Pattern Argues Loudest
The three patterns do not carry equal weight, and ranking them keeps your expectations honest.
The engulfing asserts. It is a completed act: the second candle already reversed the first one's result by the time it closes. Of the three, it makes the strongest claim about direction.
The tweezers confirm a level. They say less about direction and more about location. A specific price held twice. That is evidence about where buyers or sellers live, and it pairs naturally with support and resistance work you already know.
The harami only suggests a pause. It is the weakest of the three as a directional signal, and treating it as a reversal signal is the most common misuse. It earns attention, not entries.
None of these patterns is a command. They are testimony, and testimony gets weighed against trend, location, and what the higher timeframe is doing.
Two Candles at the Low
Here is a hypothetical worked example with round numbers. A stock has been falling for two weeks and is approaching a support area near 40 that held twice earlier in the year.
Candle one is bearish. It trades down through the morning, prints a low of 40.05, and closes at 40.40. Sellers are still in control, but price is now sitting on the level you marked.
Candle two opens at 40.30. Early in the session it dips, and the dip stops at exactly 40.05, the same low as the day before. Buyers step in from there, and the candle closes at 41.30.
Read the pair. The equal lows at 40.05 form a tweezer bottom: the market tried twice to break below 40.05 and failed both times. The strong close at 41.30 adds weight, because the second candle did not merely hold the level. It rallied a full dollar off it and closed near its high.
The risk definition is clean. A stop just under 40.05, say 39.95, means the trade is wrong if the level that held twice finally breaks. From a hypothetical entry near the 41.30 close, that is roughly 1.35 of risk. If the prior swing high sits near 44, the reward side offers close to 2.70, about two-to-one. You know your risk before you know anything else, which is the correct order.
Notice what the pattern did and did not do. It did not guarantee a rally. It gave you a defined level, a failure of sellers at that level, and a price where the idea is provably wrong. That is all any pattern ever offers.
The Three Patterns Side by Side
| Pattern | What the Second Candle Does | Signal Strength | Natural Response |
|---|---|---|---|
| Engulfing | Body completely covers the first candle's body | Strongest directional claim | Consider an entry with a stop beyond the pattern |
| Harami | Small body sits entirely inside the first body | Weakest; a pause, not a reversal | Wait and watch; tighten attention, not positions |
| Tweezers | Matches the first candle's high or low exactly | Moderate; confirms a level | Mark the level and define risk against it |
Common Questions About Two-Candle Patterns
Does the second candle have to fully engulf the first body?
Yes. If the second candle's body does not completely cover the first candle's body, it is not an engulfing pattern. Partial coverage is a different, weaker statement. The strict definition exists because the pattern's meaning is total reversal of the prior session, and partial coverage only shows partial reversal.
Are tweezers valid if the highs are close but not exact?
Exact matches are the textbook version, but a tick or two of difference on a liquid chart still carries the same meaning: price was rejected from essentially the same level twice. Be stricter on lower timeframes, where a few ticks are noise, and more flexible on daily charts, where a level zone of a few cents is normal. What you should not do is call candles tweezers when the highs differ by a meaningful amount.
What does a harami during a trend tell me?
It tells you the trend paused for one session. The strong first candle showed trend conviction, and the small inside candle showed that conviction did not carry into the next session. Most of the time trends resume after a harami, so the correct read is reduced momentum, not reversal. Let the following candles settle the question.
Should I enter on the pattern or wait for another candle?
It depends on the pattern's strength and your risk tolerance. An engulfing at a well-marked level can justify entering on the close of the second candle, with a stop beyond the pattern. A harami almost always argues for waiting, since it predicts nothing by itself. Waiting costs you a worse entry price but buys confirmation; entering early gets a better price with less evidence. Both are legitimate, and the choice should be made before the pattern appears, not during it.
Two candles give you an argument and a verdict. The next step is learning what happens when a third candle joins the debate, which is where three-candle patterns pick up.