The Butterfly: Structure and Trading Rules
The butterfly pattern is the one harmonic whose pullback reaches deep to the 78.6 percent mark and whose final point pushes past the origin of the whole swing to the 1.272 extension. That combination makes it the deepest and the furthest of the harmonic family. Every other pattern in the set holds its retracement shallow or moderate and completes inside or near the prior range. The butterfly does the opposite on both ends.

Think of dough left too long in a warm spot, rising past the rim of the pan. The collapse that follows comes not despite the rise but because of how far past the rim it went. The butterfly trades on that same logic: the move that extends beyond its own origin is the move most likely to reverse from that excess.
The retracement lessons earlier in this curriculum covered the pullbacks that hold above the origin. This lesson is the extension case, the swing that carries past its own beginning and turns there. Everything else about reading legs and ratios carries over unchanged.
The Deep Point B
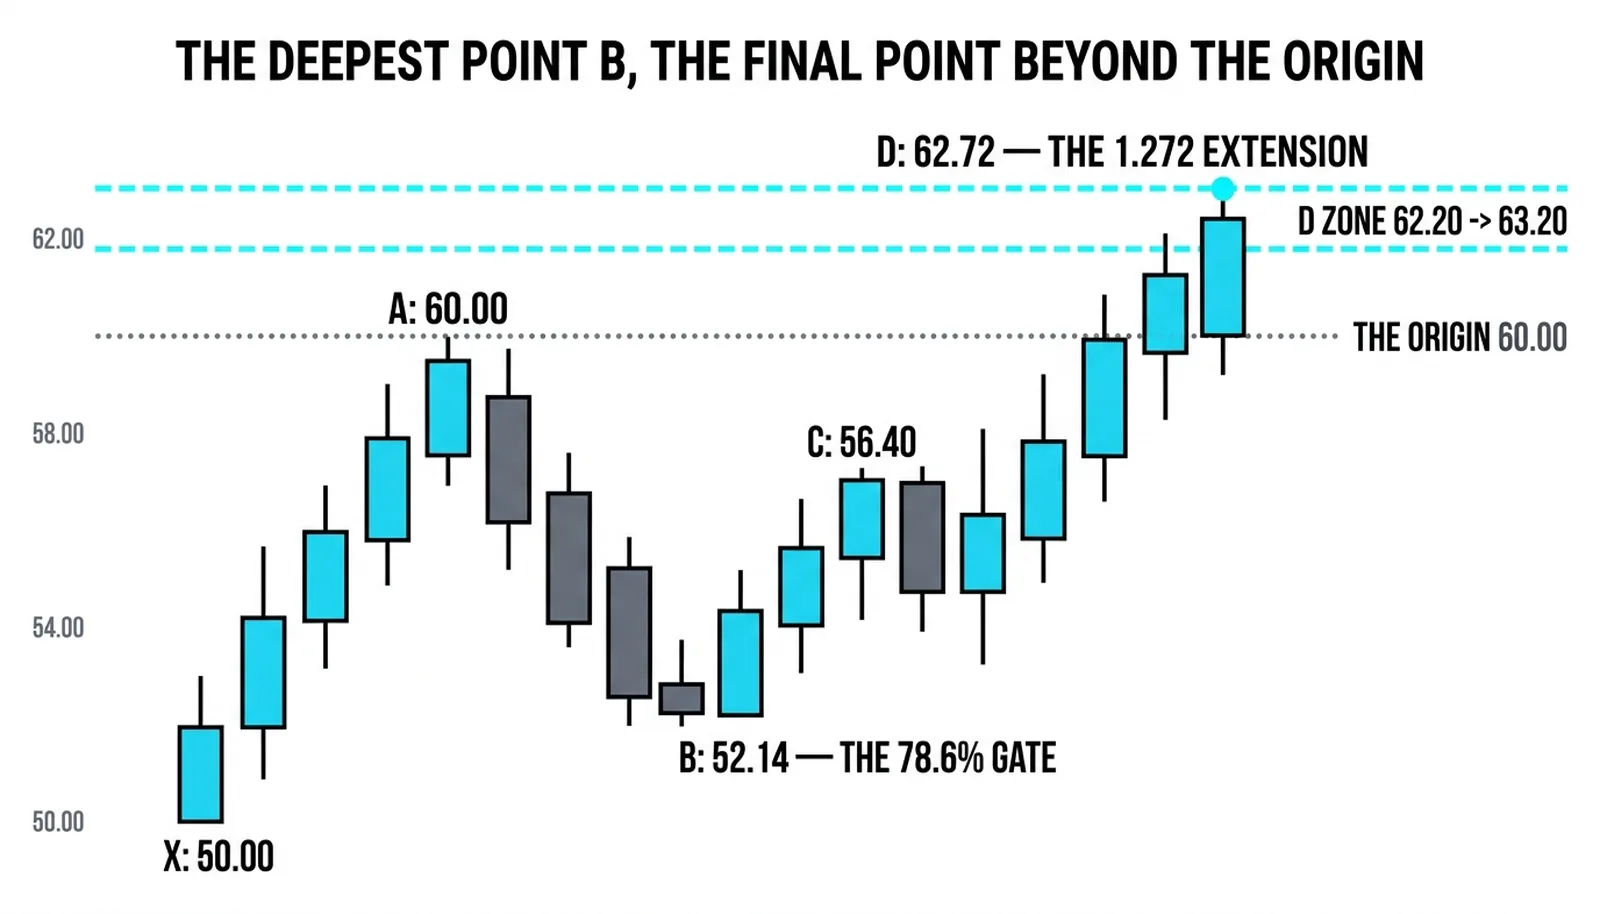
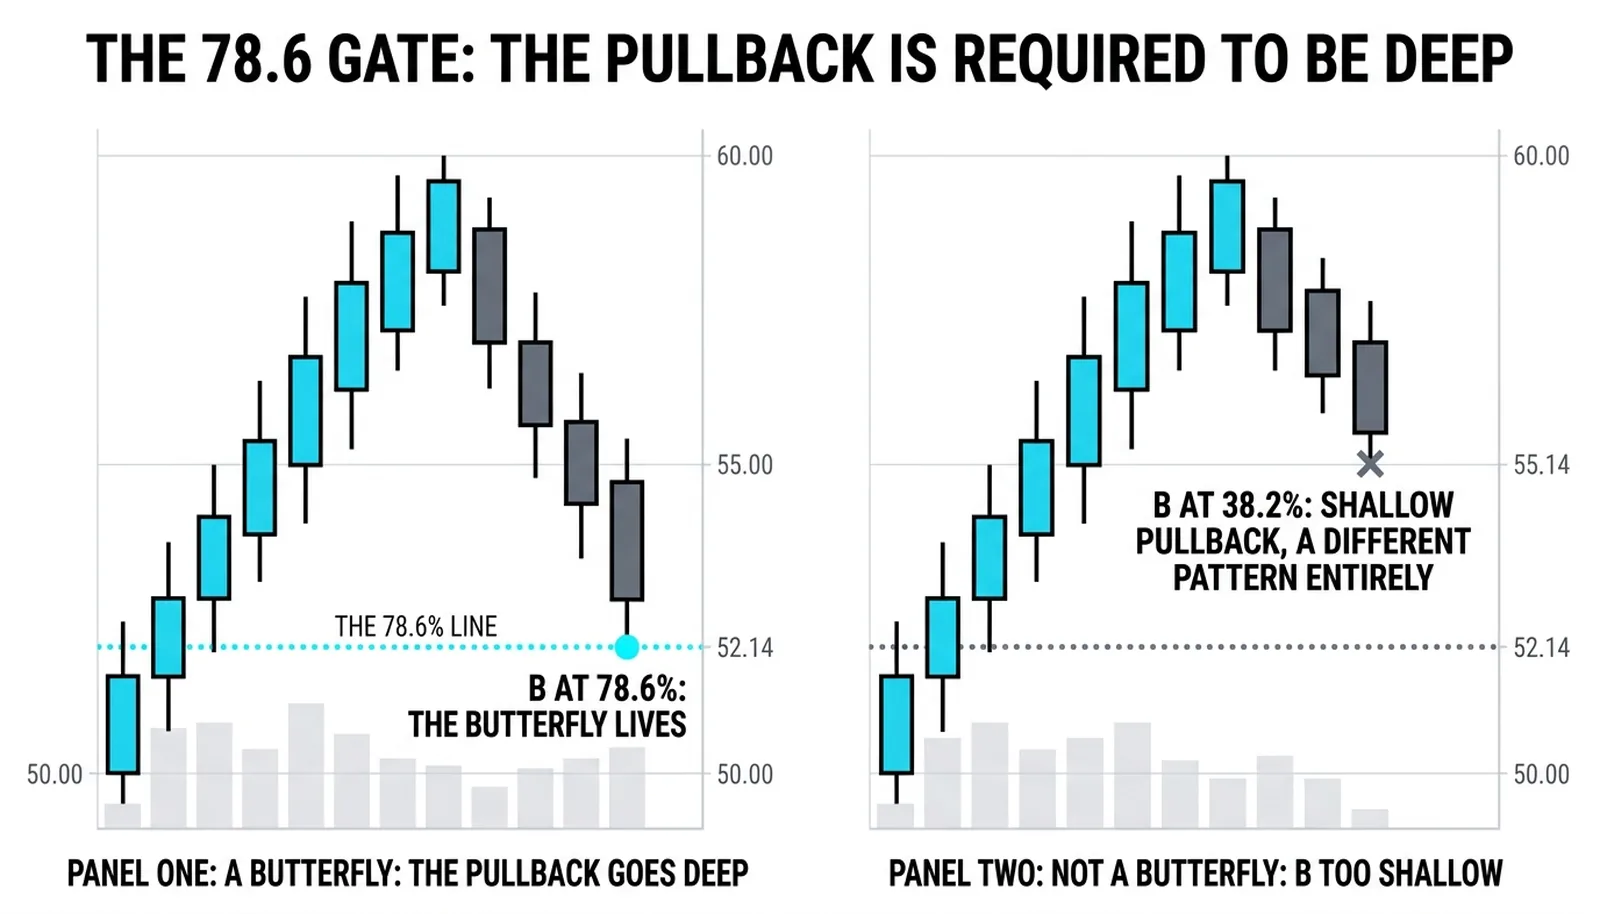
Point B is where the butterfly separates itself from the rest of the harmonic set. The gate is strict: the B point must retrace 78.6 percent of the XA swing. Not 61.8, not 70, not "close to deep." A pullback that stops at 50 or 61.8 percent belongs to a different pattern, and forcing the butterfly label onto it breaks the geometry that the trade depends on.
The depth changes the character of the whole structure. A shallow B tells you the trend is strong and the counter-move is weak. A B at 78.6 percent tells you the counter-move nearly erased the entire XA leg. The market came within a fifth of the range of giving everything back, then turned again. That is a different psychological situation: the side that drove XA has been seriously challenged, and the side that drove AB has shown real strength.
That tension is what the pattern is built on. When price then rallies off B and pushes beyond X, the move is happening after a near-complete retracement, which means the new extreme is being made by a market that already showed deep two-sided trade. The butterfly reads that as exhaustion risk rather than breakout strength.
Practical points on the B gate:
- Measure B against the full XA leg, from the X pivot to the A pivot, with no rounding to a nearby ratio.
- A B that reaches 88.6 percent is a different pattern entirely. Do not blur the two.
- The deeper B also repositions the stop. Because B sits far from X, the invalidation zone beyond D is measured against an already-stretched structure.
Beyond the Origin
The D point is the defining feature. It does not stop at the origin of the swing. It lands on the 1.272 extension of XA, measured beyond X, the number that is the square root of 1.618, the golden ratio's own constant. The structure completes with an AB equals CD relationship and a BC projection between 1.618 and 2.24 clustering around the same zone.
The history is worth telling plainly. The base structure appeared in H.M. The pattern's original description. The ratio framework was popularized by ratio analysis practice decades later. The butterfly name itself is credited to price geometry practice. The modern version, with the 0.786 B point and the 1.272 D point as hard gates, was codified by harmonic trading doctrine, which turned a loose shape into a testable pattern with defined invalidation.
The trade is the fade of the overshoot. At D, the market has made a new extreme beyond the origin of the entire swing. The butterfly's claim is that the extension itself is the sign the move is finished. The trader sells the new high, or buys the new low, against that extreme.
Be honest about what that feels like in real time. The new high is on the screen. The crowd is most certain at exactly the moment the pattern says to act against it. The claim is precise; the feeling at the moment is not. That gap is why the stop exists. The stop sits beyond the extension band, past the point where the last argument for continuation has been spent. If price trades there, the pattern is wrong, and the exit is automatic rather than debated.
The cluster matters here. A lone 1.272 print with no AB equals CD symmetry and no BC projection nearby is a thin zone. When all three measurements land within a tight band, the zone carries more weight. Harmonic trading doctrine treats the confluence as the potential reversal zone, not a single tick, and the trade is managed against the zone rather than against one exact price.
The High at 62.72
A worked example, all numbers hypothetical and round where the ratios allow. The swing runs from X at 50.00 up to A at 60.00, a ten-point leg. The pullback reaches B at 52.14, which is the 78.6 percent retracement of XA, deep but valid. The rally off B stalls at C at 57.00, a 61.8 percent retrace of the AB leg. Then price pushes past the origin.
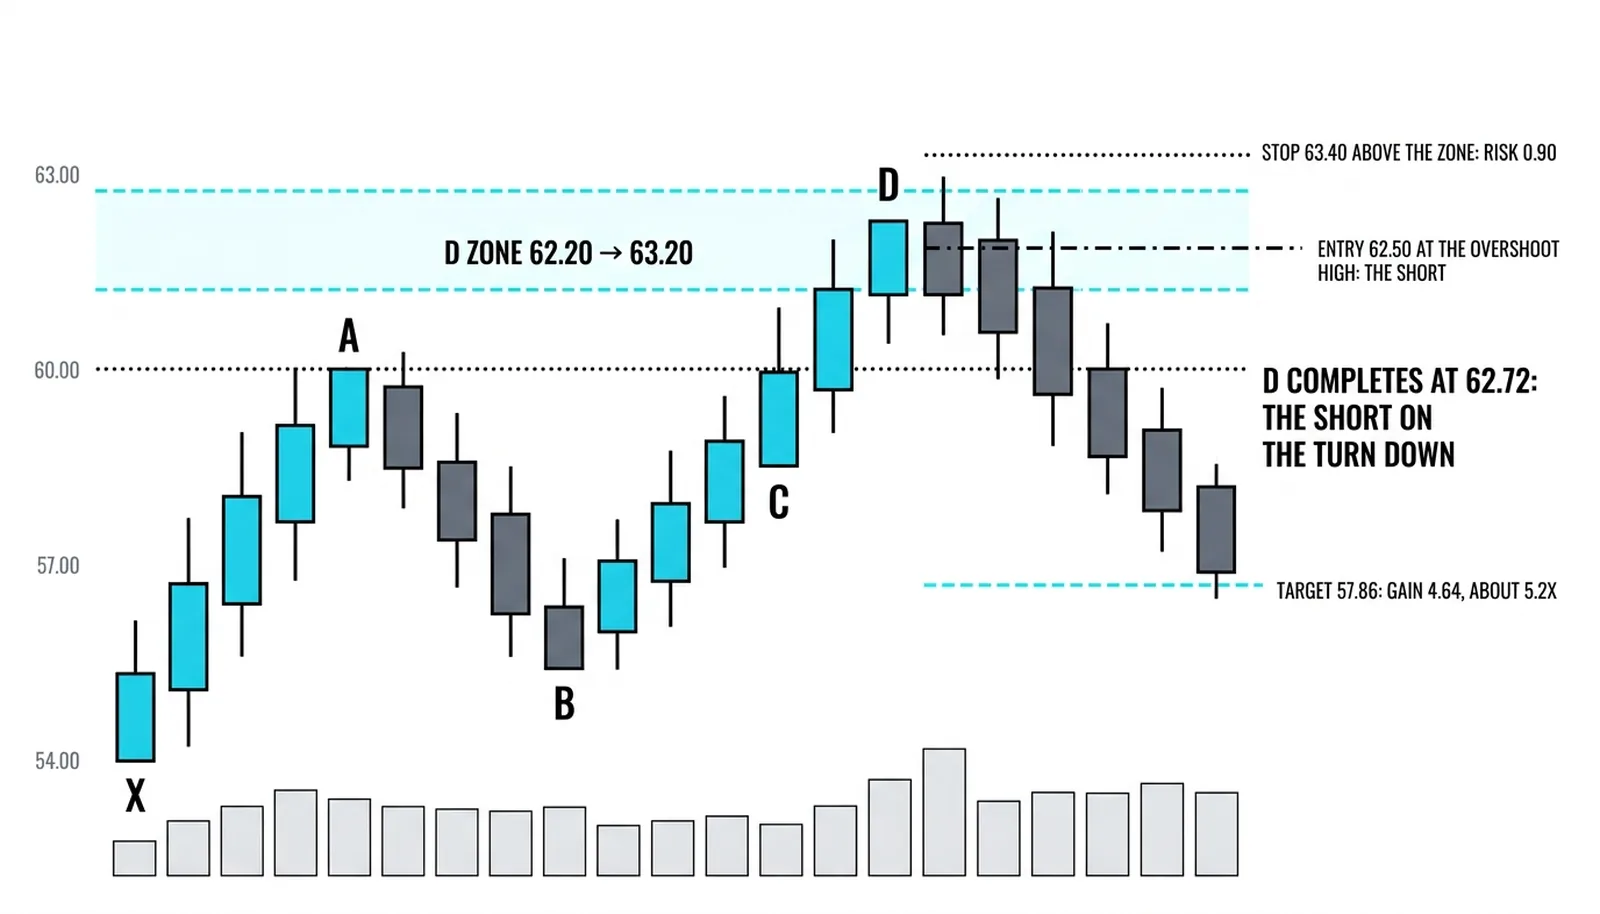
D completes at 62.72, the 1.272 extension of XA measured beyond X. The AB equals CD symmetry and the BC projection land within a few cents of it, so the zone is roughly 62.40 to 62.90. A reversal candle closes at 62.50, and the short is taken there.
The stop goes at 63.40, above the extension band. Risk is 0.90 per share. The first target sits at 57.86, the 38.2 percent retracement of the whole X-to-D range. That is a gain of 4.64 against a risk of 0.90, about 5.2 times the risk. The reward profile is why traders tolerate the discomfort of selling a new high.
Now the failed version, stated plainly. Price does not turn. It trades through 63.40, takes the stop, and closes at 64.10. The extension was not exhaustion; it was continuation. The loss is 0.90, small relative to the 4.64 the winning version paid. The pattern loses small in that case precisely because its stop sits beyond the crowd's extreme, where the final argument for the move has already been spent. A trader who moved the stop wider "because the high looked strong" converts a defined small loss into an undefined one, and that is the actual danger of this pattern, not the fade itself.
| Point | Leg It Ends | Defining Ratio | Example Price |
|---|---|---|---|
| X | Origin of the swing | Starting pivot | 50.00 |
| A | XA | First extreme | 60.00 |
| B | AB | 78.6% retrace of XA | 52.14 |
| C | BC | 38.2%–88.6% retrace of AB | 57.00 |
| D | CD | 1.272 extension of XA, with BC projection 1.618–2.24 | 62.72 |
Butterfly Questions, Answered
What is the butterfly pattern?
The butterfly pattern is a five-point harmonic structure defined by a deep 78.6 percent retracement at B and a completion at the 1.272 extension of the XA leg beyond the origin. The trade is a reversal entry at D, taken against the new extreme the pattern itself predicts.
Why does the butterfly extend past the origin?
Because the deep B point changes the geometry. After a 78.6 percent retracement, the only way the final leg completes the ratio structure is by traveling beyond X. The extension is not an accident of the pattern; it is the mathematical consequence of the deep pullback, and it is what the fade is built on.
What is the 1.272 extension?
The 1.272 extension is the square root of 1.618, the golden ratio constant, applied to the XA leg and projected beyond X. In the butterfly, D must reach this level for the pattern to be valid. A reversal that starts before price touches the extension is not a butterfly completion, and trading it as one removes the edge the ratios provide.
When does the butterfly fail?
The butterfly fails when price trades through the extension band and keeps going, which is continuation rather than exhaustion. The stop beyond the band defines that failure in advance, so the loss stays small and fixed. Failure becomes expensive only when the trader widens the stop or re-enters repeatedly against a trend that has already proven the pattern wrong.
Next in the harmonic series: the Bat, the Crab, and the Shark, each with its own ratio gates, and then the checklist that turns a zone of lines into a managed trade from entry to exit.