Bullish vs Bearish Candles Patterns
Bullish and bearish candles are the simplest signal in trading: a bullish candle closes above its open, a bearish candle closes below it. The definition is that small. Everything else, every pattern name you will ever hear, is just a few of these candles in a row describing a fight that is turning. The reading skill matters far more than memorizing the names.

Think of each candle as a round in a fight, and a pattern as the moment the momentum of that fight visibly shifts. One round tells you little. Three rounds in sequence tell you who is tiring.
What Actually Makes a Candle Bullish or Bearish
Color is the least interesting part. You already know bodies and wicks from the anatomy lesson, so here is the short version of what adds meaning on top: where the close sits inside the range, how big the body is relative to recent candles, and where on the chart the candle forms.
A candle that closes at the very top of its range says buyers held control into the bell. A candle that closes mid-range says the round ended in a draw, even if it printed green. Same color, different story.
Context beats color every time. A strong green candle in the middle of nowhere is noise. The same candle at a level you have marked is information.
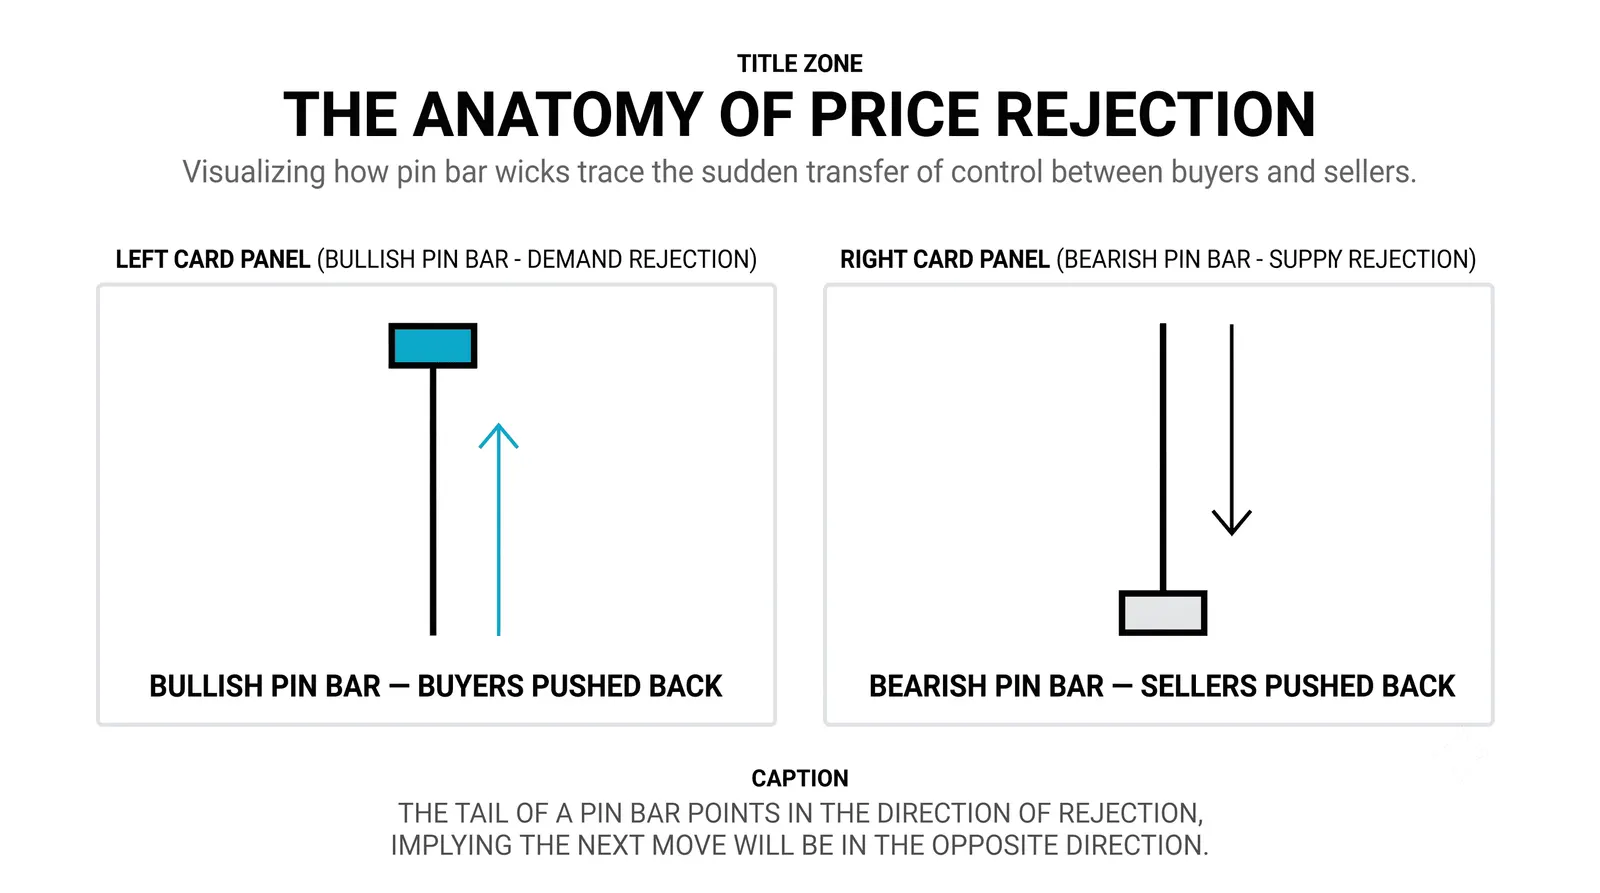
The Pin Bar: Rejection You Can See
A pin bar has one long wick and a small body. Price traveled somewhere, got thrown back, and closed near where it started. The long wick is the record of rejection.
After a decline, a long lower wick hints that sellers pushed down and buyers answered with force. That is a potential bullish signal. The exact same shape printed in the middle of a sideways range hints at nothing at all.
Location decides everything. A pin bar at support is a story. A pin bar in no man's land is a doodle.
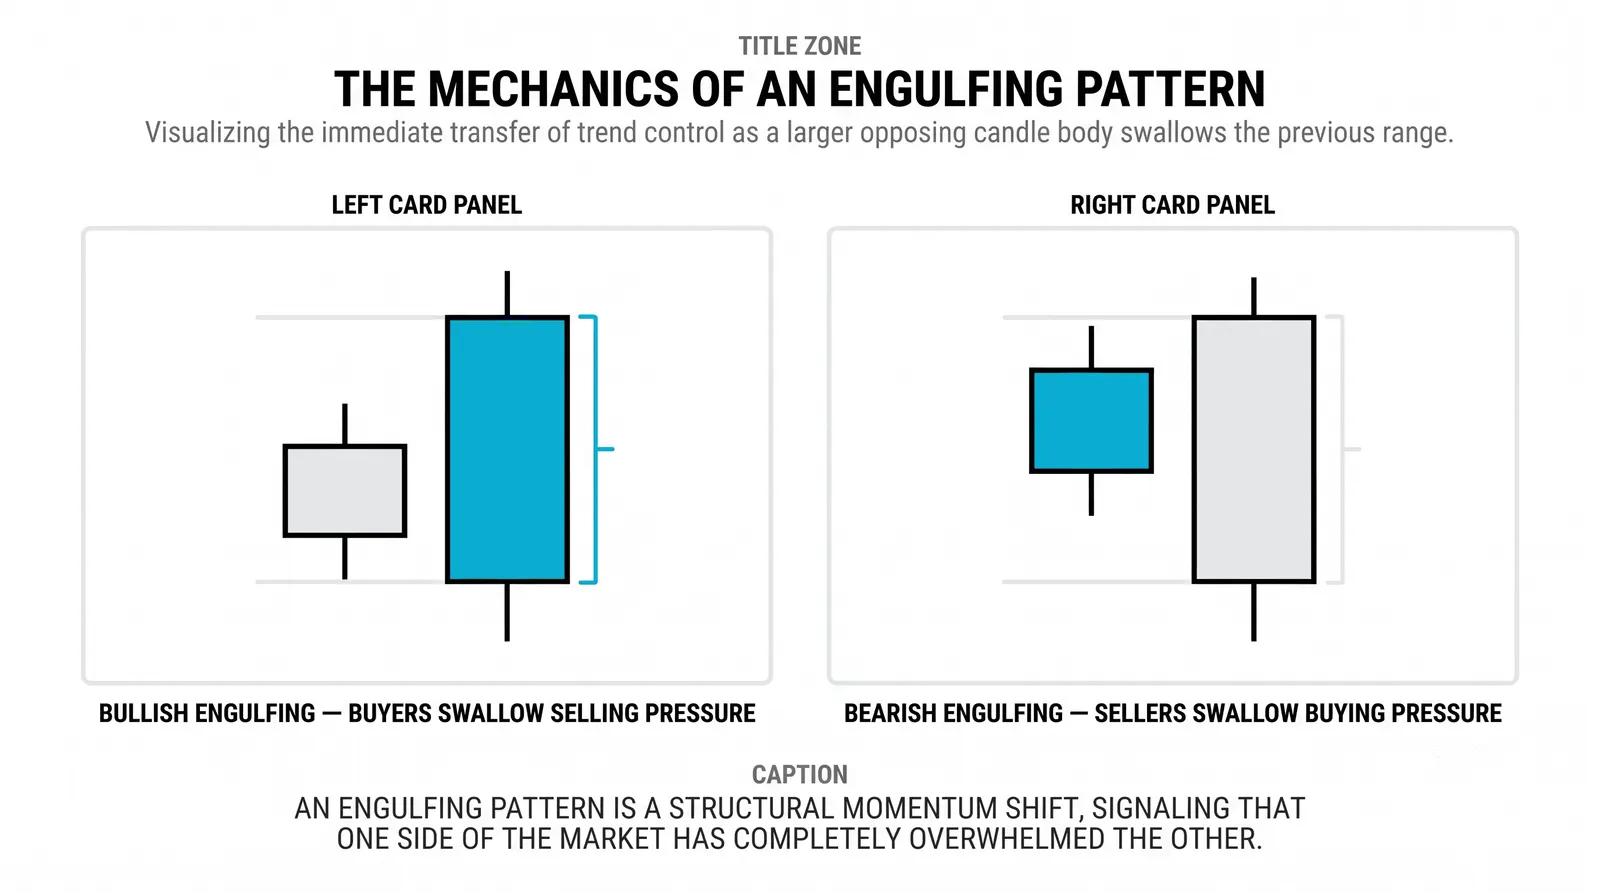
The Engulfing Candle: One Side Takes the Round
An engulfing candle is a body that completely swallows the body of the previous candle. One side did not just win the round, it erased the other side's progress entirely.
The classic bullish version: after a decline, a green candle opens near the prior close and closes above the prior open, swallowing that red body whole. Sellers had control, then buyers took all of it back and more.
The bearish mirror works the same way after a rally. A red candle engulfs the prior green body, and the buyers' last gain disappears in one session. The shape is identical. The direction flips with the trend that came before it.
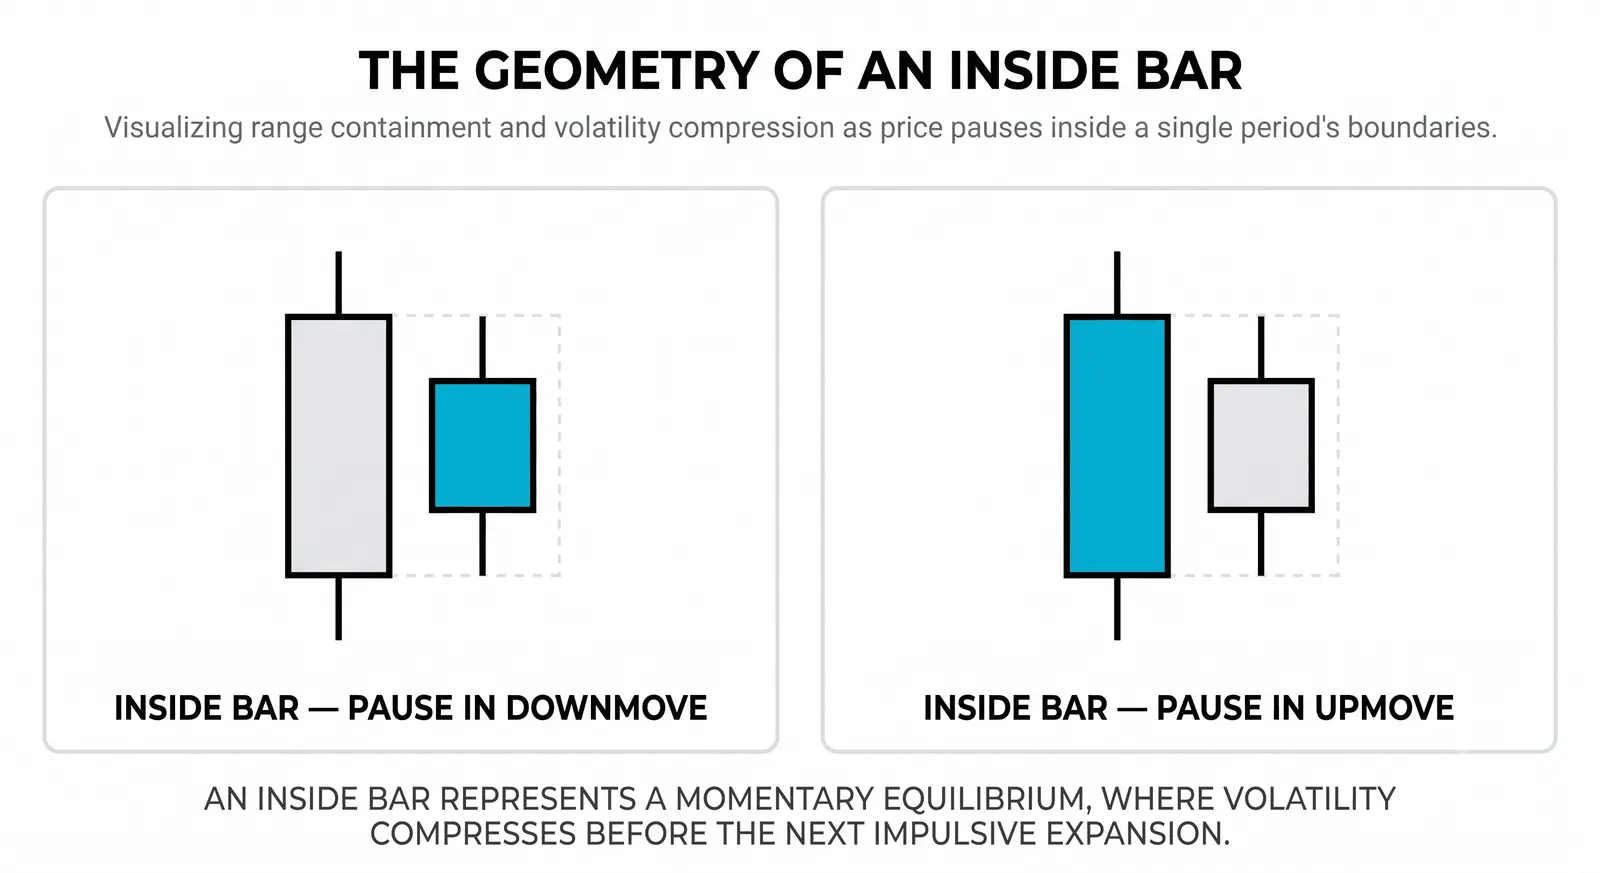
The Inside Bar: The Market Holds Its Breath
An inside bar fits entirely within the range of the candle before it. No new high, no new low. The market paused and refused to commit.
Beginners get this backwards: the inside bar itself decides nothing. It is a question, not an answer. The break of the outer bar's high or low is what tells you which side won the pause.
So the trade, if there is one, comes from the break, not from the inside bar. Patience is built into the pattern.
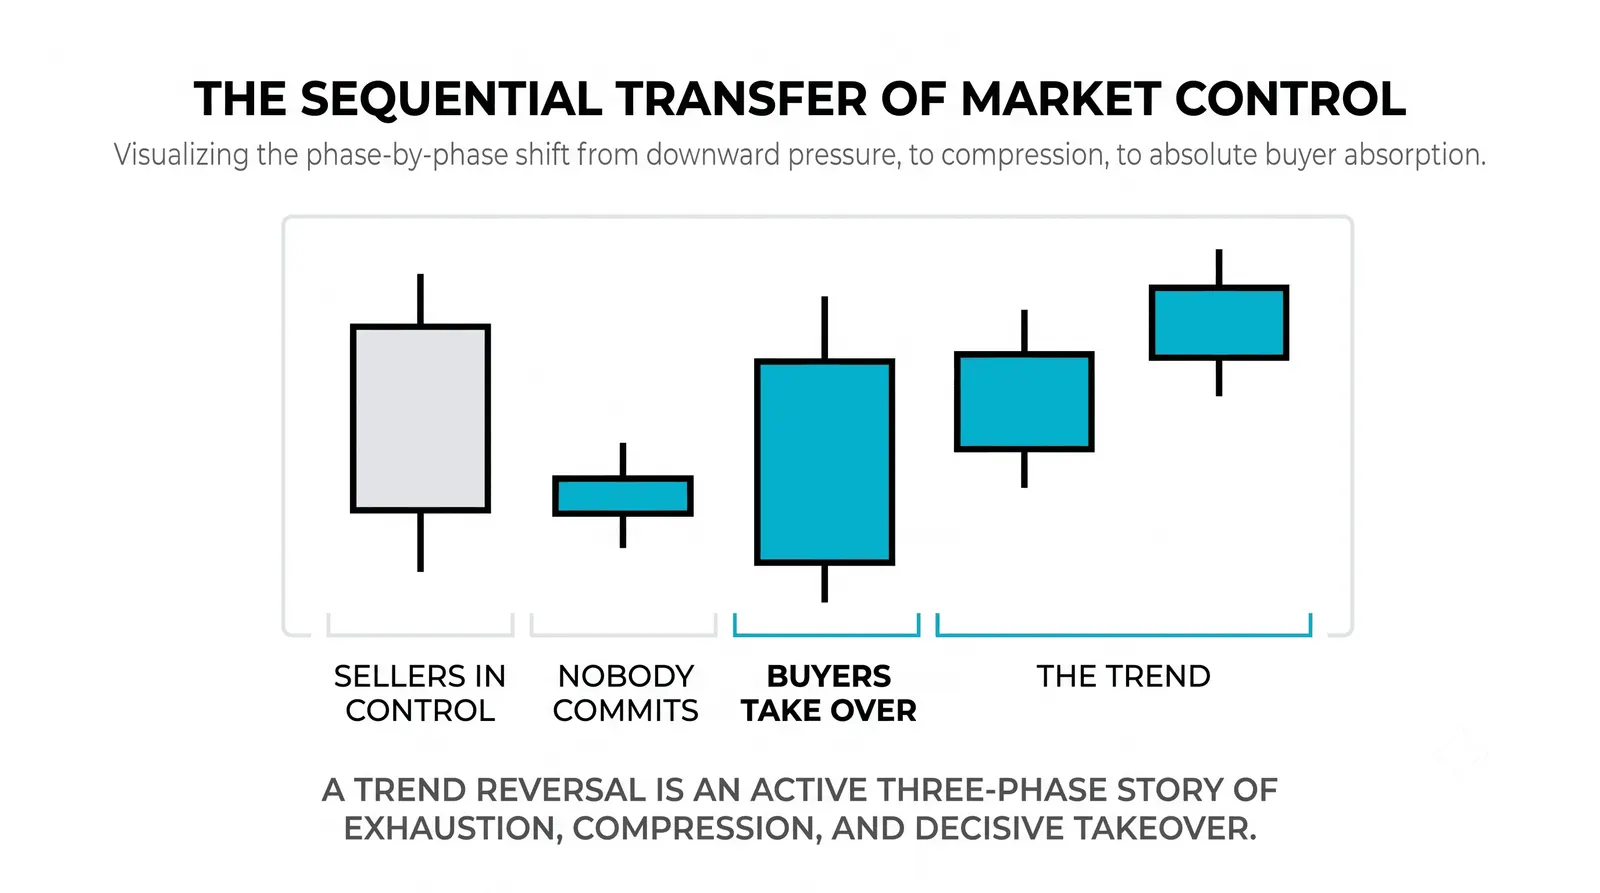
A Worked Example With Round Numbers
Hypothetical: a stock slides from 60 down to 52 over two weeks. At 52 it prints a small green candle with a long lower wick. Sellers pushed below 52 during the session and buyers drove it back up. That is your pin bar, and it printed at a level.
The next candle opens at 53 and closes at 56, swallowing the prior body completely. That is your bullish engulfing, confirming what the pin bar suggested.
Read it out loud: sellers pushed, buyers answered harder, momentum flipped. Two candles, one coherent story, and it happened at a price where a story was plausible.
Now the honest caveat. Without a level nearby, that same two-candle sequence is just two candles. Patterns at random prices fail constantly, and nobody publishes those charts in the pattern books.
Reading Three Candles Together
Single candles whisper. Three candles in a row start to speak in sentences, and there are really only two sentences worth learning.
Push, pause, push again. A strong candle, a small hesitant one, then another strong candle in the original direction. That is continuation. The pause was rest, not resistance.
Push, stall, reverse. A strong candle, a small one, then a strong candle in the opposite direction. That is exhaustion. The first side ran out of willing participants and the other side walked in.
Notice that the pin bar, engulfing, and inside bar are just these sentences compressed. A pin bar is a stall and reversal in one candle. An engulfing is the reversal leg. An inside bar is the pause. Three shapes cover most of what you need for a long time.
| Shape | Bullish Version | Bearish Version | What Confirms It |
|---|---|---|---|
| Pin bar | Long lower wick after a decline, at support | Long upper wick after a rally, at resistance | Next candle moves in the rejection direction |
| Engulfing | Green body swallows prior red body after a drop | Red body swallows prior green body after a rally | Forms at a level, ideally on rising volume |
| Inside bar | Break above the outer bar's high | Break below the outer bar's low | The break itself; the inside bar alone confirms nothing |
Notice the last column. Every shape needs something after it or around it. None of them are self-sufficient, and treating them as self-sufficient is how beginners donate money to patient traders.
Questions About Bullish and Bearish Candles
How many patterns do I actually need to know?
Three is enough to start: the pin bar, the engulfing candle, and the inside bar. Books list fifty or more, but most are variations of the same push-pause-reverse idea. Depth with three shapes beats shallow familiarity with thirty.
Do candle colors matter?
Yes, but less than you think. Color tells you who won the close, which is the definition of bullish or bearish. What matters more is where the close sits inside the range and where the candle sits on the chart. A green candle closing at its low is barely bullish at all.
What confirms a candle pattern?
Location first, follow-through second. A pattern at a marked support or resistance level carries weight; the same pattern mid-range does not. Then the next candle should move in the direction the pattern suggests. No follow-through, no trade.
Do these patterns work on all timeframes?
Yes, the shapes mean the same thing on a five-minute chart and a weekly chart. The difference is reliability and noise. Higher timeframes filter out random fluctuation, so a pin bar on a daily chart generally deserves more attention than one on a one-minute chart.
Your next step is not more patterns. It is screen time with these three: pull up a chart, mark your levels first, and only then look for a pin bar, an engulfing candle, or an inside bar at those levels. Once that feels natural, the lesson on why location matters more than the pattern will show you how these pieces fit into an actual trade plan.