Setting Up Fibonacci Tools Correctly
A fibonacci tool is only as honest as its anchors, and setting one up correctly means attaching it to the marked swing points your structure lessons defined, on the frame you actually trade, with the direction convention followed. The tool itself is simple arithmetic. It takes two prices, measures the distance between them, and draws lines at the standard ratios along that distance. Everything that can go wrong sits in the two prices you hand it. Give it the right swing and the lines carry meaning. Give it the wrong swing and it draws confident lines to nowhere, and it will never warn you which one happened.

Think of a plumb line: it tells the truth only while it hangs free from the right point, and it lies politely the moment it is tied to the wrong beam. The marking rules from the earlier levels already made swing labels precise, with the flanking test and the recency rule doing the work. This lesson applies exactly those rules to the tool. The anchor points of every Fibonacci retracement are marked swing points, not bars that look important on a quick glance. If a point would not survive the marking process, it does not get to hold one end of the tool.
Four Steps to an Honest Tool
Step one is picking the correct swing. In an uptrend the tool runs from the marked swing low to the marked swing high, the visible completed swing per the flanking rules. In a downtrend the convention reverses: high to low. The reason is logical, not ceremonial. A retracement projects the counter-move, the pullback against the trend, so the tool must span the trending leg it is measuring. Draw it backwards and the ratios still print, but they describe a move that was never the question.
Step two is choosing the external swing. The external swing is the leg that owns the trend on your frame, the move from the last major turn to the current extreme. Inside that leg sit smaller counter-moves, internal swings, and anchoring on one of those produces levels that look official and mean nothing. This is the frame mix-up from the structure lessons returning under a new name. A minor pause inside a larger leg is not the leg. The tool cannot tell the difference, so you have to.
Step three is checking the platform's ratio set before trusting a single line. Most platforms ship with the standard five, and many add extras or let users save custom sets from someone else's template. Know which ratios are on your chart and which are which. A line you cannot name is a line you cannot assign meaning to, and an unexplained line on a chart is worse than no line at all because it still influences your eye.
Step four is one frame per decision. The higher frame gives you the map: where the major leg runs, where its retracement zones sit. The trading frame gives you the entry: the turn, the trigger, the stop placement. Never average two frames' lines into one mush, and never treat a higher-frame level and a trading-frame level as interchangeable. Fibonacci cluster practice is built around confluence across frames, and even there each frame's measurements are treated as distinct inputs, not as lines to blend.
The Failures Seen in the Wild
Anchoring on noise bars is the most common failure. A long wick or a dramatic single bar catches the eye, and the trader clips the tool to it without checking whether the point passes the flanking test. The result is a set of levels anchored to a print that the structure never confirmed. The lines look precise. The precision is borrowed.
Drawing on a swing that has not completed is the second failure, and it is subtler. A swing high is not a swing high until the recency rule says so, until price has moved away enough to confirm the turn. Traders in a hurry anchor on a high that is still forming, and then the market extends the leg and every level shifts. The trader concludes the tool is unreliable. The tool was fine; the anchor was a rumor.
Flipping the direction convention is the third failure, and it usually happens when a trader switches between longs and shorts in the same session. The retracement of an up-leg measures how far price falls back into that leg. Draw it high to low out of habit and the percentages invert, and suddenly the 38.2 line is being read as a 61.8. The chart still looks plausible, which is exactly why this error survives.
The fourth failure is the all-timeframe pileup. The trader draws the tool on the weekly, the daily, the four-hour, and the hourly, all on one chart, until the screen is all lines and no read. Every level touches some other level, so every price looks significant, which means no price is. The pileup feels thorough. It is the opposite: it is the refusal to decide which frame owns the decision.
What the Correct Anchor Is Worth
The difference between a right anchor and a wrong one is the difference between a level that sits where the whole market's pullback logic clusters and a level that hangs in the middle of old noise. The correct anchor ties the ratios to the leg that participants actually traded, the move they remember and react to. The wrong anchor ties the same ratios to a fragment, and fragments carry no shared memory.
The platform will draw both versions without complaint. It does not know which swing is real, and it cannot know, because "real" is a structural judgment, not a data point. The trader's judgment about the anchor is the entire input that matters. The honest guard is the marking discipline: the same flanking test, the same recency rule, applied before the tool is ever picked up. Traders who skip that step are not doing Fibonacci analysis. They are decorating.
One blunt truth: most complaints about Fibonacci levels "not working" trace back to anchor selection, not to the ratios.
The Same Chart, Two Anchors
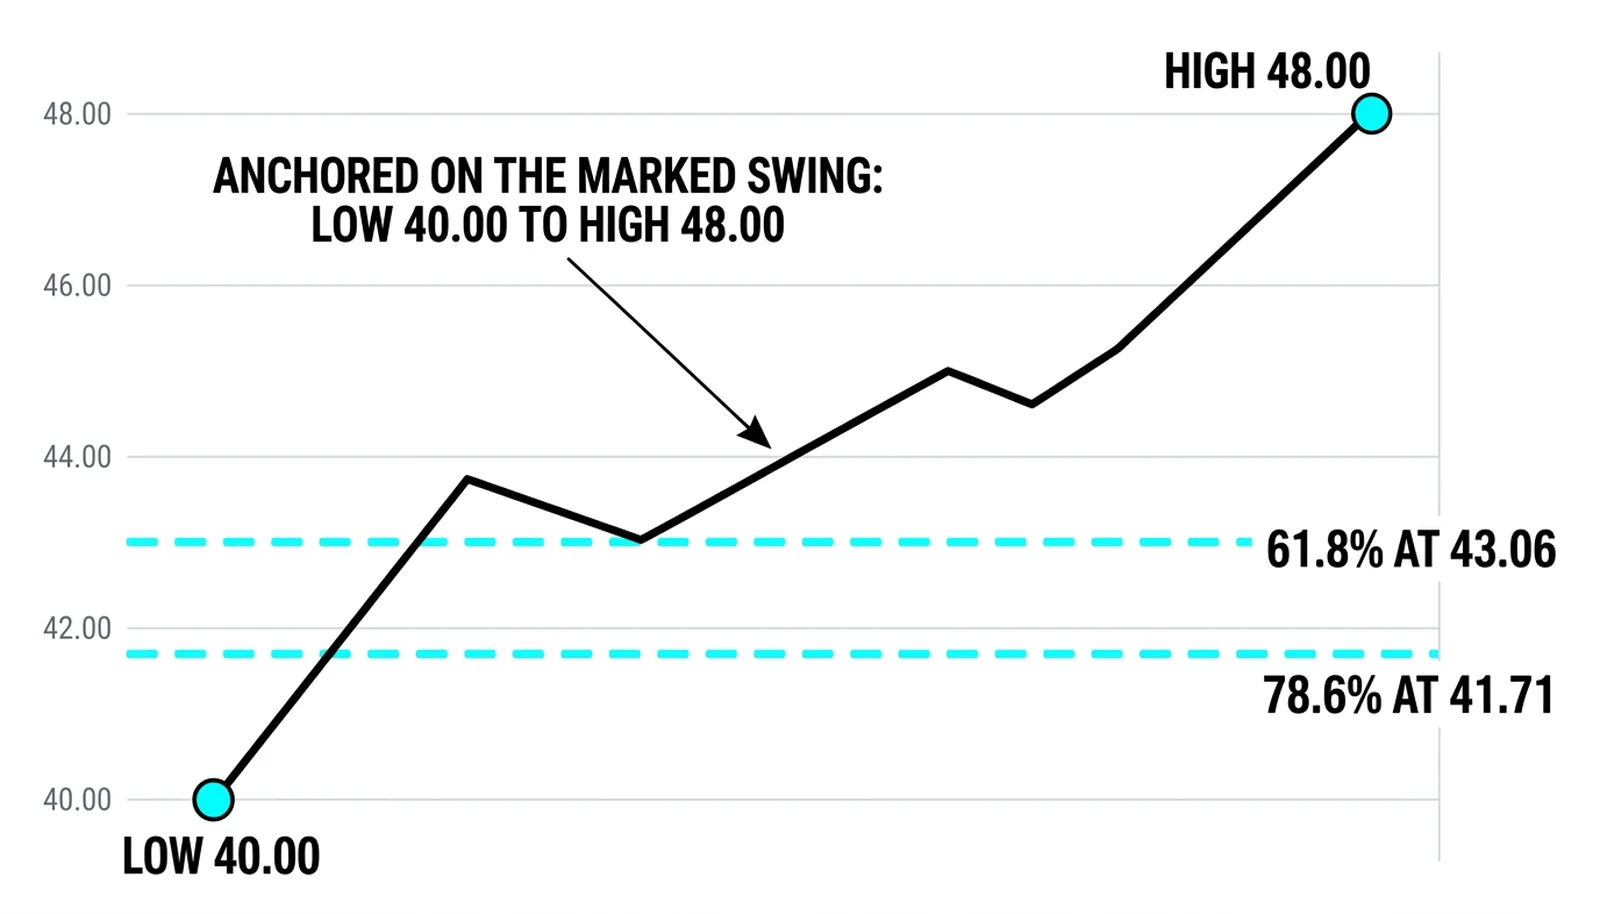
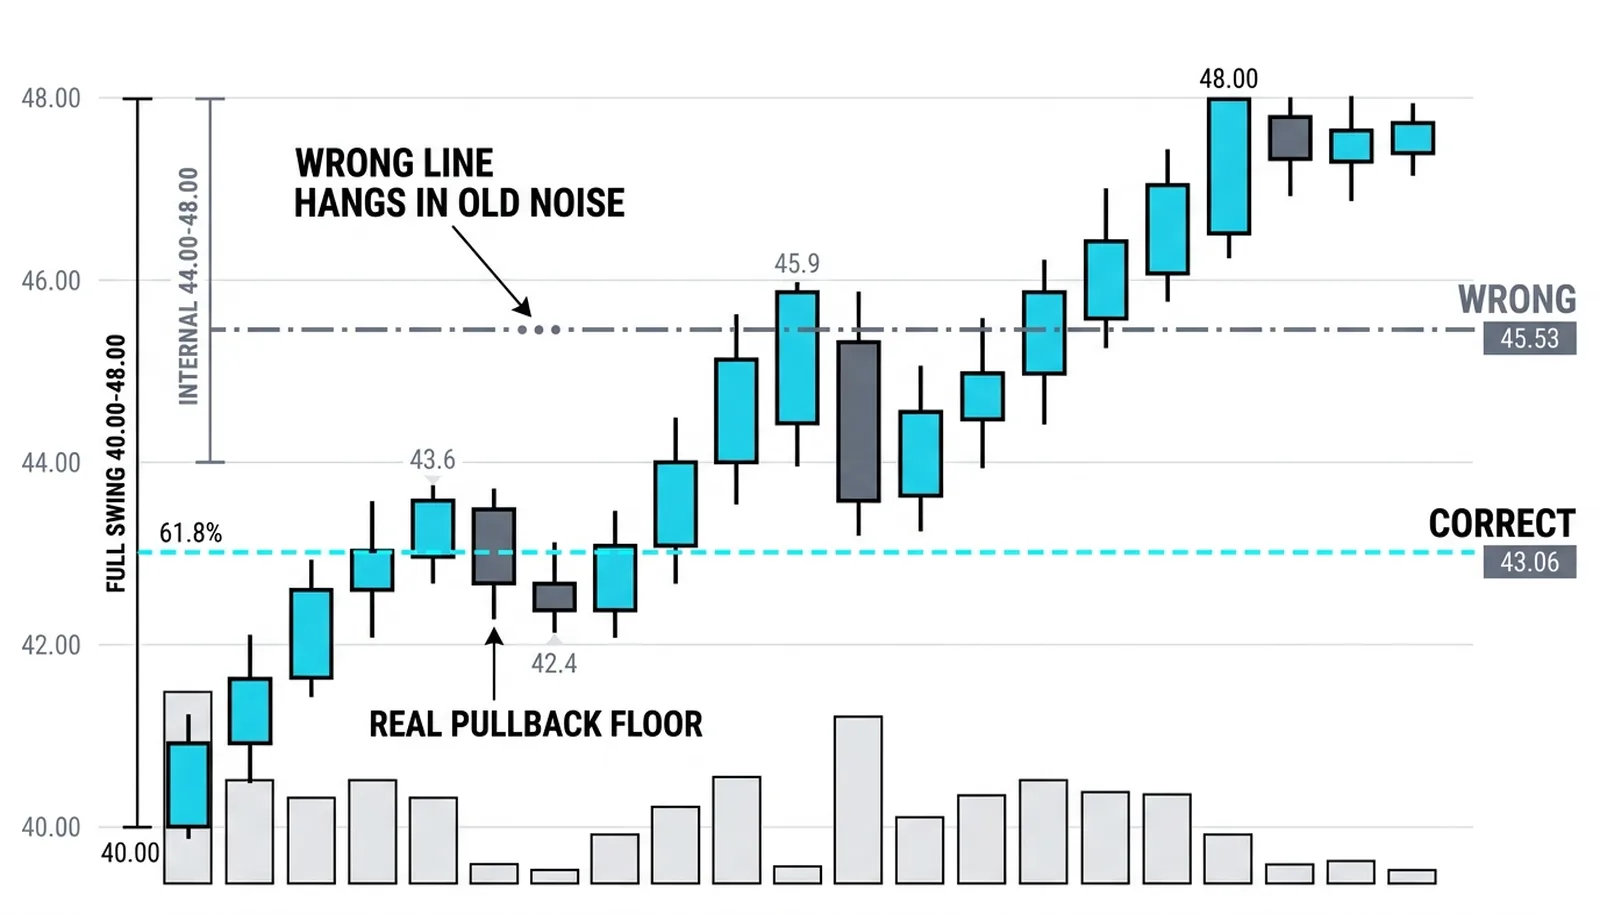
Everything below is hypothetical, with round numbers invented for illustration. A leg runs 8.00 points, from a marked swing low at 40.00 to a marked swing high at 48.00. The correct anchor, low to high, puts the 61.8 percent retracement at 43.06 and the 78.6 percent line at 41.71. Both sit inside the leg where a deep pullback would logically exhaust itself.
Now the wrong version. Inside that leg there was a minor internal swing from 44.00 to 48.00, a small consolidation that never owned the trend. Anchor the tool there and the 61.8 percent line lands at 45.53, hanging in the middle of the leg's old noise with no structural meaning at all.
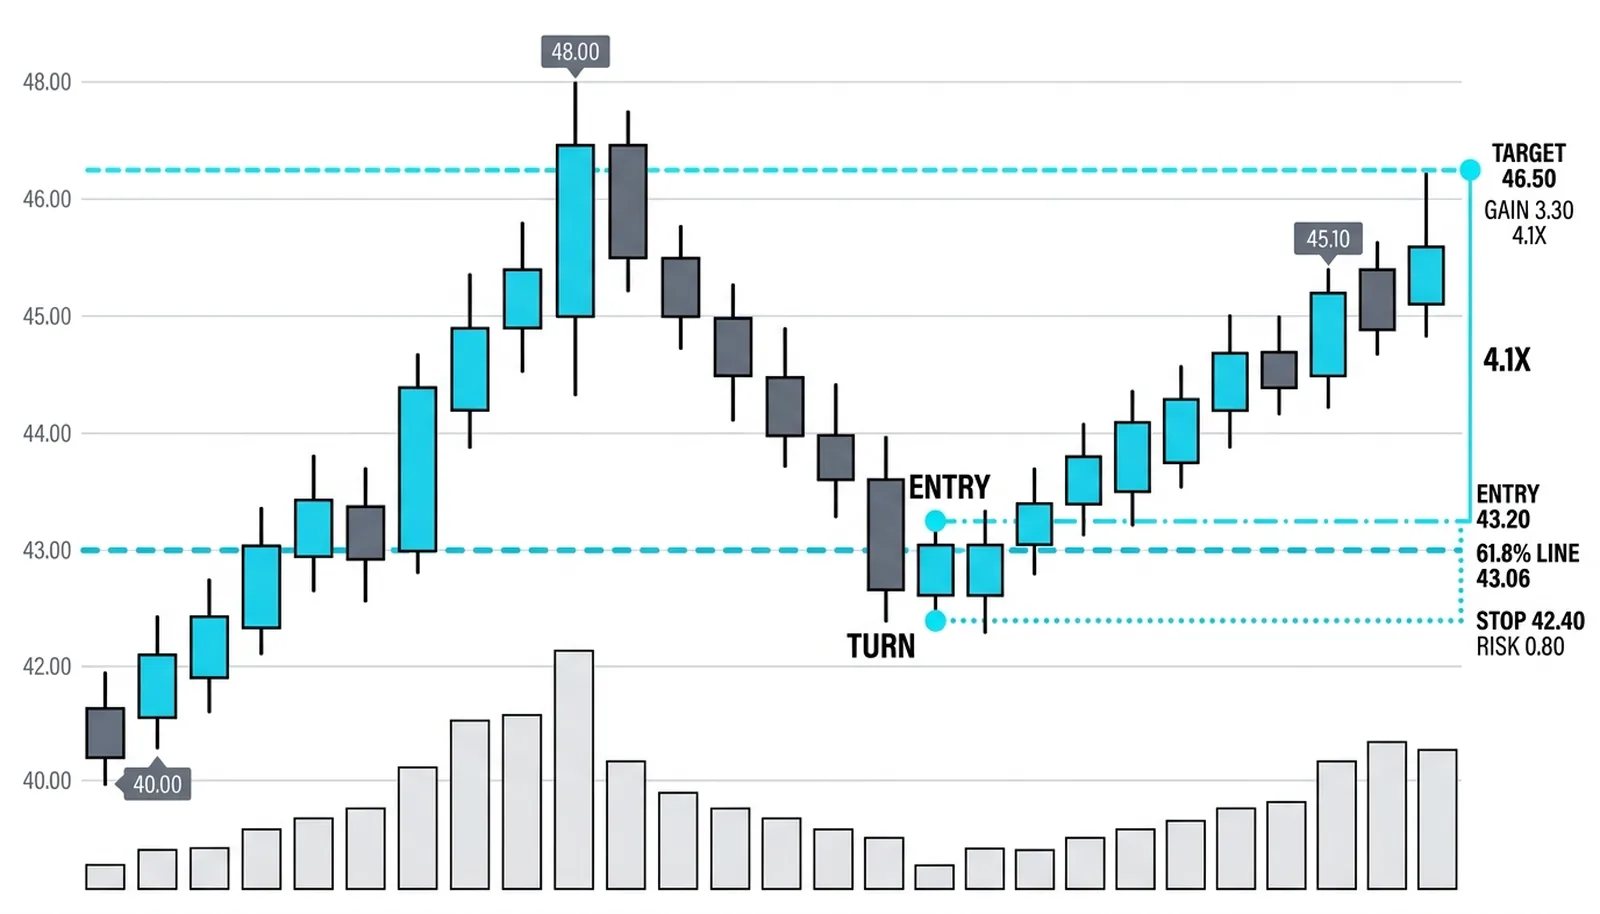
Price pulls back to 43.10, pauses near the correct 61.8 line, and turns. The long is taken at 43.20. The stop goes at 42.40, below the turn with a buffer, risking 0.80. The first target is the 46.50 area, just below the old high, for a gain of 3.30. That is about 4.1 times the risk, and the whole trade existed because the level meant something.
The trader with the wrong anchor watched 45.53 instead. Price sliced through that line without a pause, because nothing was there. That trader either entered early against a falling move or stood aside confused while the real level did its work below. Both outcomes came from a line that never meant anything, drawn by a tool that did exactly what it was told.
| Anchor choice | Level drawn | What price did there | The read |
|---|---|---|---|
| Correct: 40.00 to 48.00 | 61.8% at 43.06 | Pullback stalled at 43.10 and turned | Valid entry zone, trade worked |
| Correct: 40.00 to 48.00 | 78.6% at 41.71 | Never reached; turn came earlier | Deep invalidation reference |
| Wrong: 44.00 to 48.00 | 61.8% at 45.53 | Price sliced through with no pause | Noise, no structural meaning |
| Wrong anchor, trader reaction | Watching 45.53 | Early entry or confused exit | Loss or missed trade from a false line |
Fibonacci Setup Questions, Answered
How do you set up a fibonacci retracement correctly?
Attach it to two marked swing points that both passed the flanking test and the recency rule, on the frame you are trading, running in the direction of the leg being measured. Then verify the ratio set on your platform so you know which line is which. If any of those four checks fails, fix it before reading a single level.
Which swing do you anchor the tool on?
The external swing: the leg that owns the trend on your frame, from the last major turn to the current extreme. Internal swings, the small counter-moves inside that leg, produce levels that look official and mean nothing. When two candidates both look valid, the larger completed leg is almost always the right one.
Does the direction of drawing matter?
Yes, because the retracement projects the counter-move against a specific trending leg. In an uptrend the tool runs low to high; in a downtrend, high to low. Flipping it inverts the percentages, so a 38.2 gets read as a 61.8, and the chart still looks plausible while telling you the wrong thing.
Why do my fibonacci levels not work?
Almost always because of the anchors, not the ratios. The usual culprits are anchoring on noise bars, drawing on a swing that has not completed yet, flipping the direction convention, or stacking every timeframe's levels on one chart until nothing stands out. Reapply the marking rules first; the tool tends to "start working" the moment the anchors become honest.
With the setup discipline in place, the next step is learning what the individual ratios tend to mean in practice, starting with why the 61.8 and 78.6 lines behave differently from the shallow ones.