What Is Fibonacci Confluence
Fibonacci confluence is the overlap of two or more independent measurements on the same price. A retracement line lands where an old high already sits, or where a trendline passes, or where a second swing's level falls, and the overlap matters because two reasons to watch a price are worth more than one. Each measurement draws its own crowd. When both measurements point at the same few cents, the order flow of both crowds stacks at that price, and the level stops being one trader's line and becomes a shared address.

Think of it as a duet where two voices land on the same note, the moment twice as sure as either voice alone. The projection lessons built the toolkit one piece at a time: retracements, extensions, the expansion, each measured from its own anchors and each standing on its own. This section joins them. Confluence is the concept the rest of the section works with, the reason a chart full of single lines gets reduced to a short list of zones worth trading.
Why Two Reasons Beat One
A single fibonacci line is one measurement asking one crowd to care. The market is full of single lines. Most of them mean nothing, and price cuts through them without pausing.
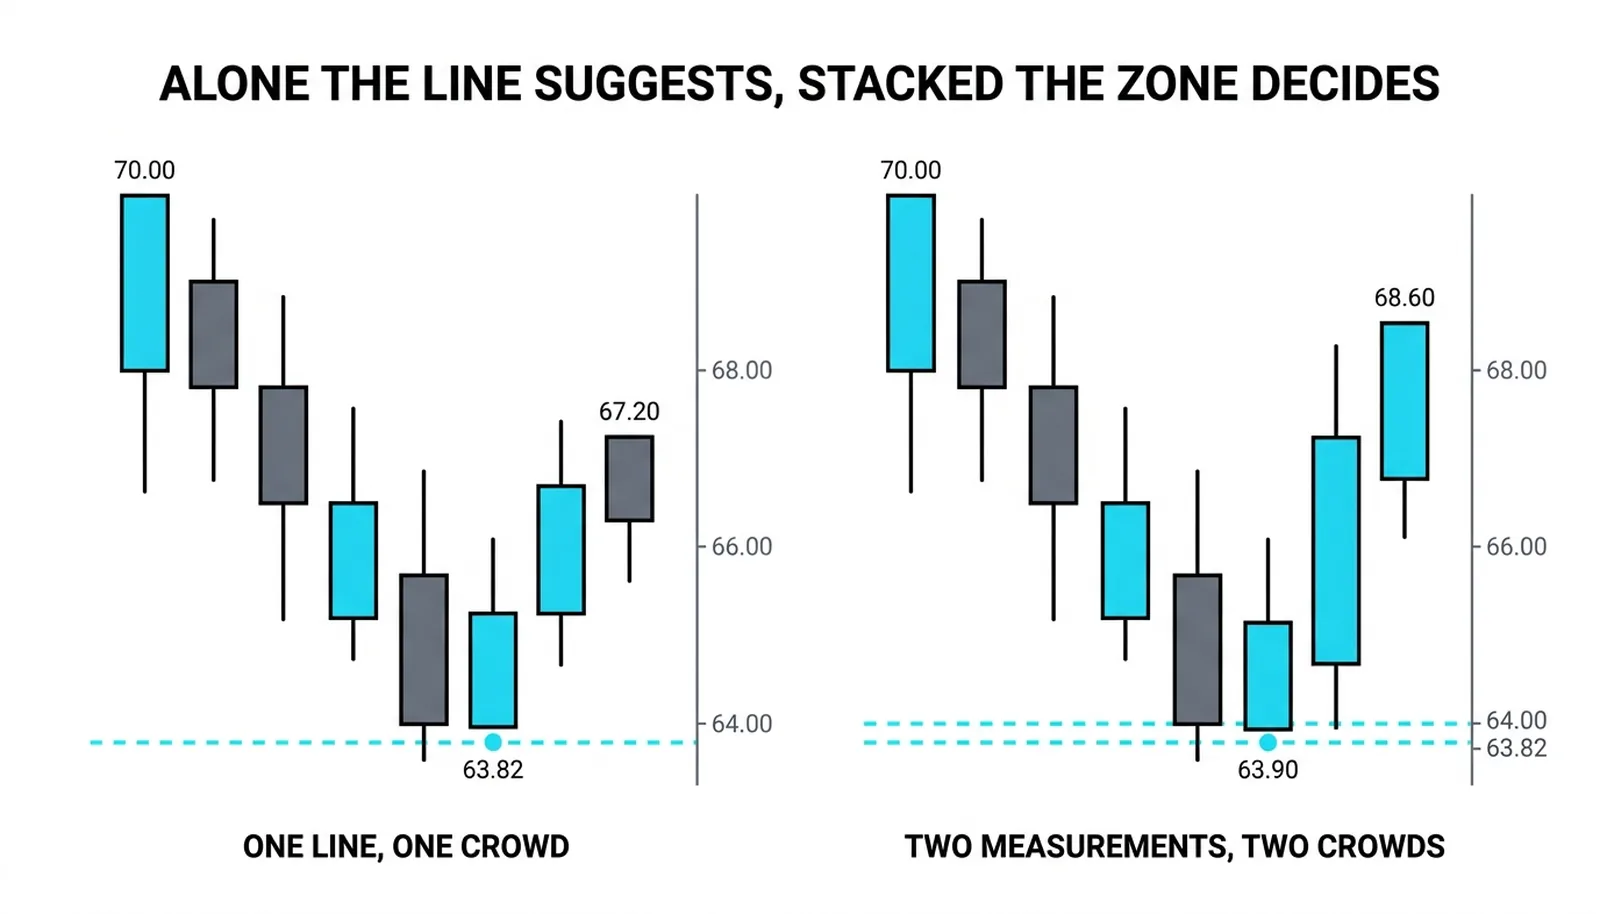
Confluence is the filter. When the 61.8 percent retracement of one leg lands within a few cents of the swing high that ended an older leg, two separate measurements, drawn from two separate anchors, point at the same price. The traders who watch either one now watch the same place.
The price action canon frames every level as a proxy for orders. A line on a chart does nothing by itself; the orders resting near it do the work. Overlapping measurements mean overlapping orders, thicker defense at the zone than either measurement could summon alone.
The cluster method treats this as the heart of the toolkit. The individual lines are candidates. The confluence zone, where two or more measurements cluster, is where candidates become a zone worth an order.
Attention concentrates. That is all confluence promises, and it is enough to build a trade around.
What Counts as Confluence
The cleanest form is the retracement meeting the old extreme. A leg runs, price pulls back, and the 61.8 or 78.6 percent line of the new leg lands on the high or low that ended the previous one. Two anchors, two crowds, one price.
The second form is two fibonacci measurements agreeing with each other. The retracement of the large leg and the retracement of the smaller leg inside it both produce a line within a few cents. Neither crowd knows the other exists. Both act at the same place.
Width decides what qualifies. On a liquid chart, lines within a few ticks of each other count as one zone. Lines spread across a wide band are two separate levels, not a confluence, and treating them as one inflates a weak case.
- A retracement line overlapping a prior swing high or low.
- Two retracement lines from different legs landing within a tight band.
- A retracement meeting an extension projected from an earlier swing.
- Any of the above meeting a structural level from Levels 1-4: support, resistance, a trendline, a supply or demand zone.
The zone is the band from the highest line to the lowest. Trade the band, not any single line inside it.
Trading a Confluence Zone
The entry waits for the turn. Price reaching the zone is the setup; price turning inside the zone is the trigger. Entering before the turn is a bet that attention will become defense, and attention alone does not defend anything.
The stop goes below the far line, not the near one. The reasoning is mechanical: if price trades through the whole zone, both measurements have failed at once. That shared death is the confluence trader's defined risk. A stop tucked under the near line gets clipped by a probe that the far line would have survived.
Here is the honesty, stated plainly. The two lines agreed, but the agreement did not force the turn. It concentrated the crowd. A zone with three overlapping lines still fails whenever the trend pressing against it is stronger than the zone, and the failure of a strong zone is information too. A level that should have held, and did not, says the other side is in control.
Confluence raises attention, never certainty. Size the trade so the shared death is a cost already accepted.
The Overlap at 63.82
All numbers here are invented and round, a hypothetical illustration of the mechanics.
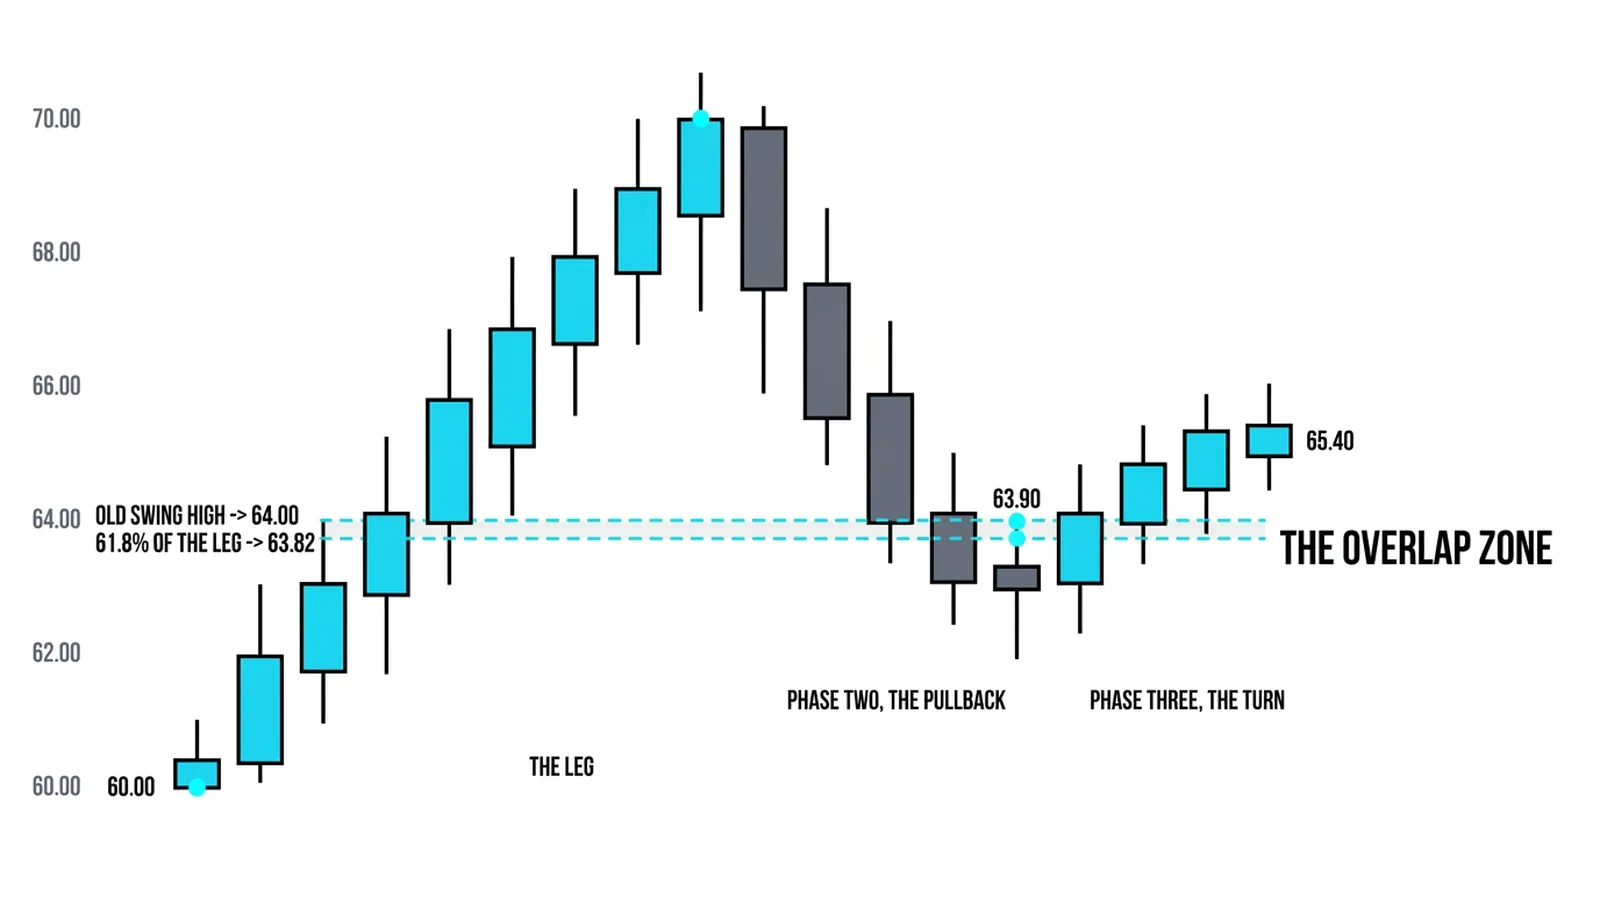
A leg runs 10.00 points, from 60.00 up to 70.00. Price pulls back. The 61.8 percent retracement of that leg sits at 63.82. An older swing high from a previous leg stands at 64.00.
The two overlap in a zone from 63.82 to 64.00, eighteen cents wide. Price pulls back to 63.90, inside the zone, and turns.
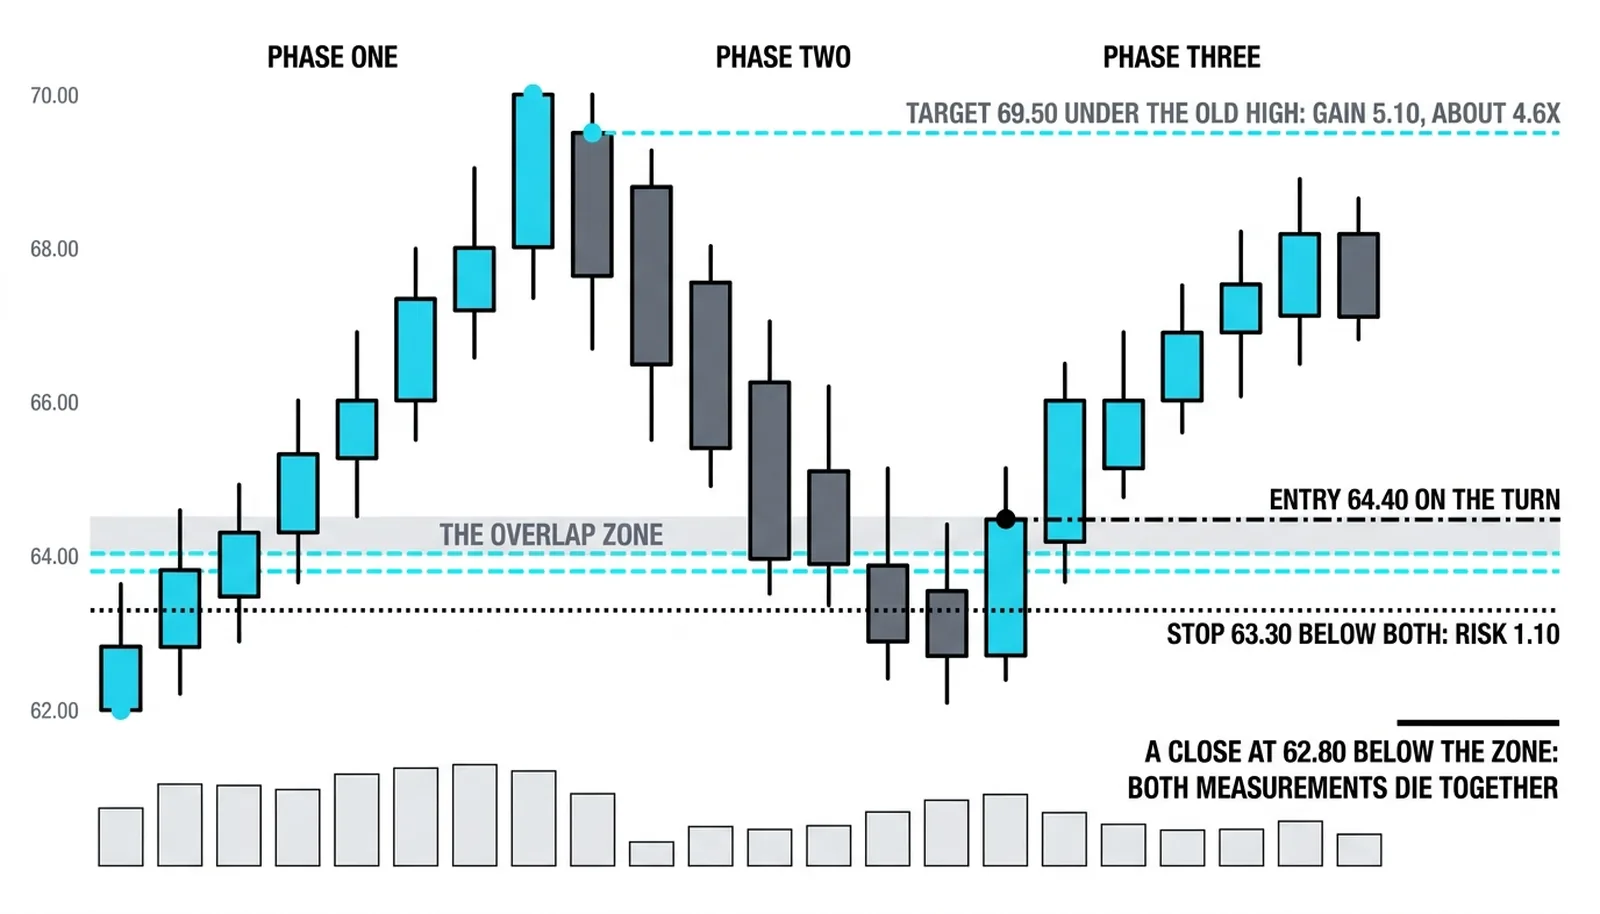
The long is taken at 64.40 on the turn. The stop sits at 63.30, below both measurements, risking 1.10. The first target is 69.50, just under the old high at 70.00, a gain of 5.10. That is about 4.6 times the risk.
The failed version: price closes at 62.80, below the whole zone. Both measurements die at once. The stop at 63.30 took the exit before the close confirmed it, and the loss stayed at the planned 1.10 instead of growing into an argument.
| Measurement | Its Own Line | What It Adds to the Zone | The Crowd It Brings |
|---|---|---|---|
| 61.8 percent retracement of the 60.00 to 70.00 leg | 63.82 | The lower boundary of the zone | Pullback buyers watching the golden ratio |
| Older swing high | 64.00 | The upper boundary of the zone | Breakout traders and prior sellers defending |
| The combined zone | 63.82 to 64.00 | Eighteen cents of stacked attention | Both crowds acting at the same price |
| The shared failure level | Below 63.30 | The defined risk of the trade | Both crowds exiting together |
Confluence Questions, Answered
What is fibonacci confluence?
Fibonacci confluence is the overlap of two or more independent measurements on the same price, such as a retracement line landing on an old swing high or on a second swing's level. The overlap stacks the order flow of every crowd watching either measurement into one narrow zone.
Why is confluence important in trading?
Confluence matters because it filters the chart. Single lines are everywhere and most mean nothing; a zone where two or more independent measurements agree is where orders genuinely cluster, which gives the level a real defense and gives the trader a defined place to be wrong.
How many confluences make a strong zone?
Two independent measurements are enough to qualify a zone, and three make it strong. Beyond three, the additions matter less than the spacing: the lines still need to sit within a tight band, because ten lines spread across a wide range are ten separate levels, not one zone.
Does confluence guarantee a bounce?
No. Confluence concentrates attention, and attention often produces a turn, but a strong opposing trend can drive straight through the best zone on the chart. The guarantee is the defined risk: the stop below the far line caps the loss when both measurements fail together.
Next in the section: stacking levels across swings, where the measurements stop coming from two anchors and start coming from three or four, and the zones get narrower as the evidence piles up.