Projecting Price Targets With Extensions
Projecting price targets with extensions needs no different method for any chart: traders run the same five steps on every timeframe, confirm the completed swing, anchor the tool, verify the lines against structure, wait for the reaction, and take the targets the projection offers, changing nothing but the chart the work is done on. The expansion lesson completed the projection toolkit by measuring the next impulse from where the pullback ended. This lesson is the workflow that runs those measurements everywhere, and it is honest about what changes when the clock changes.

Think of one ruler carried from room to room: the doorway and the hall are measured by the same tool, only the object changing. The tool does not get recalibrated because the room got smaller. The chart does not change the procedure either. What the chart changes is the quality of what the procedure finds, and that difference is where traders get paid or get hurt.
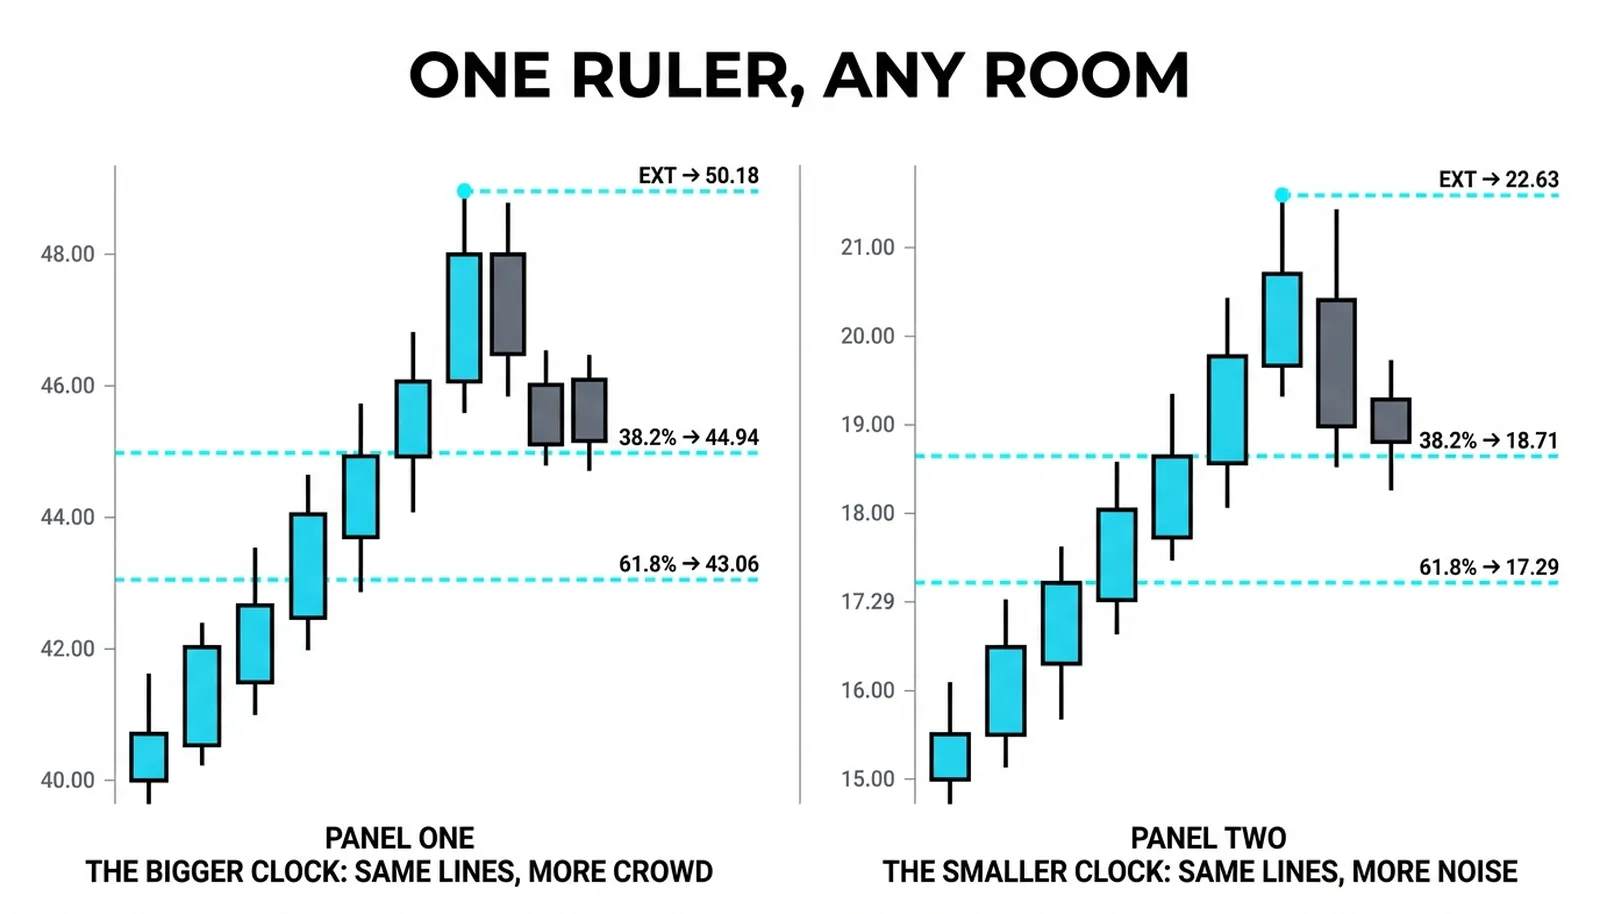
The Procedure Never Changes
The five steps are identical on a weekly chart and a one-minute chart. First, confirm the completed swing: the impulse leg is finished, the pullback has started, and the swing high and low are unambiguous. Second, anchor the tool low to high in an uptrend, high to low in a downtrend. Third, sanity-check the lines against structure. Fourth, wait for the reaction at the line. Fifth, take the targets the projection offers.
The sanity check deserves its own paragraph because it is the step traders skip. A retracement line that lands on an old support zone, a prior consolidation, or a round number is a line other traders can see too. A line floating in empty space is a private calculation. The tool draws both with equal confidence; only one of them has a crowd behind it.
The reaction comes before the target, always. The sequence is: price reaches the line, price shows a turn at the line, the entry happens on the turn, and only then do the extension targets above matter. Entering at the line before the turn is anticipation, and anticipation is how traders collect losing trades at mathematically beautiful levels. The price action canon holds across the clocks: the method is the same, the timeframe only changes the noise, and the trader who tightens the stop without tightening the discipline pays for it.
The cluster method reads the same swings on every chart it opens, the measurements unchanged, the reliability graded by the timeframe the swing sits on. That grading belongs to a later lesson on stacking levels across timeframes.
What the Timeframe Changes
Three things change when the clock changes. The procedure is not one of them.
First, the crowd. Higher-timeframe levels are seen by more traders and produce heavier reactions. A 61.8 percent line on the daily chart sits on the screens of funds, swing traders, and algorithms all at once, and the order flow that gathers there is real. The same ratio on a five-minute chart is visible to a much smaller audience, and the reaction it produces is thinner. The ratio is identical. The audience is not.
Second, the noise. Smaller timeframes produce more false turns, more wicks through lines, and more pullbacks that look complete and then continue. The confirmation rules from the earlier lessons do not get relaxed on a small chart; they get applied more strictly. A candle that closes back above the line, a clear rejection, a turn that holds for more than one bar: the smaller the clock, the more of that evidence the trader should demand before acting.
Third, the agreement rule. A level on the execution timeframe earns more trust when it agrees with a level on the higher one. When the five-minute retracement line lands inside a daily demand zone, the two charts are voting together, and the reaction tends to be stronger than either chart would produce alone. The full method for stacking those alignments belongs to a later lesson. The principle belongs here: agreement across timeframes raises the grade of the level.
Sizing the Small-Timeframe Trade
Here is the blunt truth: smaller clocks pay smaller multiples for the same work. A procedure that returns four times the risk on a daily chart may return less than half that on a five-minute chart, because the targets are closer, the moves are shorter, and the noise eats a share of every edge.
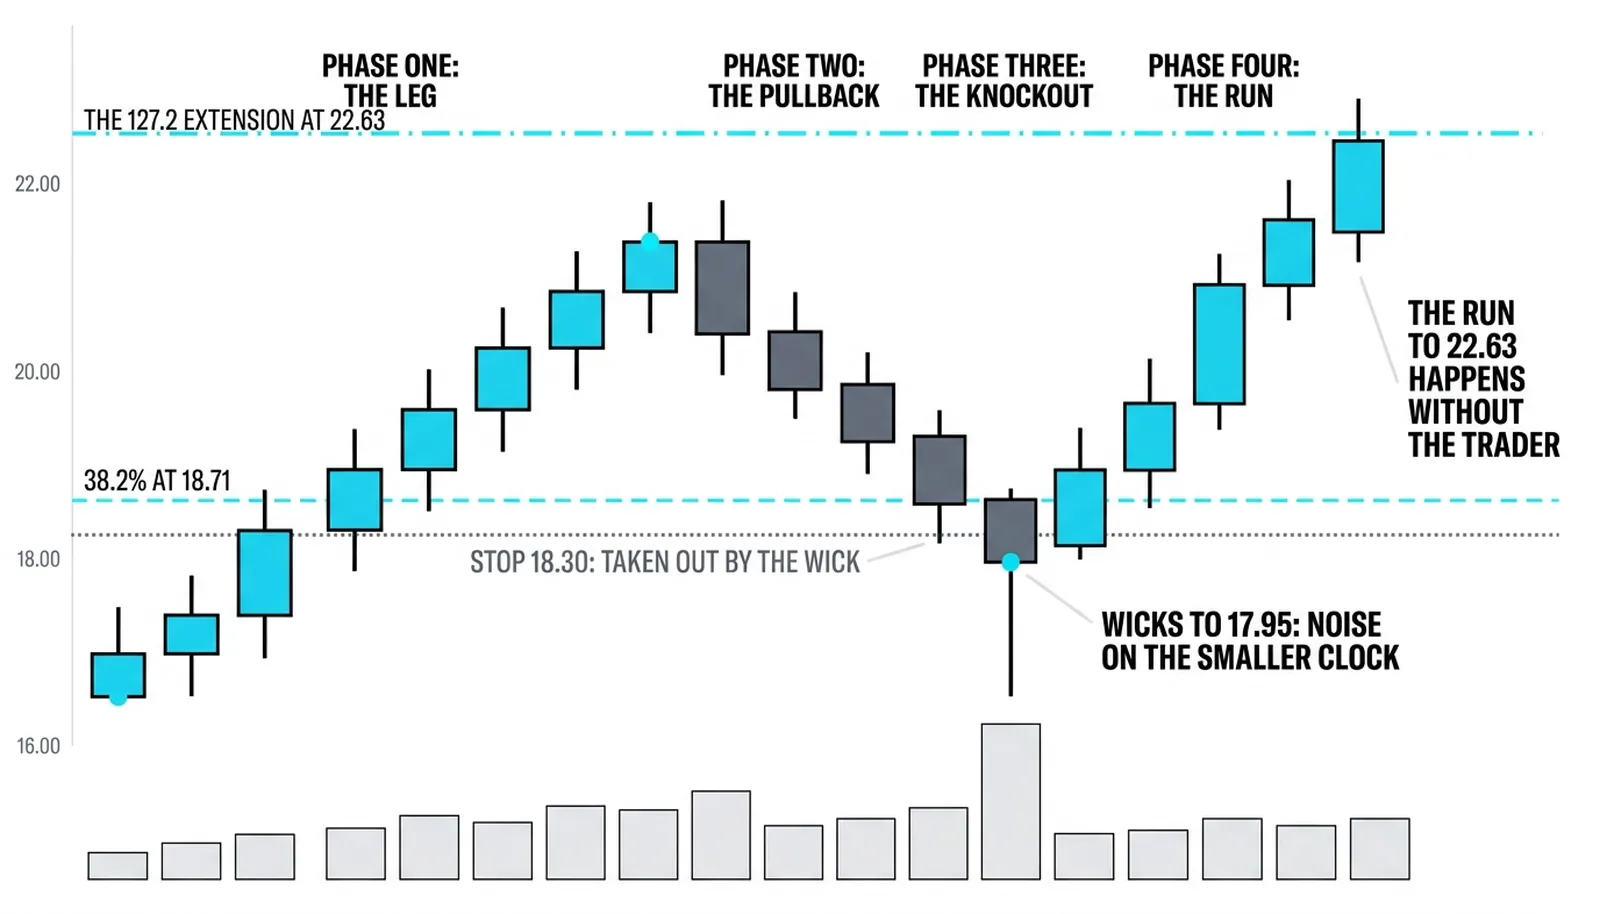
The stop is the pressure point. On a small timeframe, price wicks through clean levels routinely, and a stop placed just under the line gets clipped by noise that a daily chart would never print. The trader then watches the projected target hit without being in the trade. The fix is not a tighter stop. The fix is one of two choices: size the stop to the structure, giving the trade room to survive the wicks, or size the position down so a wider stop costs the same money. The projection does not care which one the trader chooses. The account does.
The honest expectation, stated plainly: run the same five steps on a small chart, accept that the multiple shrinks, and treat the smaller multiple as the price of more frequent opportunities. Traders who demand daily-chart payoffs from five-minute charts oversize, override stops, and donate the difference.
The Test at 18.71
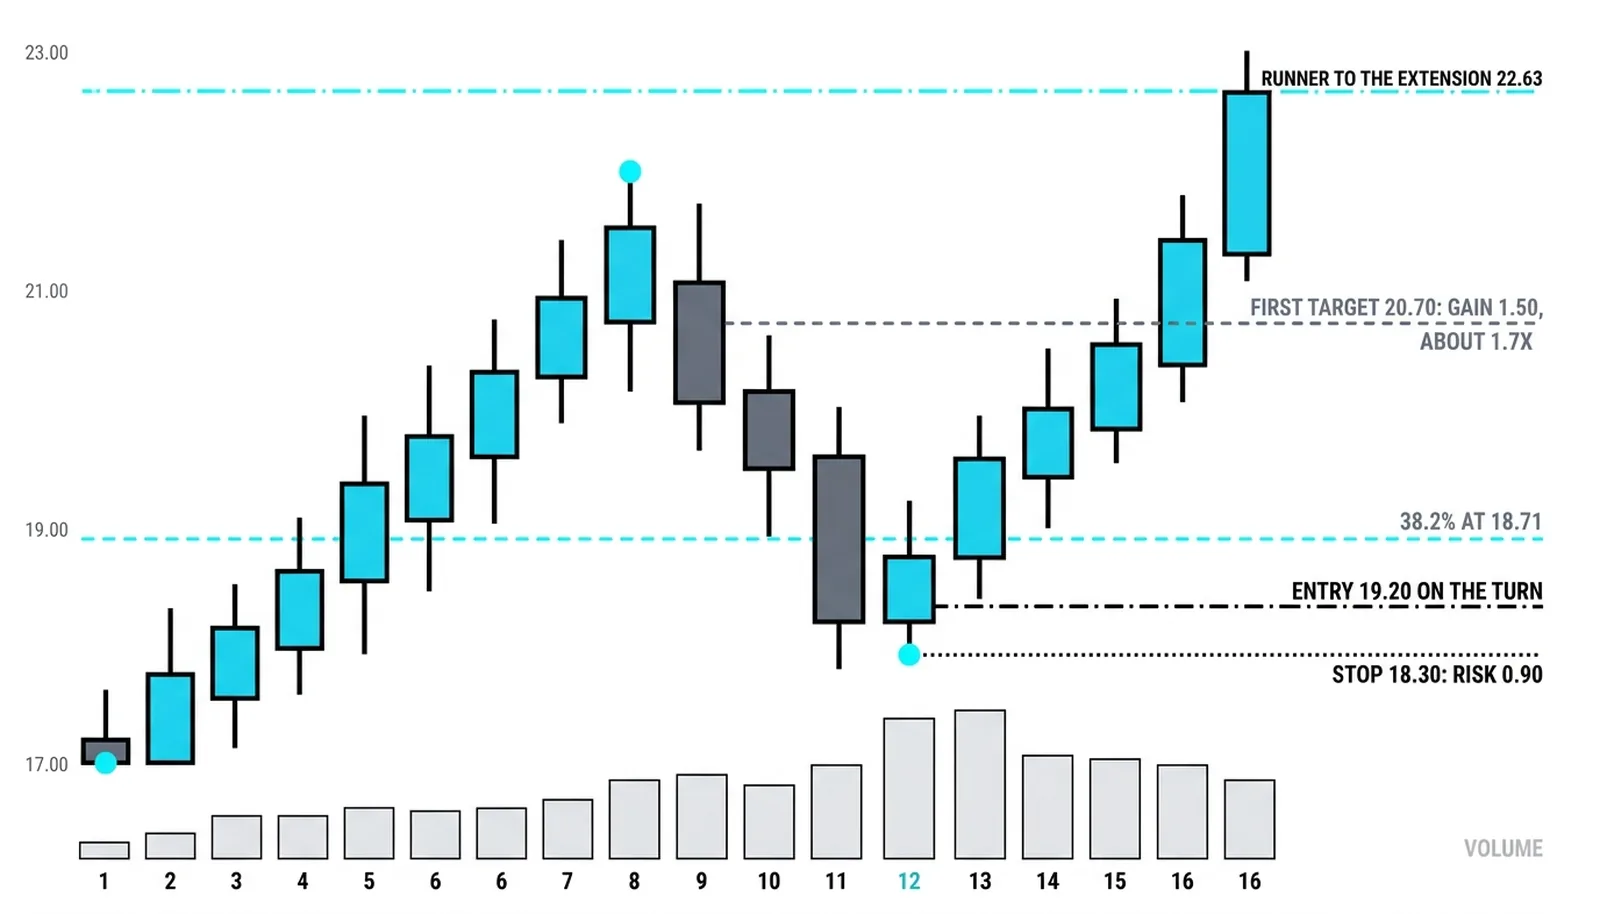
A hypothetical illustration with round numbers. On a smaller-timeframe chart, a leg runs 6.00 points from 15.00 to 21.00. The tool anchors low to high and draws the retracement grid: the 38.2 percent line sits at 18.71, the 50 percent line at 18.00, and the 127.2 percent extension, the projection target, at 22.63.
Price pulls back to 18.80, holds above the 38.2 line, and turns. The reaction is confirmed. The long is taken at 19.20 on the turn, with the stop at 18.30, below the line's area, risking 0.90 per unit. The first target sits at 20.70, just under the old high, a gain of 1.50, about 1.7 times the risk. The runner is held for the extension at 22.63.
Now the honest version. On the failed chart, price wicks to 17.95, straight through the 38.2 line, before turning. The stop at 18.30 is taken out by noise. The run to 22.63 happens anyway, without the trader. Nothing about the projection failed. The sizing failed: the stop was placed where a daily chart would be safe and a small chart is not. The lesson is the sizing rule from the previous section, paid for in a missed trade.
| Timeframe Trait | What It Changes | The Risk | The Response |
|---|---|---|---|
| Higher timeframe | Bigger crowd at each level, heavier reactions | Slower signals, wider stops in points | Standard procedure, standard sizing |
| Lower timeframe | More noise, more false turns at the lines | Stops clipped by wicks, smaller multiples | Stricter confirmation, smaller position |
| Timeframes in agreement | Level earns more trust, stronger reaction | Overconfidence in a stacked setup | Take the trade, keep the same risk rules |
| Timeframes in conflict | Small-chart signal fights the bigger chart | Projection dies at the higher level | Skip or reduce; let the higher chart rule |
Projection Questions, Answered
How do you project price targets with extensions?
Run the same five steps on any chart: confirm the completed swing, anchor the tool low to high in an uptrend, check the lines against visible structure, wait for the reaction at the line, and take the targets the projection offers. The extension levels, measured from where the pullback ended, supply the targets beyond the old high or low.
Do Fibonacci levels work on all timeframes?
Yes, the ratios plot identically on every timeframe, but their reliability changes. Higher-timeframe levels attract more order flow and produce stronger reactions; lower-timeframe levels are noisier and need stricter confirmation before they are traded.
Which timeframe is best for Fibonacci retracements?
The higher timeframes produce the most reliable reactions because the most traders are watching them, while the lower timeframes offer more frequent setups with smaller payoffs. Most practitioners read the higher chart for the levels that matter and drop to a smaller chart only for timing the entry.
How do you place a stop on a lower timeframe trade?
Place the stop beyond the structure rather than merely beyond the line, because small timeframes wick through clean levels regularly. If that wider stop risks too much money, cut the position size until the risk fits; never solve the problem by tightening the stop into the noise.
The projection toolkit is now complete: the measurement from the impulse, the expansion from the pullback's end, and the workflow that runs both on any chart. With the projection toolkit complete, the next section asks what happens when measurements stack: fibonacci confluence, the overlap of two lines on one price, and why the overlap deserves a bigger fraction.