What Indicators Are and What They Measure
Indicators are calculations applied to past price and volume data, nothing more. They take the numbers the chart already gave you - closes, highs, lows, volumes - and run a formula over them to answer a specific question. Moving averages, oscillators, momentum and volatility measures all belong to this family, and every one of them is a lens over the same underlying chart, never new information by itself.
Think of indicators as lenses clipped over the same chart: the price never changes, but each lens answers a different question about it. That framing matters because it keeps the hierarchy straight. Levels 1 through 4 taught you to read the raw chart - structure, levels, supply and demand. Indicators sit on top of that reading. They never replace it.
What an Indicator Actually Is
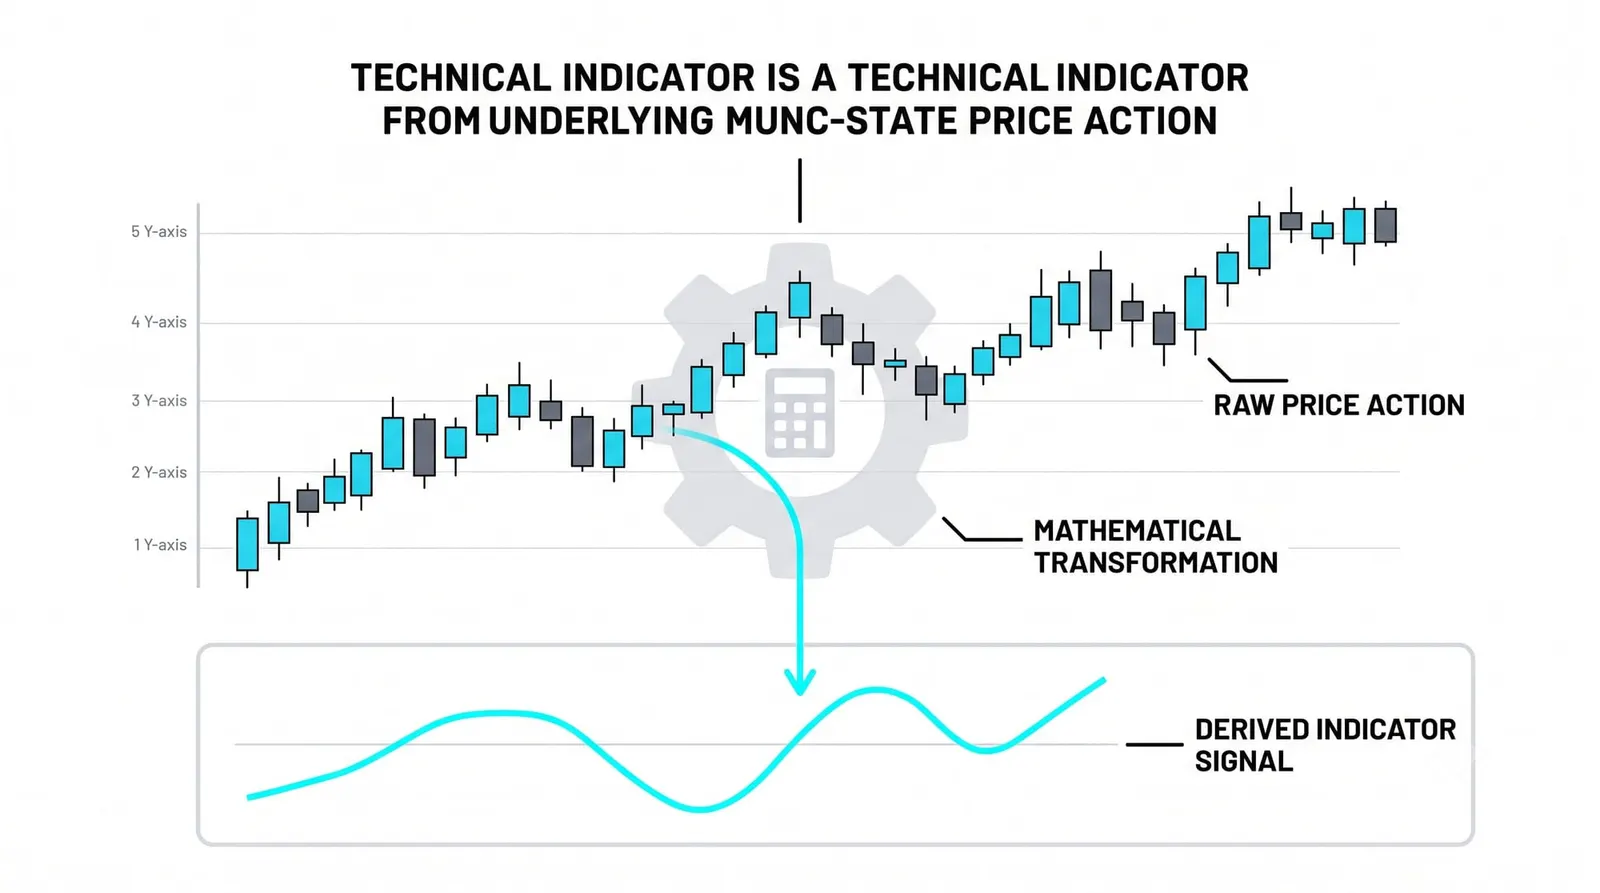
Strip any indicator down and you find a formula. A moving average adds up the last twenty closes and divides by twenty. An oscillator compares where price closed against where it traded over some window. A volatility measure looks at the size of recent ranges. Every input comes from the chart you already have.
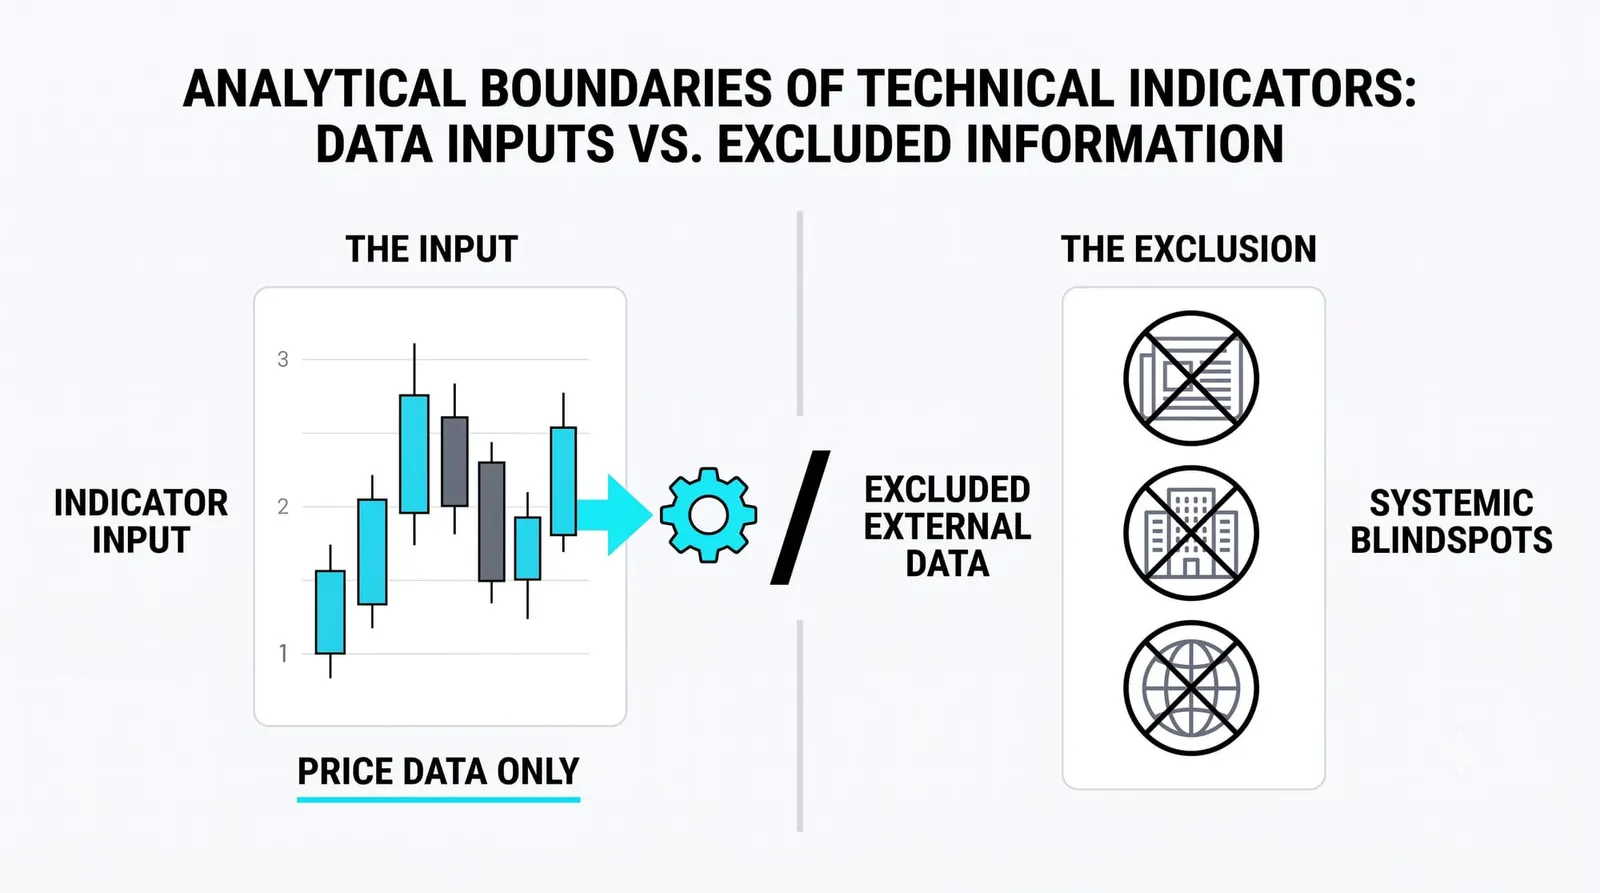
That has a consequence most beginners miss. An indicator cannot know anything the chart does not know. It has no access to earnings, central banks, or next week's news. It only rearranges past prices into a different shape.
The lag is built into the arithmetic. Because the formula waits for closes to happen before it can compute, the output always describes what already occurred. A moving average turns after price turns. A momentum reading cools after the move cools. This is a design feature, and accepting it early saves you from demanding something the tool was never built to give.
Some tools use shorter windows and react faster, but faster means noisier, never more prophetic. Shortening the period changes the trade-off between speed and smoothness. It does not change the direction of causation.
The Questions They Answer
Each indicator family exists because someone wanted one question answered cleanly. Learn the question first, and the tool makes sense on its own.
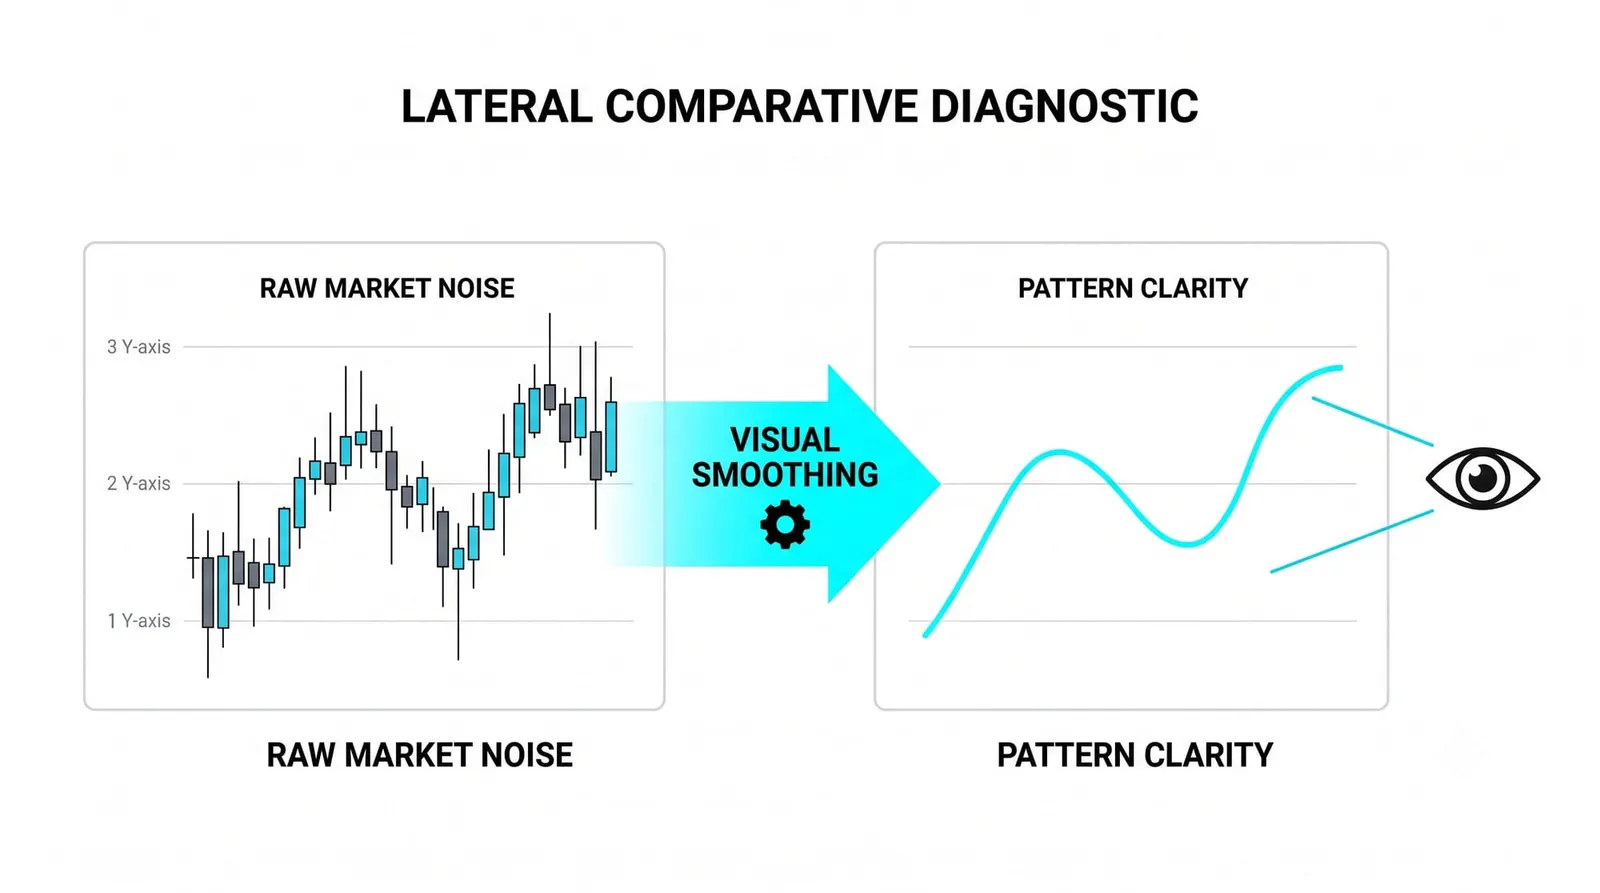
Direction. Is the average price rising or falling? Moving averages and trend-following tools answer this. They smooth the noise so the underlying drift stands out.
Momentum. Is the move speeding up or fading? Oscillators measure the rate of change, telling you whether buyers are pushing harder or running out of push.
Volatility. How wide are the swings? Volatility measures quantify the size of recent movement, which shapes position sizing and stop placement more than most beginners realize.
Participation. How much volume backs the move? Volume tools ask whether a crowd or a handful of orders is driving price.
Four questions, four families. This level walks through them one by one, starting with the moving average family in the next lesson, because trend tools are the foundation everything else builds on.
What Indicators Cannot Do
Start with the obvious one that still trips people up: indicators cannot see the future. A formula over past closes has no mechanism for knowing tomorrow. When an indicator "predicted" a move, the move was already underway and the formula simply reflected it.
They also cannot contain information the chart lacks. If the chart shows a quiet sideways drift, no setting on any oscillator will extract a hidden trend from it. The formula can only reshuffle what it is fed.
The deeper problem is regime. Markets alternate between trending stretches and ranging stretches, and the same setting behaves completely differently in each. A moving average crossover works beautifully while price trends for months. During a choppy range, that same crossover whipsaws you in and out for a string of small losses. The tool did not break. The environment changed, and the tool has no way to detect that.
This is why traders who collect indicators hoping one will finally be "right" end up confused. The search assumes a perfect setting exists. It does not. Every setting is a bet about what kind of market you are in, and the chart itself - the raw reading from Levels 1 through 4 - is what tells you which regime you face.
Blunt truth: an indicator is only as good as the trader's read of the environment it runs in.
How to Use Them Without Drowning
Pick one or two indicators per job, chosen for the question you are actually asking. If your question is direction, a moving average answers it. Adding three more trend tools does not add information - it adds the same answer in three fonts.
Redundancy is the common failure. Five indicators that all measure momentum will agree with each other constantly, and that agreement feels like confirmation while being nothing of the sort. Real confirmation comes from different families: one tool for direction, one for momentum, perhaps one for volatility. Each covers the others' blind spot.
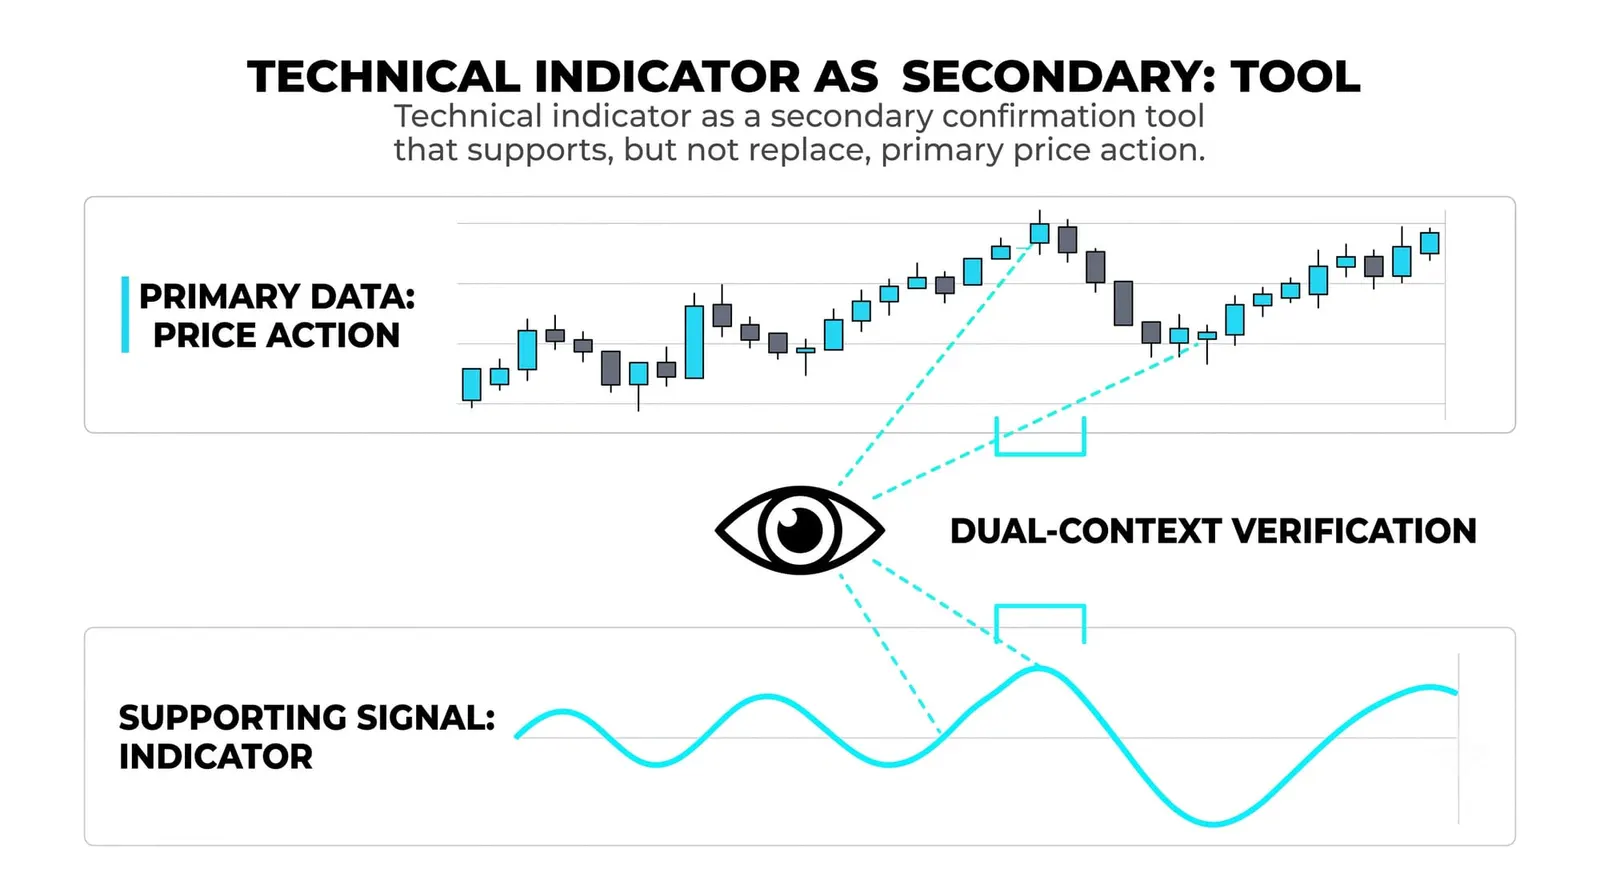
Treat indicator readings as evidence to stack against the chart, never as signals to obey blindly. The workflow runs in this order: read the structure first, locate your levels, then ask the indicator whether its picture agrees. When the chart says uptrend and the oscillator says momentum fading, that disagreement is itself useful information. When both agree, you have a stronger case. When the indicator contradicts a clean structural read, the structure wins.
Keep the chart readable too. If you cannot see the candles under your tools, you have too many tools.
One Chart, Three Lenses
Here is a hypothetical with round numbers. A stock climbs from 50 to 60 over two months, with a pullback to 55 in the middle. Same chart, three lenses.
Lens one, a moving average. The average rises steadily through the whole period. The pullback to 55 barely dents it. The direction lens says: up, and still up.
Lens two, a momentum oscillator. During the push from 55 back toward 60, the oscillator prints a lower peak than it did during the first leg from 50. The momentum lens says: the move continues, but the thrust behind it is fading.
Lens three, a volatility measure. Daily ranges stay narrow and consistent throughout, including during the pullback. The volatility lens says: this climb is orderly, with no sign of panic or erratic behavior.
Same price history, three different statements. One says the trend is intact. One says the energy behind it is cooling. One says the ride is calm. None of them tells you what happens next - but together they describe the situation far more precisely than any one of them alone, and far more precisely than staring at raw candles hoping for a feeling.
That is the correct mental model for everything in this level. Each family takes its turn under the lens, and each gets judged on the question it was built to answer.
| Family | Question It Answers | Its Weak Spot |
|---|---|---|
| Trend-following tools | Which direction is price drifting? | Whipsaws badly in sideways ranges |
| Momentum oscillators | Is the move gaining or losing force? | Stays pinned at extremes during strong trends |
| Volatility measures | How wide are the swings? | Describes conditions, gives no direction |
| Volume tools | How much participation backs the move? | Data quality varies across markets and sessions |
Indicators, Answered
Do indicators work?
They work at the job they were built for: summarizing past price behavior into a readable answer. A moving average genuinely tells you the direction of the average. An oscillator genuinely tells you whether momentum is building or fading. What they do not do is forecast. Used as descriptions that inform your read of the chart, they earn their place. Used as automatic buy and sell commands, they fail in whatever regime exposes their weak spot.
Are indicators lagging or leading?
They are lagging by construction. Every formula consumes past closes, highs, lows, or volumes, so the output always trails the event. Some tools get labeled "leading" because they sit at extremes before price turns, but that is a faster reaction, not foresight. Plan around the lag instead of shopping for a tool without one.
How many indicators should you use?
One or two per question, and rarely more than three or four total on a chart. Each one should answer a different question - direction, momentum, volatility, participation. More than that and you are stacking duplicates that agree with each other and tell you nothing new.
Do professional traders use indicators?
Many do, mostly as context and discipline aids rather than triggers. A desk trader might watch a moving average to frame trend or a volatility measure to size positions, while the actual decision comes from structure, flows, and risk limits. The difference from beginners is order of operations: professionals read the market first and consult the indicator second.
Next lesson starts the family tour with the moving averages - how each type is computed, why the math differs, and what each version trades away to get its answer.