Price Action vs Indicators
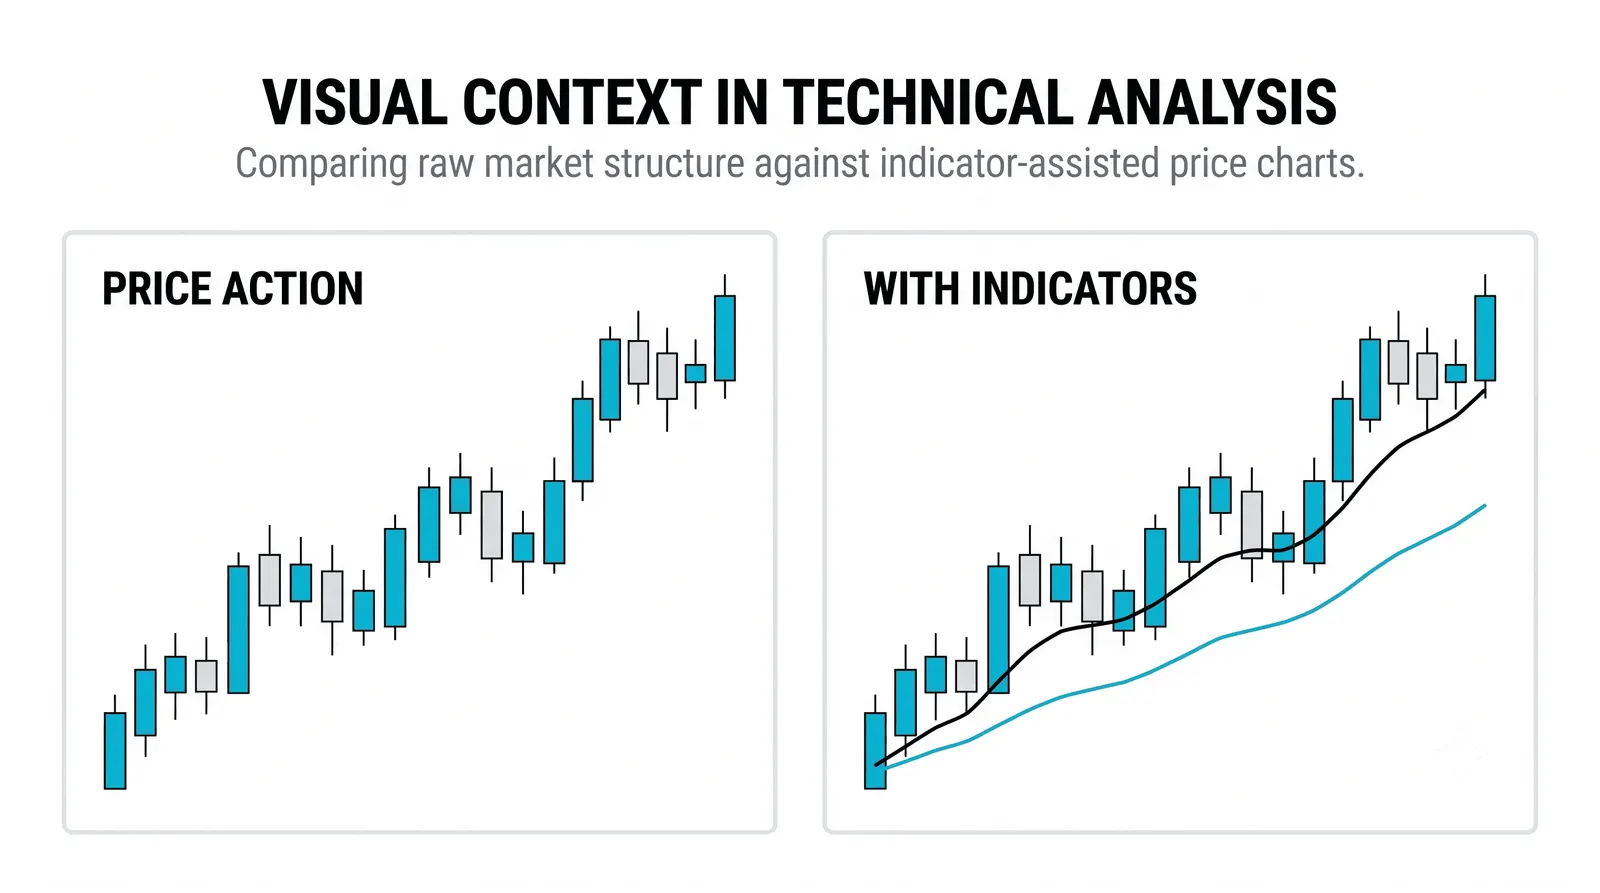
Price action vs indicators is not a fight you need to pick a side in. They are two ways of reading the same price. Price action reads the raw record, the candles, swings, and levels as they printed. Indicators read a transformed summary of that same record, smoothed or averaged into a line. Once you see that both describe one market, the debate mostly dissolves.

What Price Action Actually Is
Price action is the raw chart. Open, high, low, close. The swing highs and lows, the levels where price stalled or reversed, the shape of individual candles.
When you read price action, you describe what happened in plain language. Price rallied to 100, got rejected, and closed near its low. That is a complete statement. No formula sits between you and the data.
We covered this in depth in the price action lesson. The short version: the chart is a record of transactions, and reading it means interpreting that record directly.
What Indicators Actually Are
An indicator is a calculation applied to price (and sometimes volume). A moving average smooths the last N closes into one line. An oscillator like RSI compresses recent gains and losses into a number between 0 and 100. The indicator families (trend, momentum, volatility, volume) are mapped in the four categories of indicators.
Nothing is added from outside. Every indicator is built from the same candles you already see. Think of it like a summary of a book: useful, faster to read, but it is still derived from the book, and something is always left out.
This is why indicators belong to technical analysis as tools, not as oracles. They reorganize information. They do not create it. The full toolbox, and how indicators sit inside technical analysis, is its own lesson.
The Lag Problem Nobody Can Fix
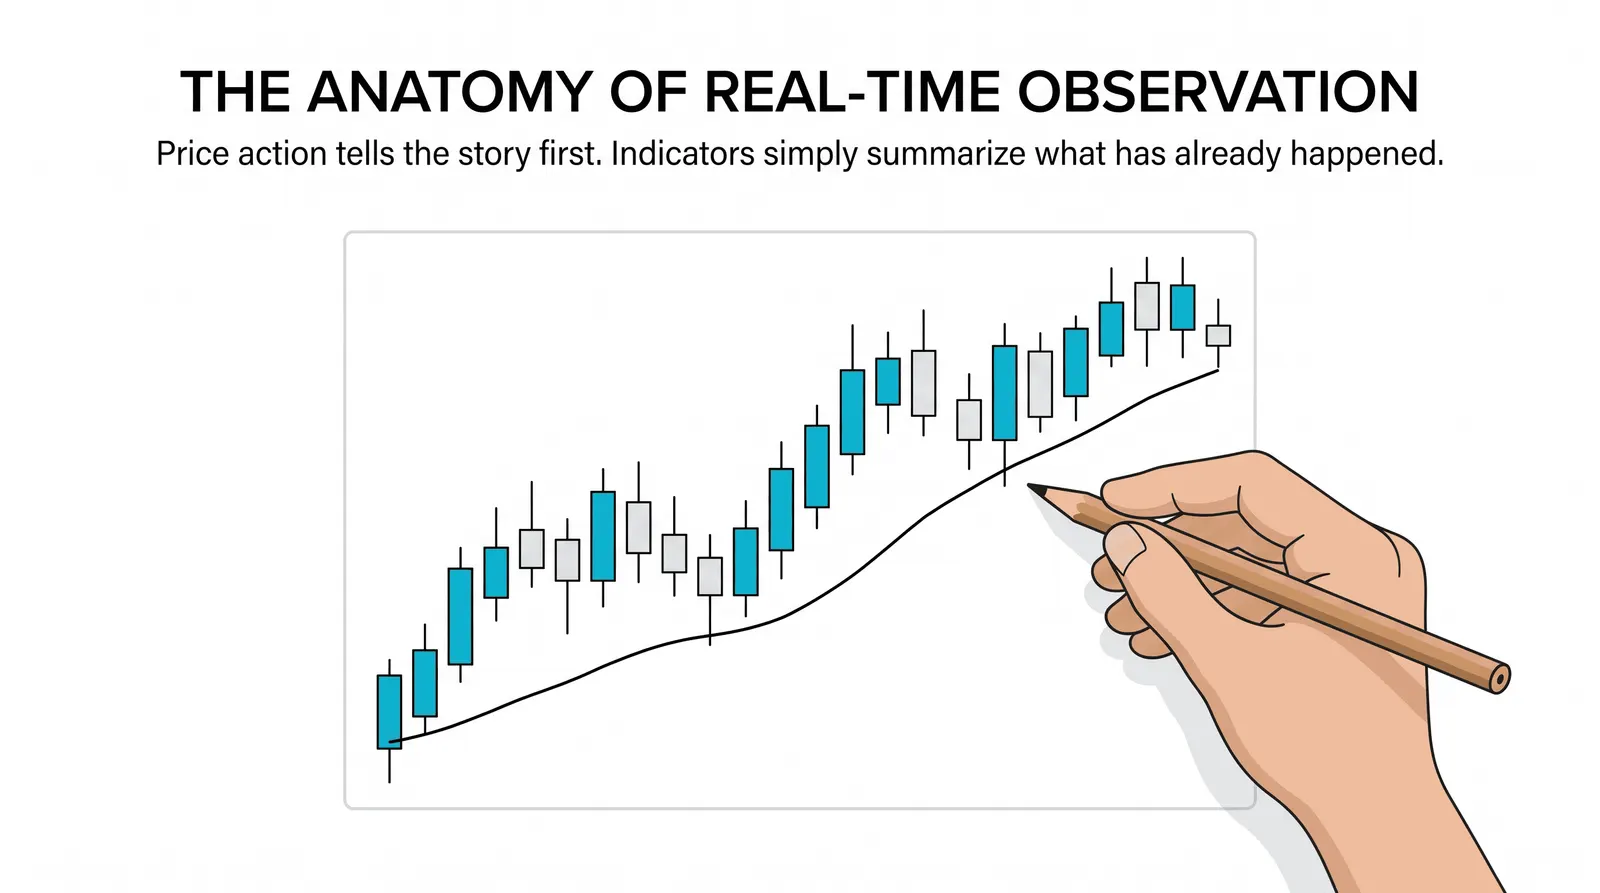
Every indicator is computed from prices that already happened. A 20-period moving average needs 20 closes. RSI needs a history of gains and losses. By construction, the indicator speaks after the fact.
This means an indicator can confirm, but it can never lead. When a moving average crosses, price already moved. When RSI hits 70, the rally already happened.
Lag is not a flaw you can tune away with settings. A shorter period reacts faster but whipsaws more. A longer period smooths better but arrives later. You are choosing which kind of late you prefer.
Price action has lag too, in a sense, since a candle only exists once it prints. But it carries no extra delay beyond that. It is the fastest complete information available on the chart.
Why Raw Price Is Easier to Defend
Raw price carries no assumptions. A candle at 100 is a fact. You can describe it in a sentence anyone can check: buyers pushed to 102, sellers forced a close at 99.
An indicator reading embeds choices someone made for you. RSI uses 14 periods because the indicator's original design picked 14. A 200-day average matters partly because many people watch it. These are conventions, not laws.
When a trade fails, a price action read is easy to audit. You pointed at a level, the level broke, you were wrong. With indicators, you can always blame the settings, and that makes honest review harder. Bluntly: indicators give you more places to hide from your own mistakes.
The Honest Verdict: Different Jobs
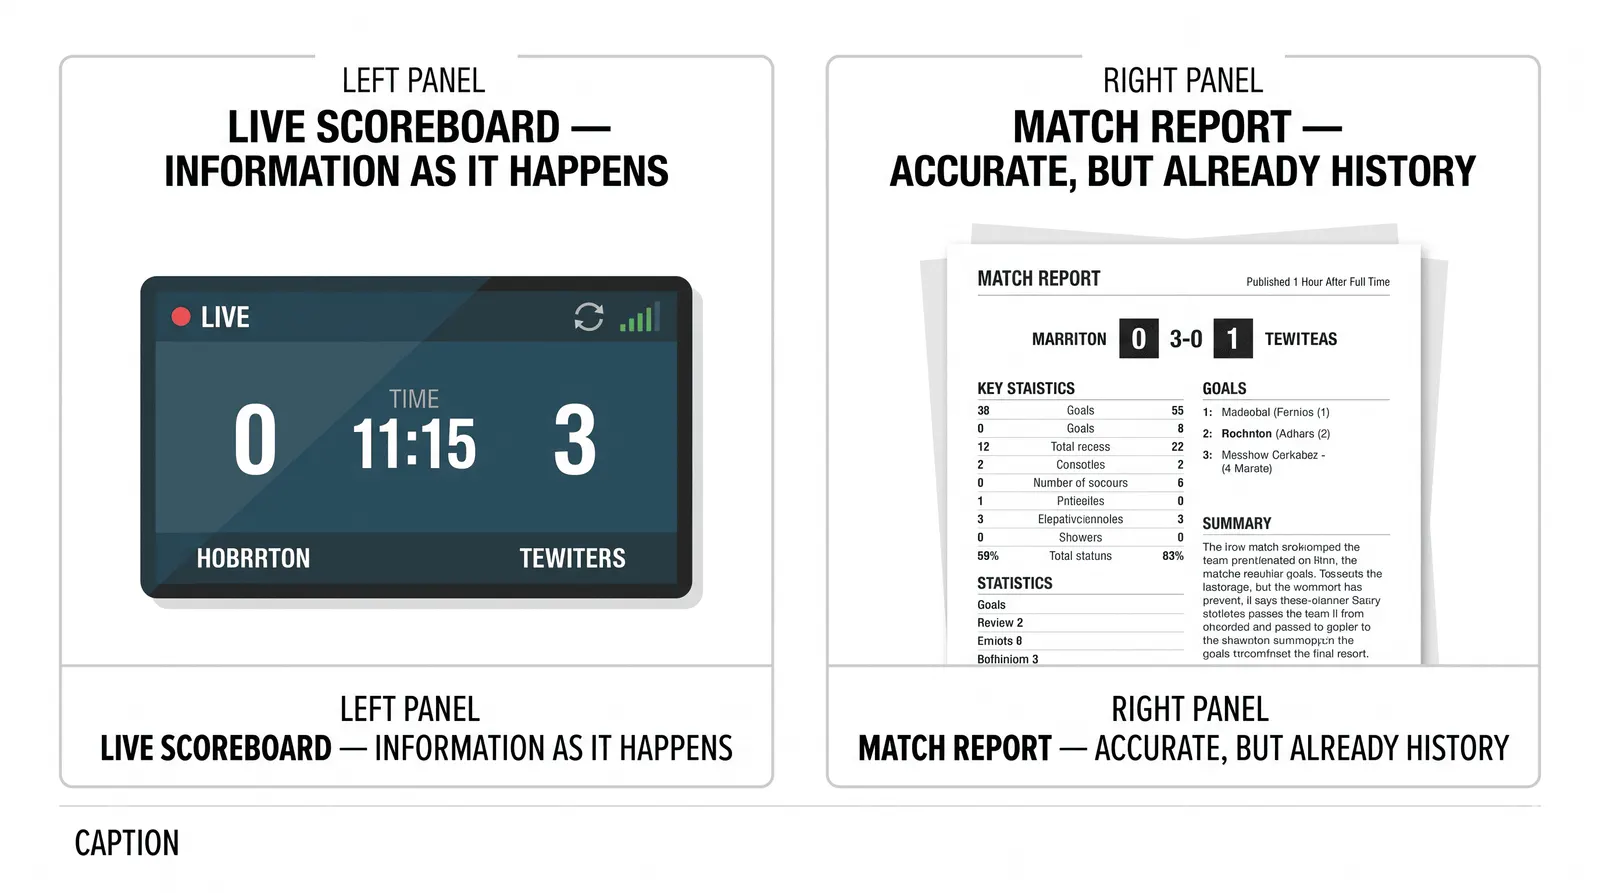
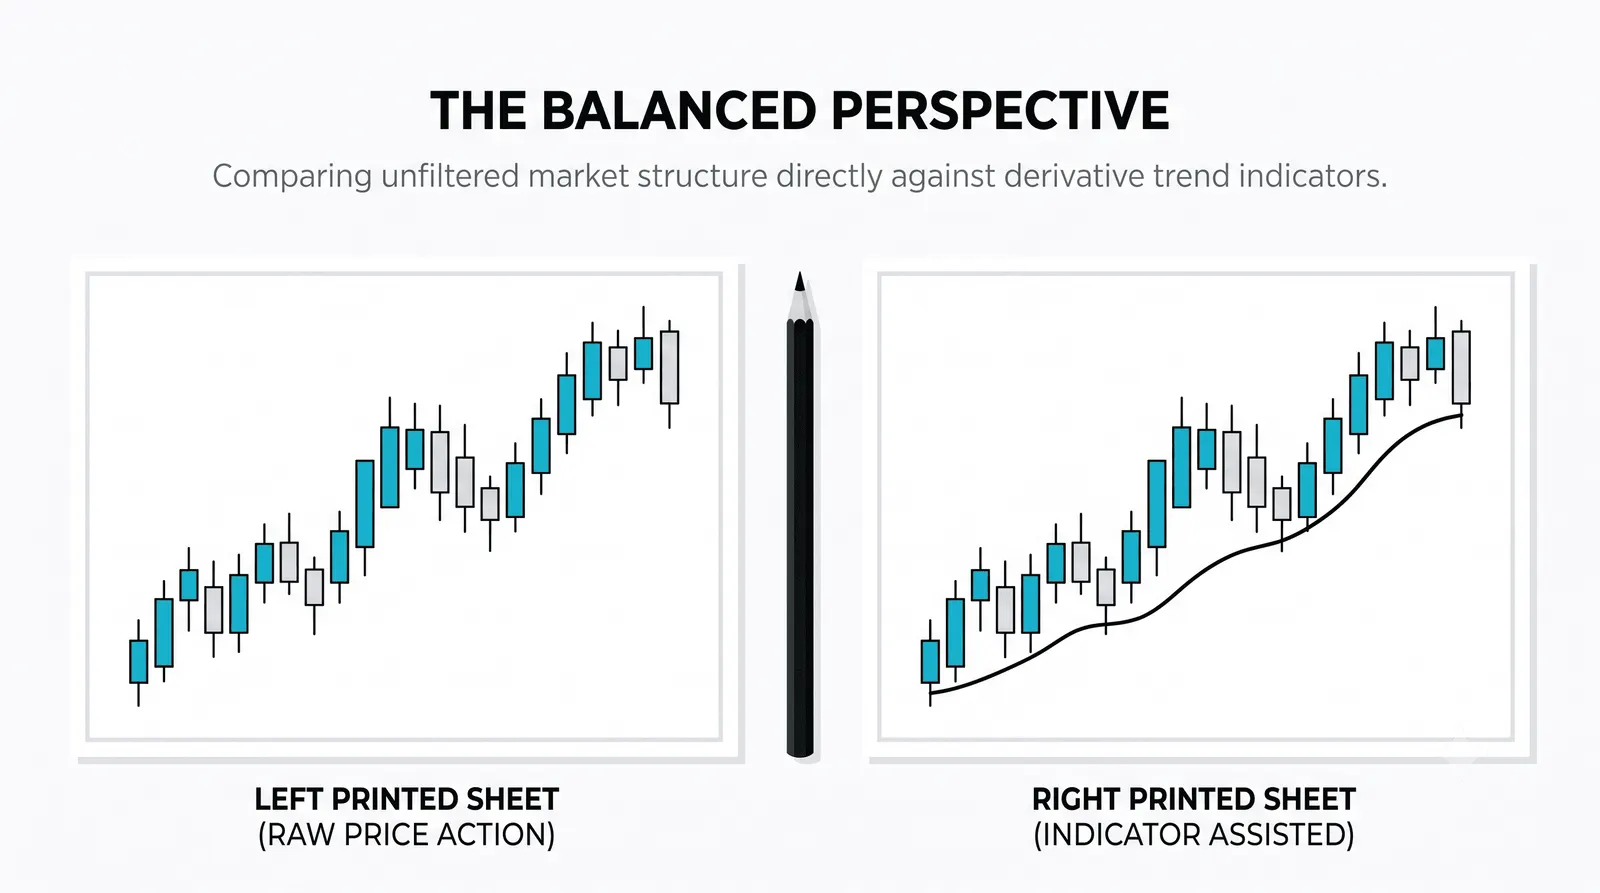
Use price action to read the situation. Use indicators to filter or time it. That division of labor settles most of the argument.
Reading means answering: where are we, what did price just do, where are the obvious levels. Filtering means answering: is this environment worth trading at all, is momentum stretched, is the trend mature.
- Price action answers: what happened, where, and how decisively.
- Indicators answer: how this move compares to recent history.
- Neither answers: what happens next with certainty.
A trader who only reads indicators is reading summaries of summaries. A trader who refuses all indicators gives up some useful context, like knowing at a glance that price is extended far from its average. The practical middle is a clean chart with at most one or two tools, each with a defined job.
One Day, Read Two Ways
Here is a hypothetical day on a stock. Price opens at 96, rallies to 100, gets slammed back down, and closes at 97. The candle shows a long upper wick with its high exactly at 100.
The price action read: buyers tested the round number 100, sellers overwhelmed them there, and the close near the lows shows rejection. That is a warning of supply at 100.
The indicator read: RSI prints 70, the conventional overbought line. The summary says momentum is stretched.
Two descriptions, one market. Notice the difference in content. The candle tells you where the rejection happened (100) and shows the mechanism (the wick). RSI tells you the move is extended relative to the last 14 periods, but nothing about 100 being special. If price gaps to 101 tomorrow, the wick read updates cleanly; the RSI read just says "more overbought."
Raw Price vs Transformed View
| Price action | Indicators | |
|---|---|---|
| Source | The candles themselves | A formula applied to the candles |
| Assumptions | None beyond the chart | Period lengths, weightings, thresholds |
| Lag | Only the time to print a candle | Candle lag plus calculation lag |
| Best job | Reading the situation, marking levels | Filtering conditions, timing entries |
Questions About Price Action vs Indicators
Can I use both at the same time?
Yes, and most working traders do. Read the raw chart first, form your own view, then check whether an indicator agrees or adds context. The order matters. If the indicator speaks first, it anchors your read of the price.
Which should a beginner learn first?
Price action, without question. It is the source data, and every indicator you learn later will make more sense once you understand what it is summarizing. Start with candles, swings, and levels, as covered in our price action lesson.
Do professional traders use indicators?
Some do, many lightly. Desk and prop traders typically watch price, volume, and a small set of levels, with indicators as secondary context. The stereotype of a screen buried under ten oscillators is mostly a retail habit.
Do indicators work on crypto?
They compute the same way, since crypto charts are just price data. But crypto trades around the clock with thinner liquidity on weekends, so common settings tuned for stock market hours may behave differently. Test any setting on the specific market and timeframe you trade.
Next, put this into practice: open a chart with everything removed, mark the obvious swing highs and lows for a week of data, and write one plain sentence per day describing what price did. Then add a single moving average back and note what, if anything, it told you that your sentences did not.