VWAP Standard Deviation Bands
VWAP standard deviation bands are lines drawn one, two, and three standard deviations above and below the session VWAP, and they frame the range where price statistically tends to travel around value. They convert VWAP from a single reference line into a map of stretch: where price likely drifts back from, and where a band-ride signals a trend day instead of a rotation.

Think of a rubber band. It stretches within its tolerance over and over, but pull far enough past that range and it either snaps back hard or the whole shape of the thing changes. Price around VWAP behaves the same way on most sessions, and the bands mark where that tolerance runs out.
The earlier lessons in this block read VWAP as value and covered how price behaves around it intraday. This lesson adds the statistical frame around that value, so you can measure stretch instead of guessing at it.
What the Bands Measure
The bands measure the volume-weighted dispersion of prices around VWAP. Plainly: how far, on average, traded prices have strayed from the session's volume-weighted mean, with heavier-volume prints counting more in the calculation.
Most platforms draw them at one, two, and three standard deviations on each side. The one-deviation band holds the bulk of ordinary trade. Two deviations marks a genuine stretch. Three deviations is rare air, the kind of extension that either ends in a snap back or announces that the session has changed character entirely.
Because the math is volume-weighted, the bands reflect where business actually got done, rather than where price merely printed. Volume price analysis makes the core point directly: price alone is half the story, and weighting by volume is what gives the reference its honesty.
Band width itself is a read. The bands widen when the session gets volatile and narrow during a quiet coil. A tight band set tells you the day is compressed and any expansion will stretch price to the outer lines quickly. A wide set tells you the session has already spent its energy, and touches of the outer bands mean more because they cost more to reach.
Range Day and Trend Day
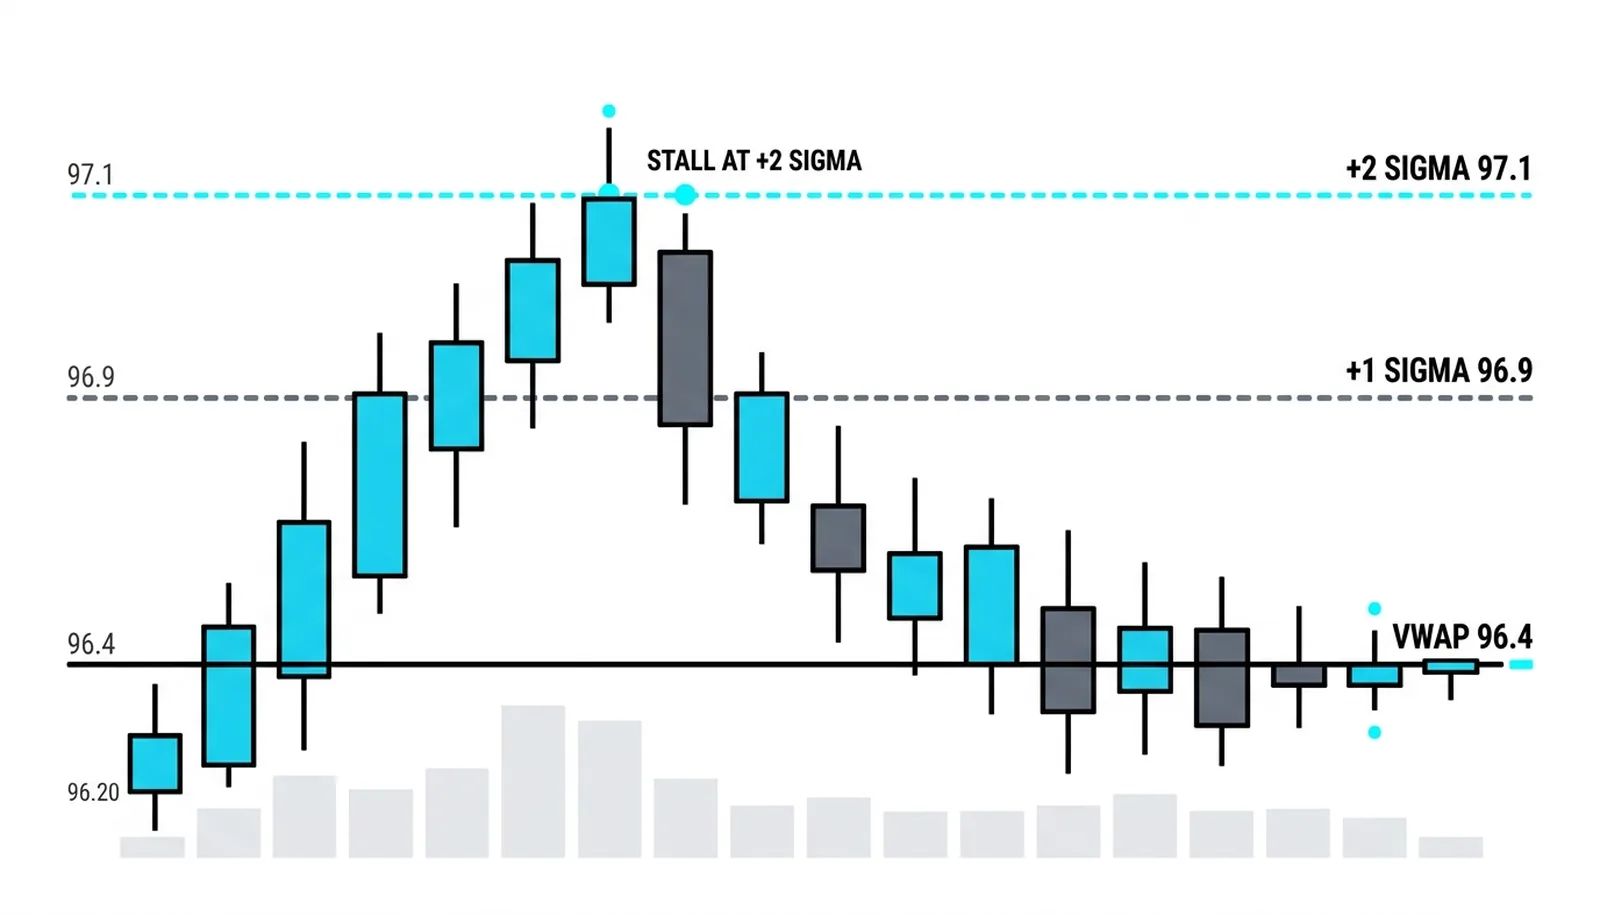
On a range day, price oscillates between the bands. The rhythm is mean reversion: fade the upper band back toward VWAP, buy the lower band back up toward VWAP. The bands act as the outer rails of the rotation, and VWAP is the pivot price keeps crossing.
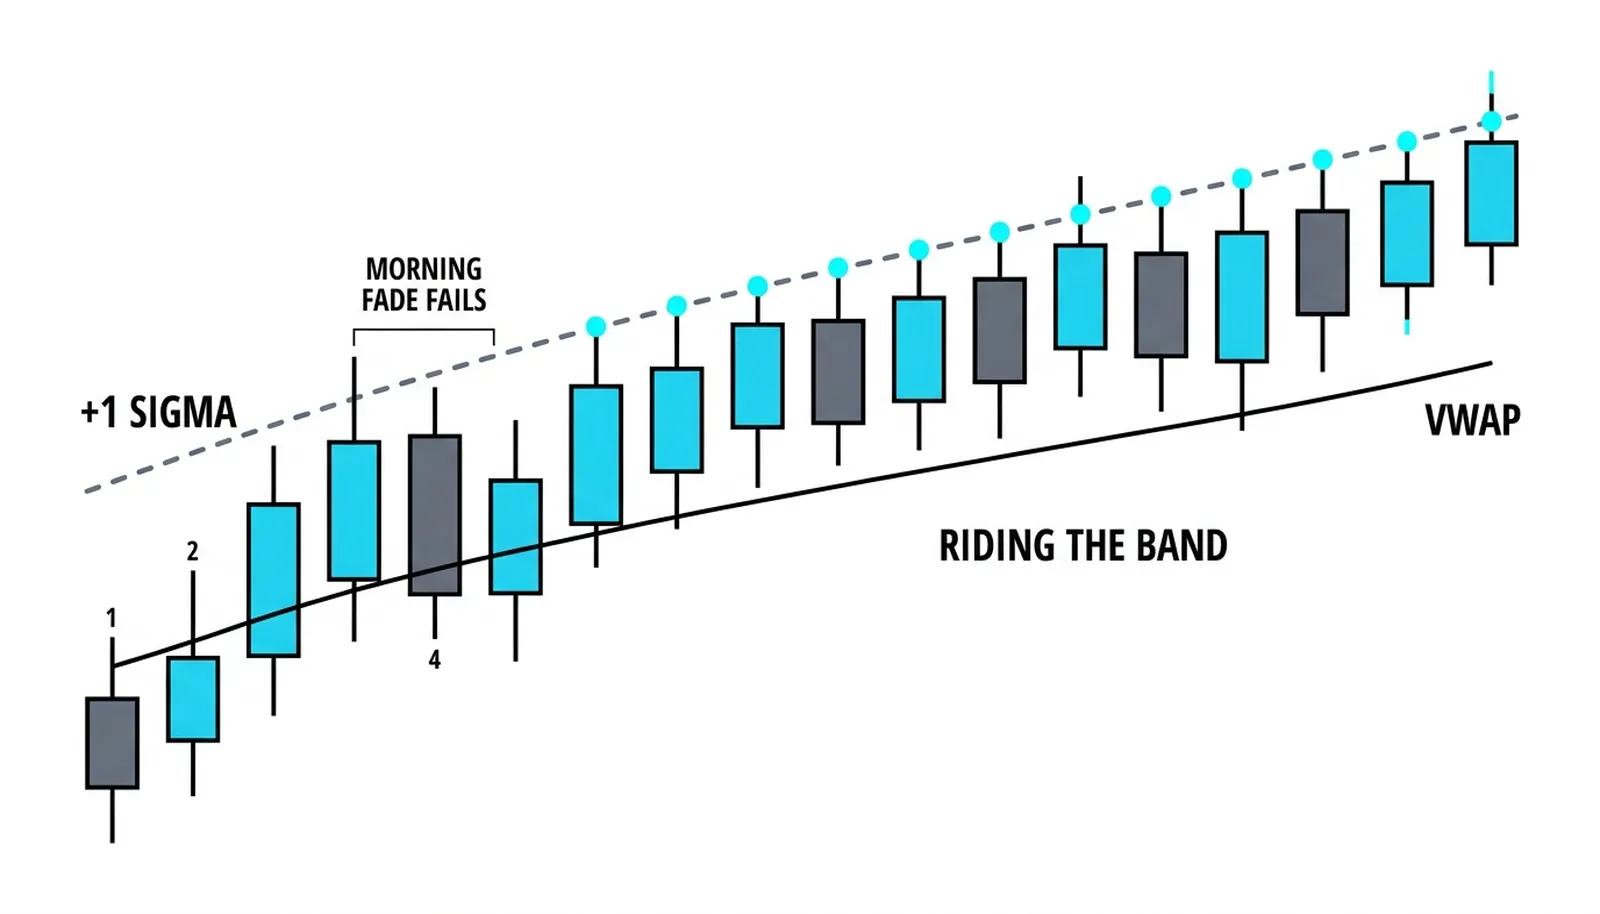
On a trend day, the behavior flips. Price rides along one band without returning to VWAP, and each pullback holds the band instead of the line. Technicians call this the band walk, and it is the statistical signature of a trend day. The band that capped price on a range day becomes the floor that supports it on a trend day.
The distinction matters because the same touch demands opposite responses. A two-deviation touch on a range day is a fade candidate. The same touch in a band walk is a continuation entry on the next pullback that holds the band. The day type decides the trade, not the touch.
How do you tell which day you have? Watch what happens after the first outer-band touch. A stall and rotation back through VWAP says range. A shallow pullback that holds the band and pushes again says the walk has started.
The Stretch That Gets Paid Back
The classic trap is a two or three deviation push late in a move with volume drying up underneath it. Price reaches the outer band, the advance slows, and each new high prints on less participation than the last. That is extension without sponsorship, and it tends to get paid back into VWAP.
The logic is simple. A stretch to two or three deviations needs fresh volume to hold, because price is now far from where most business was done. If volume fades at the band, there is no one to defend the extension, and the path of least resistance runs back toward the mean.
Two cautions belong here. First, a band touch is not a signal by itself. Two-deviation touches happen routinely, several times in an ordinary week. The trade is the reaction at the band in the context of the day type: the fade in a range day, the hold in a trend day. Traders who short every upper-band touch get run over on trend days, and traders who chase every touch get faded on range days.
Second, the bands recompute as volume arrives. VWAP is cumulative, so a late-session surge in volume can drag the line and rescale every band in minutes. A position that looked stretched at two deviations can suddenly sit at one deviation without price moving at all. Band positions late in the day deserve re-checking, not assumptions carried over from the morning.
The Bands at 96.40
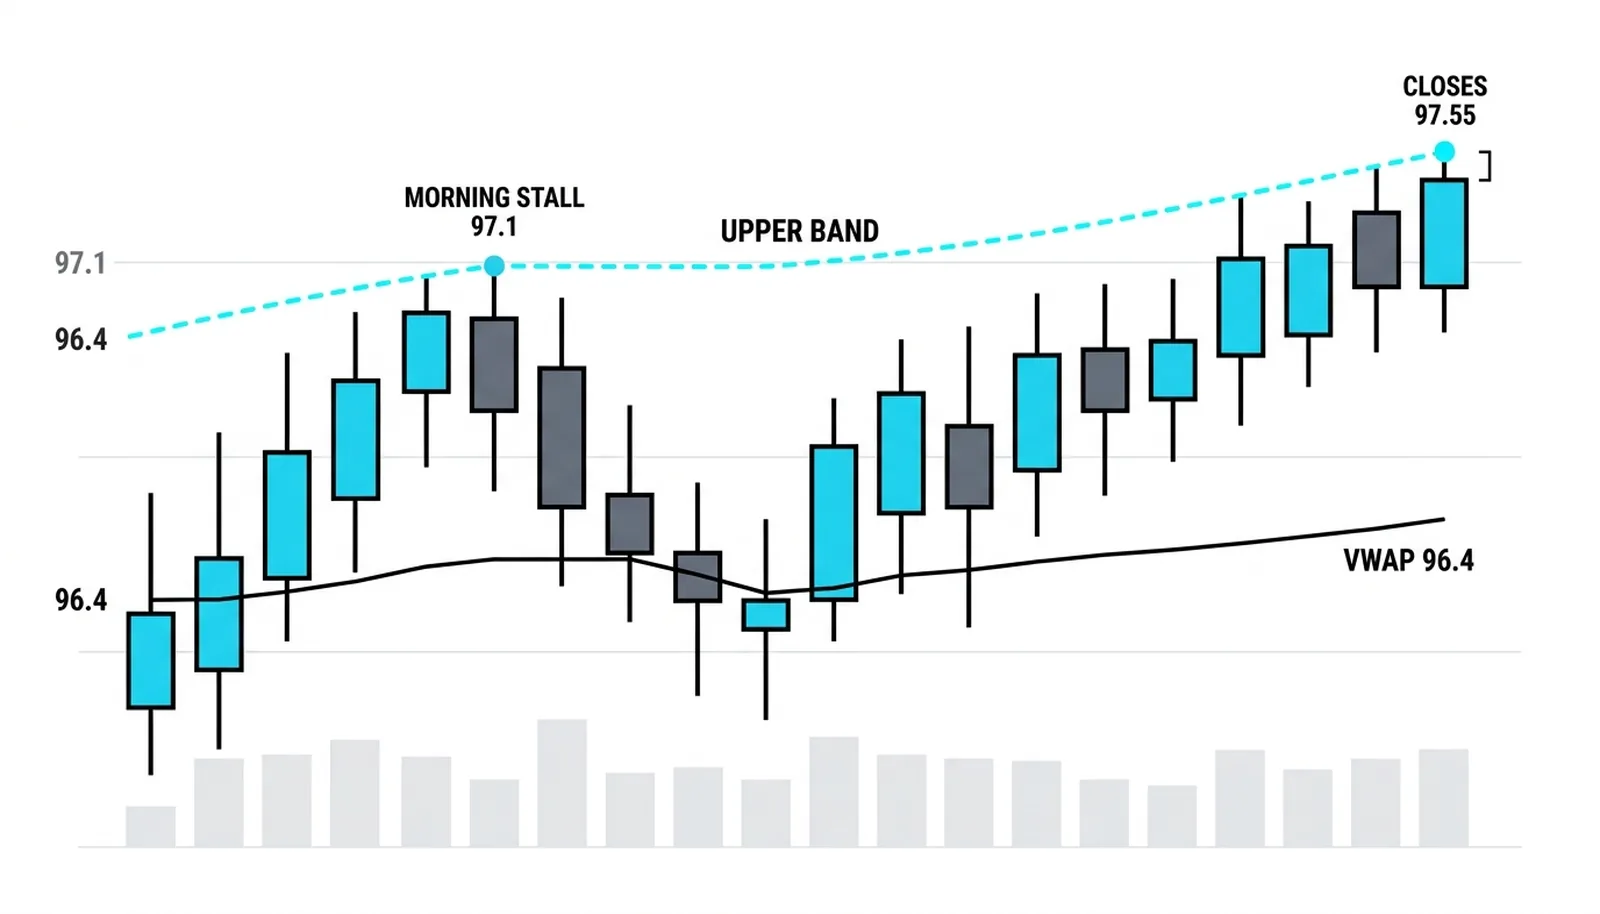
Here is a hypothetical session with round numbers. VWAP sits at 96.40. One standard deviation runs roughly plus or minus 0.35, putting the one-deviation bands at 96.05 and 96.75. Two deviations is 0.70, so the outer bands sit at 95.70 and 97.10.
The morning pushes up to the upper two-deviation line at 97.10 on average volume. Price stalls there, fails twice to extend, and rotates all the way back to VWAP by 11:30. That is the textbook range-day rhythm: stretch to the band, stall, mean reversion.
Early afternoon, price returns to 97.05, just under the same line. But the character is different this time. The approach is slow, volume dries on the way up, and then price walks along the upper band for six bars without returning to VWAP. Pullbacks are shallow and hold at the band. The band walk has started, and with it the trend-day flip.
The close prints 97.55, price still riding the band into the bell. The read: the afternoon belonged to buyers despite two morning failures at the same line. The morning touch was a fade. The afternoon touch was a hold. Same band, same price, opposite trades, and the day type was the only difference that mattered.
| Band event | Range-day read | Trend-day read | The trap |
|---|---|---|---|
| First touch of the two-deviation band | Fade candidate back toward VWAP | Early trend signal, wait for the hold | Shorting the touch before the day type is clear |
| Pullback holds the band | Rare; suggests the range is breaking | Continuation entry in the walk direction | Treating the hold as a failed fade and fighting it |
| Two or three deviation push on drying volume | Strong fade, extension without sponsorship | Warning inside the trend, tighten management | Chasing the extension just before the payback |
| Late-session volume surge | Bands rescale, re-check all positions | Bands rescale, the walk may re-anchor | Trusting morning band positions into the close |
VWAP Standard Deviation Bands, Answered
What are VWAP standard deviation bands?
They are lines plotted one, two, and three standard deviations above and below the session VWAP, measuring the volume-weighted dispersion of price around the session's mean. They turn VWAP from a single value reference into a frame that shows how stretched price is at any moment.
How are the bands calculated?
The platform computes the volume-weighted standard deviation of traded prices around VWAP as the session builds, then plots the multiples on each side. Because the inputs are cumulative and volume-weighted, both VWAP and the bands update with every print and can rescale quickly on a late surge in volume.
Should you fade every band touch?
No. A touch is a location, not a signal. On a range day the outer-band touch is a fade candidate; on a trend day the same touch is where continuation entries get taken on the hold. The reaction at the band and the day type decide the trade.
What does it mean when price rides the upper band?
It means the session has shifted into a trend day. Price holds along the band without returning to VWAP, pullbacks find support at the band instead of the line, and the statistical norm of mean reversion has been replaced by one-directional acceptance. The correct response is to trade with the walk, not against it.
This lesson closes the VWAP block. The next one steps back from reference lines entirely: mean reversion, the core idea that price stretched from value tends to return, and why markets revert at all.