Mean Reversion: Why Prices Return to Value
Mean reversion is the tendency of a price that has moved unusually far from its average to drift back toward that average. The average is not a wall. It is the record of where the crowd actually traded, and price that wanders too far from that record tends to come back and check it.

Markets behave this way because they are auctions. Price explores away from the level where business is getting done, and moves that outrun the participation behind them get repriced. Think of a juggled ball: every throw leaves the hand, arcs as high as the force sends it, and returns, and the hand is the mean.
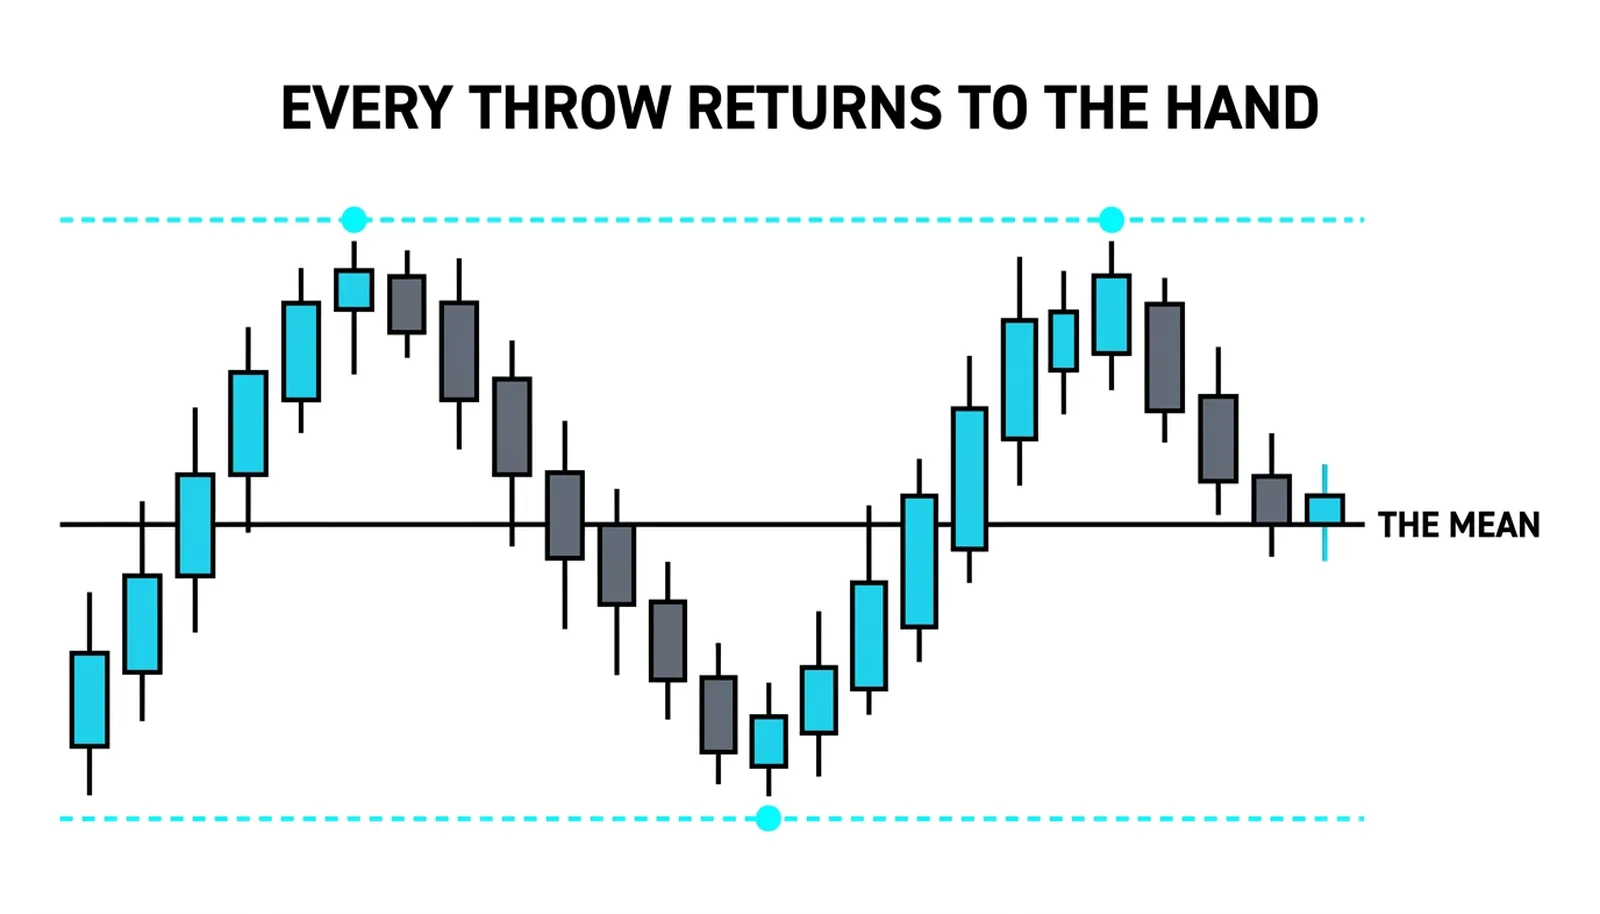
An earlier Level 8 lesson covered Bollinger Bands as the indicator wrapper around this idea. This lesson is the why underneath the indicator, written for the trader who wants to understand the force before clipping bands onto a chart.
Three Forces Behind the Pull
Price reverts for three reasons, and they work together. None of them is mystical. All three come out of how an auction actually runs.
First, value. Volume price analysis and market profile practice both teach the same core idea: price that rises above what buyers will pay meets sellers, and price that falls below what holders will sell for meets buyers. The market rotates around the level where two-sided trade actually happened. Stretch too far in either direction and the other side of the auction shows up.
Second, inventory. The crowd that chased the extreme is trapped once the move stalls. Their exits fuel the trip back, first the stops, then the reluctant liquidation from traders who hoped the stall was a pause. Every stretched move carries its own return fuel inside it, in the form of unhappy positions.
Third, statistics. An extreme move puts price in territory where the next stretch of history usually looks ordinary. Ordinary pulls the reading of price back toward its recent average. This is the coldest of the three forces and the one that works even when no one is trapped and no obvious seller appears.
These three forces explain why the pull exists. They do not explain when it fires, and that gap matters, as the later sections show.
What Reverts and What Walks Away
Here is the split that decides whether reversion is a trade or a trap. Price in a rotating market reverts to value. Price in a regime change adopts a new average.
In a rotating market, the auction keeps finding the same area acceptable. Extremes get rejected, the crowd comes back, and fading the stretch works more often than it fails, the bracket rhythm the profile day types catalogue. In a regime change, something real has shifted, the old average stops describing the market, and price holds its new ground while the average catches up from behind.
This is why quantitative backtesting practice uses a moving mean rather than a fixed one. The mean itself walks. A static number from last month describes a market that may no longer exist.
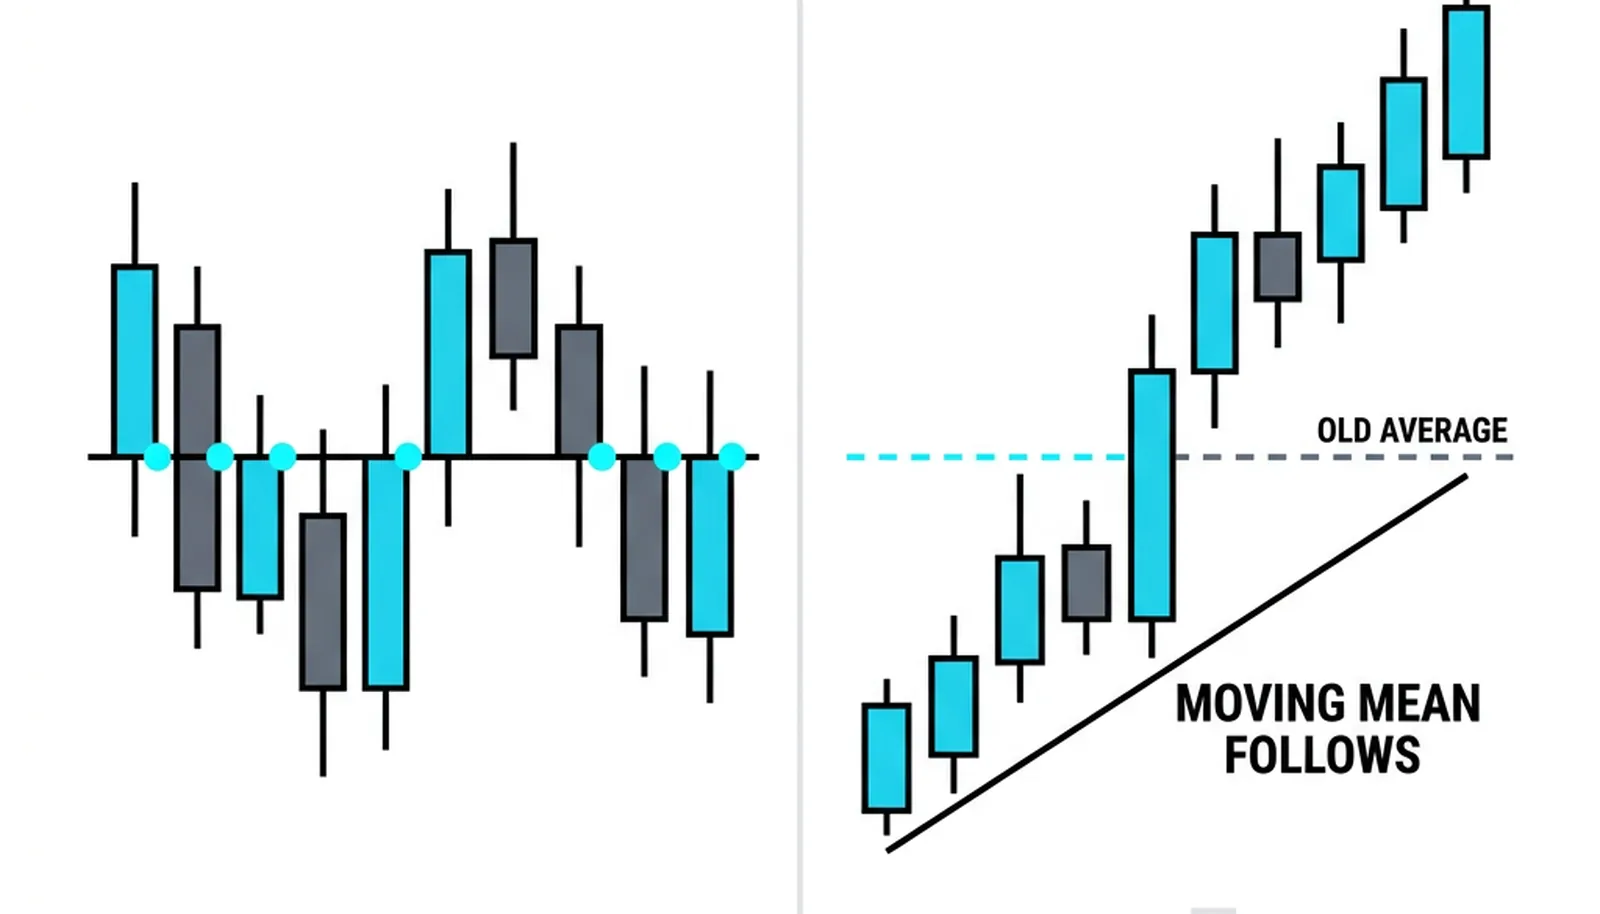
The practical read is simple. If price stretches and stalls, expect reversion. If price stretches, holds, and keeps accepting the new level on real volume, the average is about to move to price, not the other way around. Fading the second case is how traders donate money while being conceptually correct.
No Timetable
Reversion is a tendency over time, never a clock. There is no schedule, and the speed differs wildly between markets and regimes.
Examples in quantitative backtesting practice range from a couple of weeks to many months for the same family of trades. The trader who expects the return by Thursday is making up a timetable the market never signed.
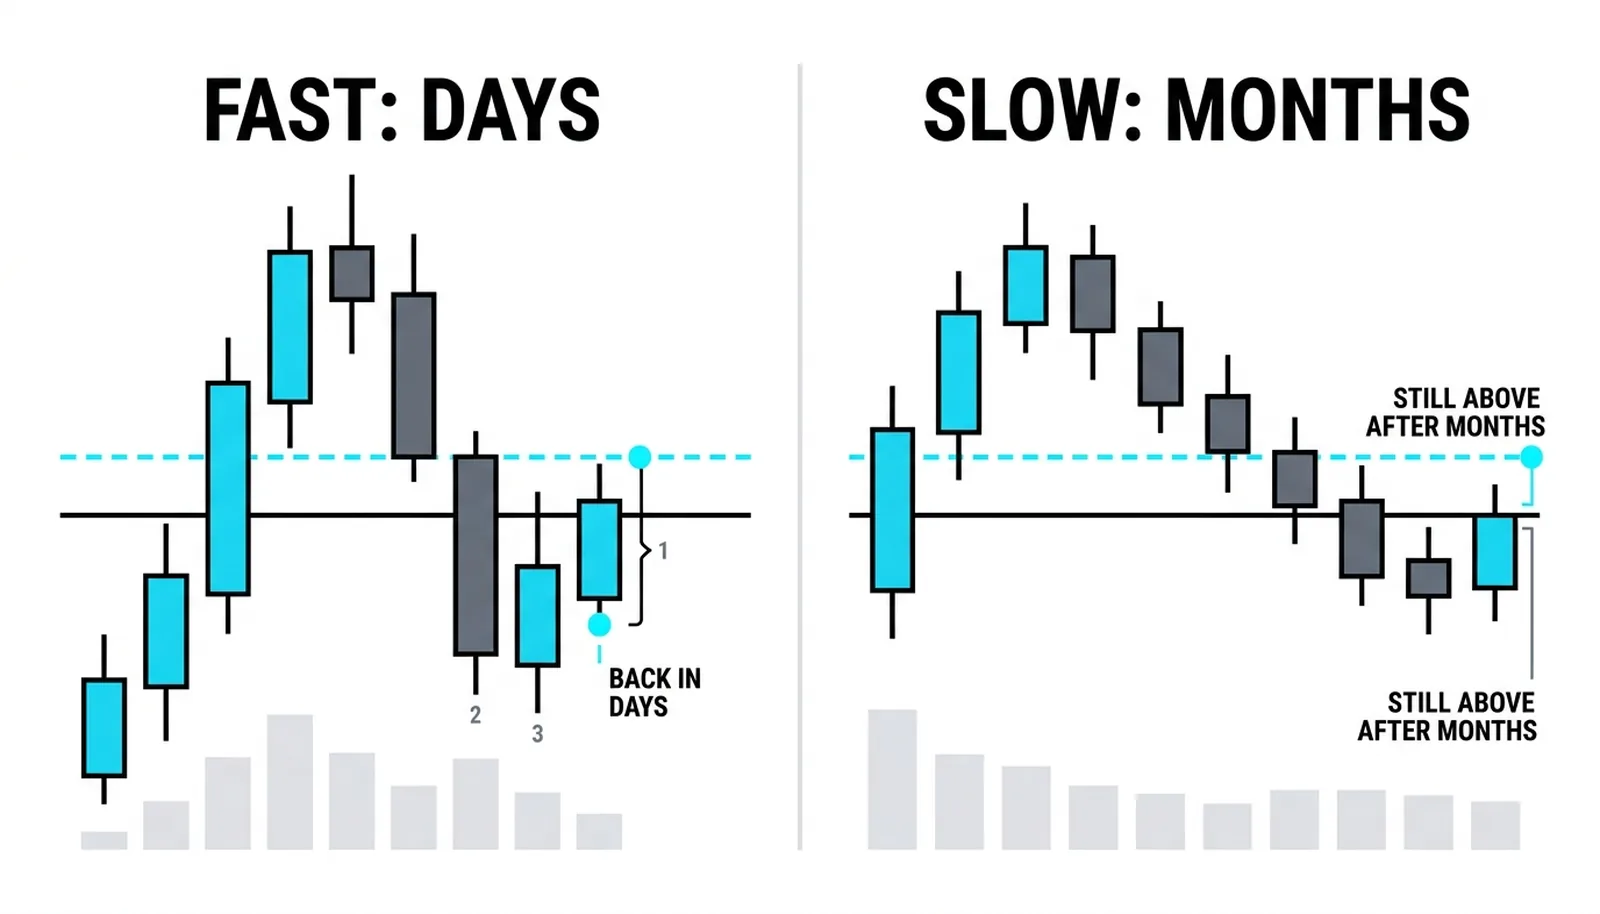
The second caution cuts deeper. The mean moves. Fading to a static number while the average itself is walking away is the single most expensive way to be right about the concept and wrong about the trade. You can correctly identify a stretched market, take the fade, and still lose because your target was anchored to a mean that stopped being the mean three sessions ago.
So the discipline has two parts. Wait for the stall instead of anticipating it, and keep re-measuring the average instead of trusting an old one. Both are boring. Both are where the money is.
The Spike to 84.90
Here is a purely hypothetical illustration with round numbers. A stock has been averaging 82.00 over recent weeks. A headline hits, and price spikes to 84.90 inside a single day.
The stretch. At 84.90, price sits well above where two-sided trade has been happening. The auction is exploring, not doing business. Volume on the spike is heavy, but heavy volume on a headline tells you about excitement, not about acceptance.
The stall. The follow-through bar cannot exceed 84.40. This is the first piece of real information. The buyers who chased the top needed immediate continuation to be comfortable, and they did not get it. Their stops are now live fuel sitting underneath price.
The drift. The next three sessions slide to 83.60 on shrinking volume, then to 82.60, back near the average. The quiet character of the decline matters. No panic, no fresh sellers storming in. Just trapped inventory leaking out as hope fades, which is exactly what inventory-driven reversion looks like.
The regime-change version. Same spike to 84.90, but instead the stock holds above 84.00 for days, pushes new highs on heavy trade, and pullbacks get bought quickly. In that version the average itself follows price upward, and within a couple of weeks the mean sits near 84.00. Fading that move on the logic of "it has to come back to 82" fights a market that has moved house.
| Stage | Reversion Read | Regime-Change Read | The Tell |
|---|---|---|---|
| Spike to 84.90 | Exploration above value | Possible repricing begins | Headline moves are ambiguous alone |
| Follow-through capped at 84.40 | Buyers exhausted, stall confirmed | Normal digestion, not yet a verdict | Whether dips get bought from here |
| Drift to 83.60 on shrinking volume | Trapped inventory leaking out | Would look like firm, supported pullback | Volume character on the decline |
| Arrival near 82.60 | Reversion complete, trade done | Would never arrive; average walks up instead | Where the moving mean sits a week later |
Questions About Mean Reversion
Why do markets revert to the mean?
Markets revert because they are auctions, and auctions keep returning to the price where real two-sided business happened. Stretched moves run out of willing participants, trapped traders exit, and plain statistics pull an extreme reading back toward ordinary territory.
Is mean reversion the same as buying the dip?
No. Buying the dip is a tactic inside an uptrend; mean reversion is a description of how price behaves around its average in any direction. A reversion trade can be a short at a stretched high just as easily as a buy at a stretched low, and some dips are regime changes that never come back.
Does mean reversion always work?
No, and the failures cluster in exactly one place: regime changes. When the market adopts a new average, the old mean stops attracting price, and every fade against the new reality loses. The edge exists in rotating markets, so identifying the regime comes before placing the trade.
What time frame does mean reversion work on?
It works on any time frame where an auction operates, from minutes to months, because the underlying forces do not depend on the clock. What changes with the time frame is the speed and the noise: intraday reversion resolves in hours, while position-level reversion can take weeks or months, as quantitative backtesting examples show.
With the why in place, the next lessons turn mechanical: fading stretched moves back to VWAP, working the volume profile's point of control and value area, and building the full setup from trigger to stop to target.