Anchored VWAP: Events, Highs, Lows, Gaps
An anchored VWAP is the volume-weighted average calculated not from the session open but from a moment the trader chooses: an earnings gap, a swing high, a swing low, a news shock. It works because everything that traded since that moment is measured against the price the average participant paid since the event. The anchored VWAP method, which popularized the tool, describes it as the fulcrum where the market reveals who is really in charge. That framing matters. The line is not a prediction. It is a running tally of who holds profit and who holds pain since something important happened.

Think of it as a tape measure hooked at one fixed end. Every measurement runs from the hook, and the anchored VWAP hooks the event so every price since measures against it. An earlier lesson introduced the anchored VWAP as a concept; this lesson is about the craft: choosing anchors that deserve to be chosen, and reading what the line says once it is drawn.
What Counts as an Anchor
Per the anchored VWAP method, the calculation is identical to a standard VWAP. The only difference is the starting point: the user sets it at a specific meaningful moment instead of the session open. Same math, different question. A session VWAP asks where the average participant sits today. An anchored VWAP asks where the average participant sits since the event that changed things.
A good anchor is an event that changed the market's mind. Not every wiggle qualifies. The events that earn anchors share one trait: before the event, participants held one set of beliefs; after it, they held another. The anchor marks the boundary between those two regimes.
- Earnings gaps. New information repriced the stock overnight. Everyone who traded since the gap did so with the new information in hand, so the average cost since the gap is a clean statement of where conviction sits.
- Swing highs and lows that ended moves. The high that stopped a rally, or the low that stopped a decline, is where control last changed hands. Anchoring there measures the cost basis of everyone who joined the new direction.
- News shocks. An unexpected announcement, a regulatory decision, a downgrade. The shock resets positioning the same way an earnings gap does.
- The high or low that started the current trend. If the trend is the story, its origin bar is the natural hook. The line then tracks the average entry of everyone riding that trend.
Notice what these have in common. Each is visible on the chart without any indicator at all. If you have to squint to justify the anchor, it is not an anchor.
The Line as the Running Argument
Once the anchor is set, the read is direct. Buyers are in control while price holds above the anchored line, because the average participant since the event sits on a profit and has no reason to sell in panic. Sellers are in control while price holds below it, because the average participant is underwater and every rally hands them a chance to exit at breakeven.
Tests of the line are the argument playing out in real time. When price returns to the anchored VWAP, two groups meet: those defending a profit and those seeking an exit. The outcome of that meeting tells you more than the line's position alone. A test that holds on shrinking volume says the losing side is running out of supply. A test that fails on expanding volume says the winning side just got reinforced.
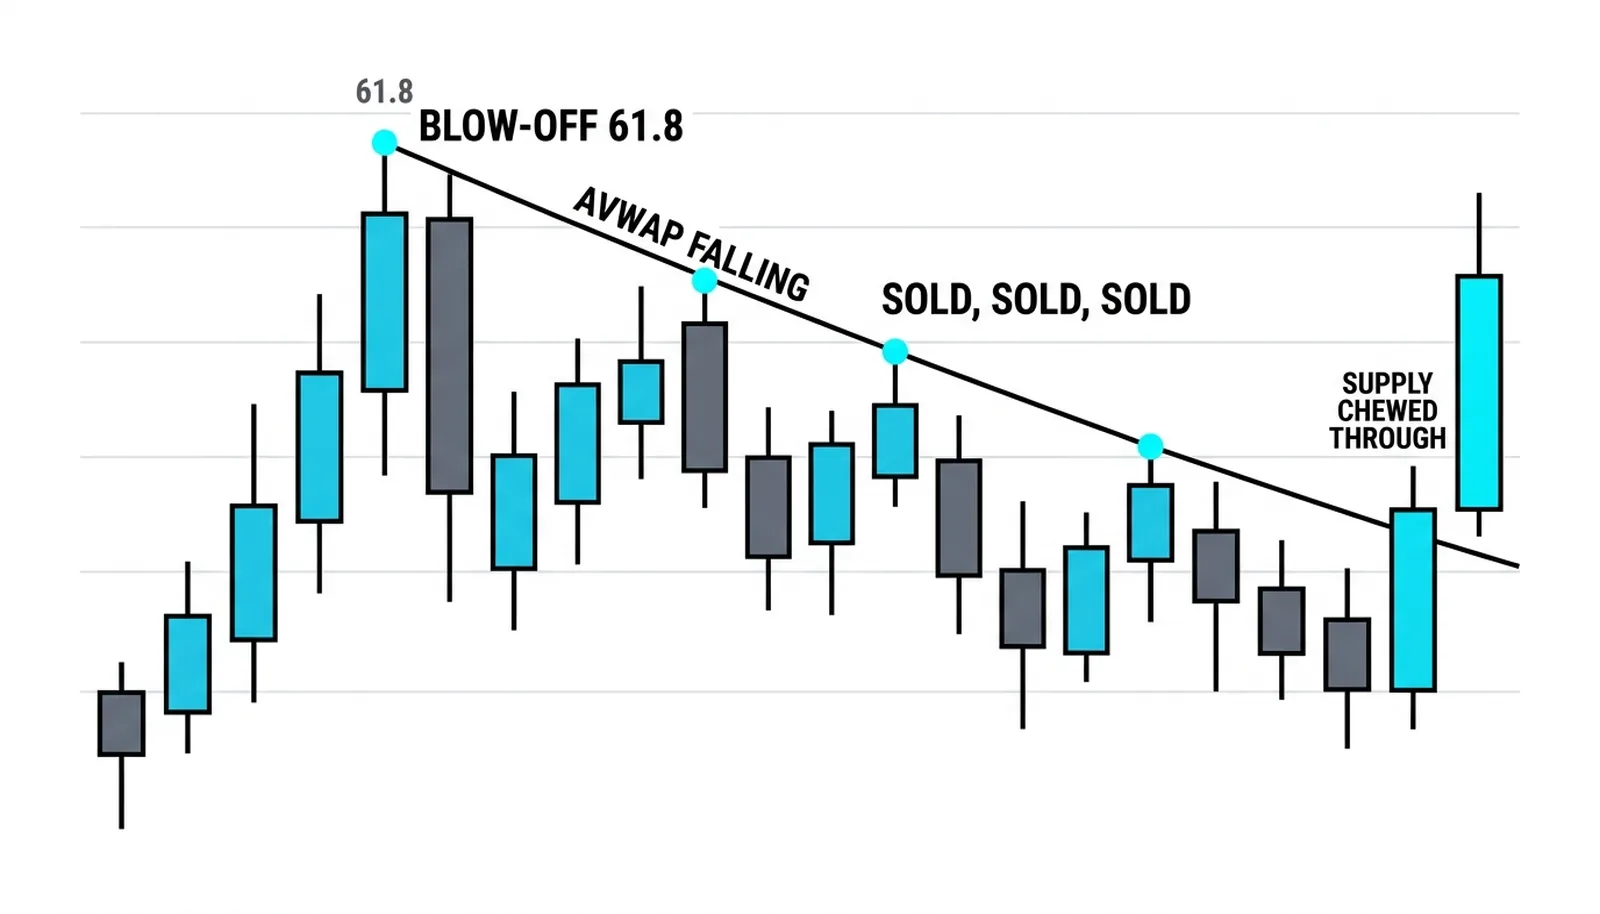
The anchored VWAP method documents a pattern worth memorizing. An AVWAP drawn from a significant high gets tested repeatedly on the way down, and each test chews through a portion of the remaining supply. The first rally into the line meets heavy selling from trapped longs. The second rally meets less. By the third or fourth test, the sellers who wanted out at breakeven are largely gone, and the stock reverses through the line. The line did not change. The supply behind it did.
This is why a single touch means little. One test is an event. A series of tests is a process, and the process is what you are reading.
Stacked Anchors
One anchored VWAP measures one event's participants. Several anchored VWAPs from different events converging in one price zone measure something bigger: a place where multiple timeframes of participants have unfinished business at the same price.
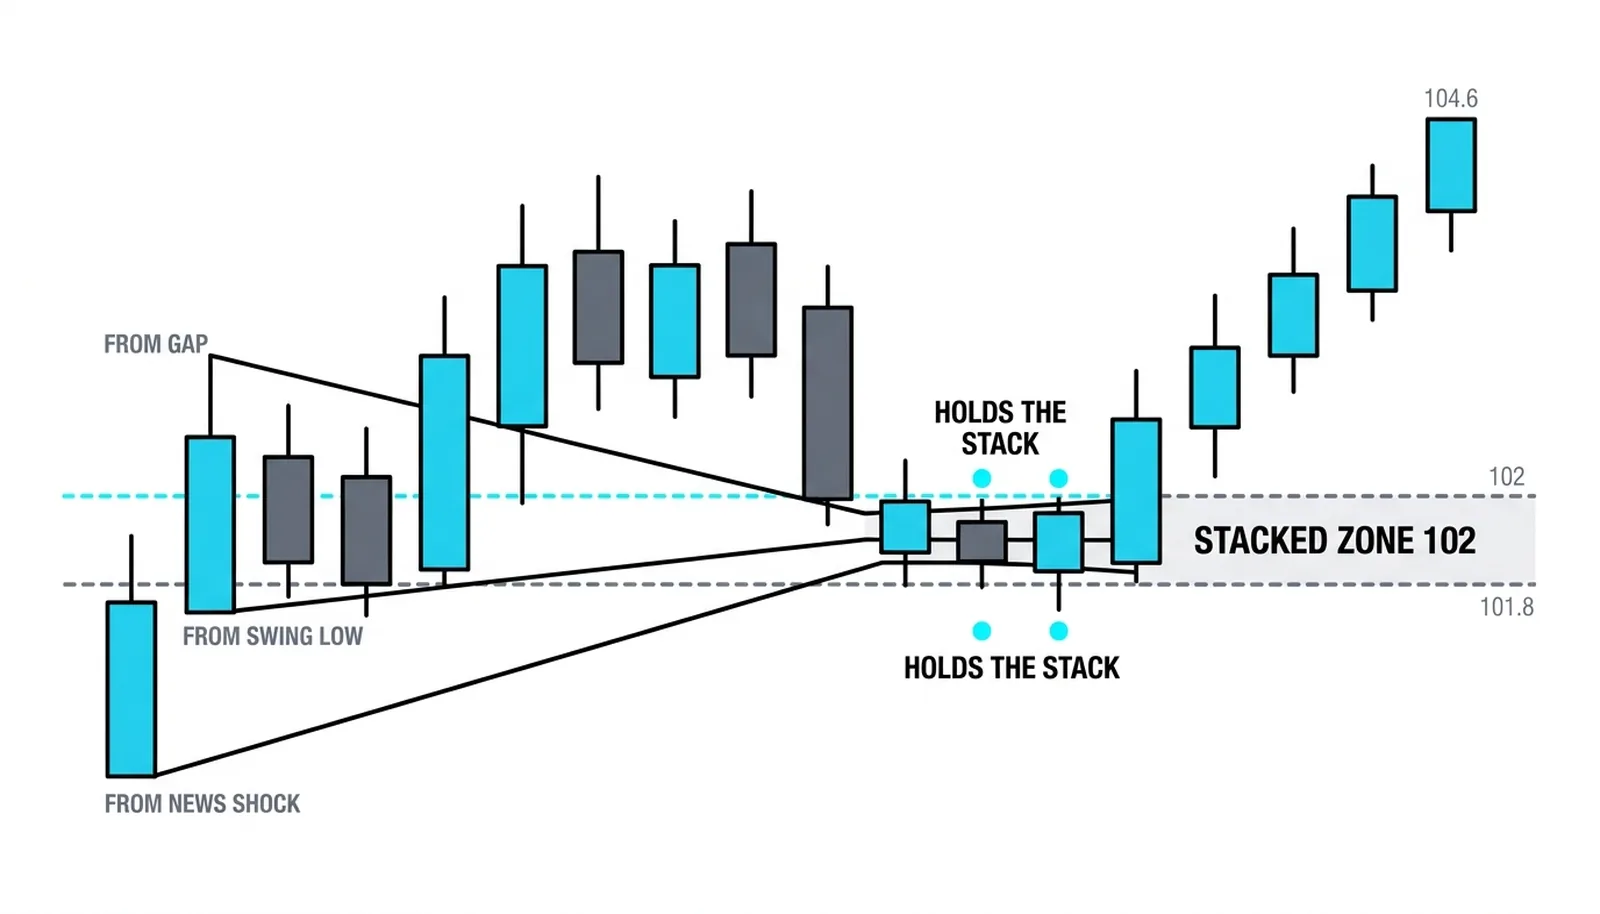
Picture three anchors: one from the earnings gap two months back, one from the swing high that followed, one from the low that started the current leg. If all three lines sit within a narrow band, that band is a decision zone. The average buyer from the gap, the average buyer from the high, and the average buyer from the low all have their breakeven in roughly the same place. Price reaching that zone forces a collective verdict.
Converging lines deserve more respect than any single line. A break through one anchored VWAP shifts one group's posture. A break through a stacked zone shifts several groups at once, which is why moves out of stacked zones tend to travel. Volume price analysis points the same direction from a different angle: where volume-based references cluster, the market treats the zone as significant because so many participants share it.
Two cautions before the worked example. First, anchor selection is the subjective part. The data is objective, but the choice of event is yours, and the discipline is anchoring to events that clearly changed behavior rather than to every wiggle that flatters an existing opinion. Order flow analysis makes the same point about reference levels generally: the level must mark a real shift in participation, or the line measures nothing. Second, an AVWAP is a reference, not a stop-loss line. Price can slice an anchored line and keep running when the event's story has genuinely been superseded by newer information. The read is who is winning the argument since the event, updated as the tape argues back.
The Anchor at 52.30
All numbers here are hypothetical and invented for illustration. A stock closes at 49.10, then gaps to open at 52.90 on earnings. The first trade of the gap session prints at 52.30, and that print becomes the anchor.
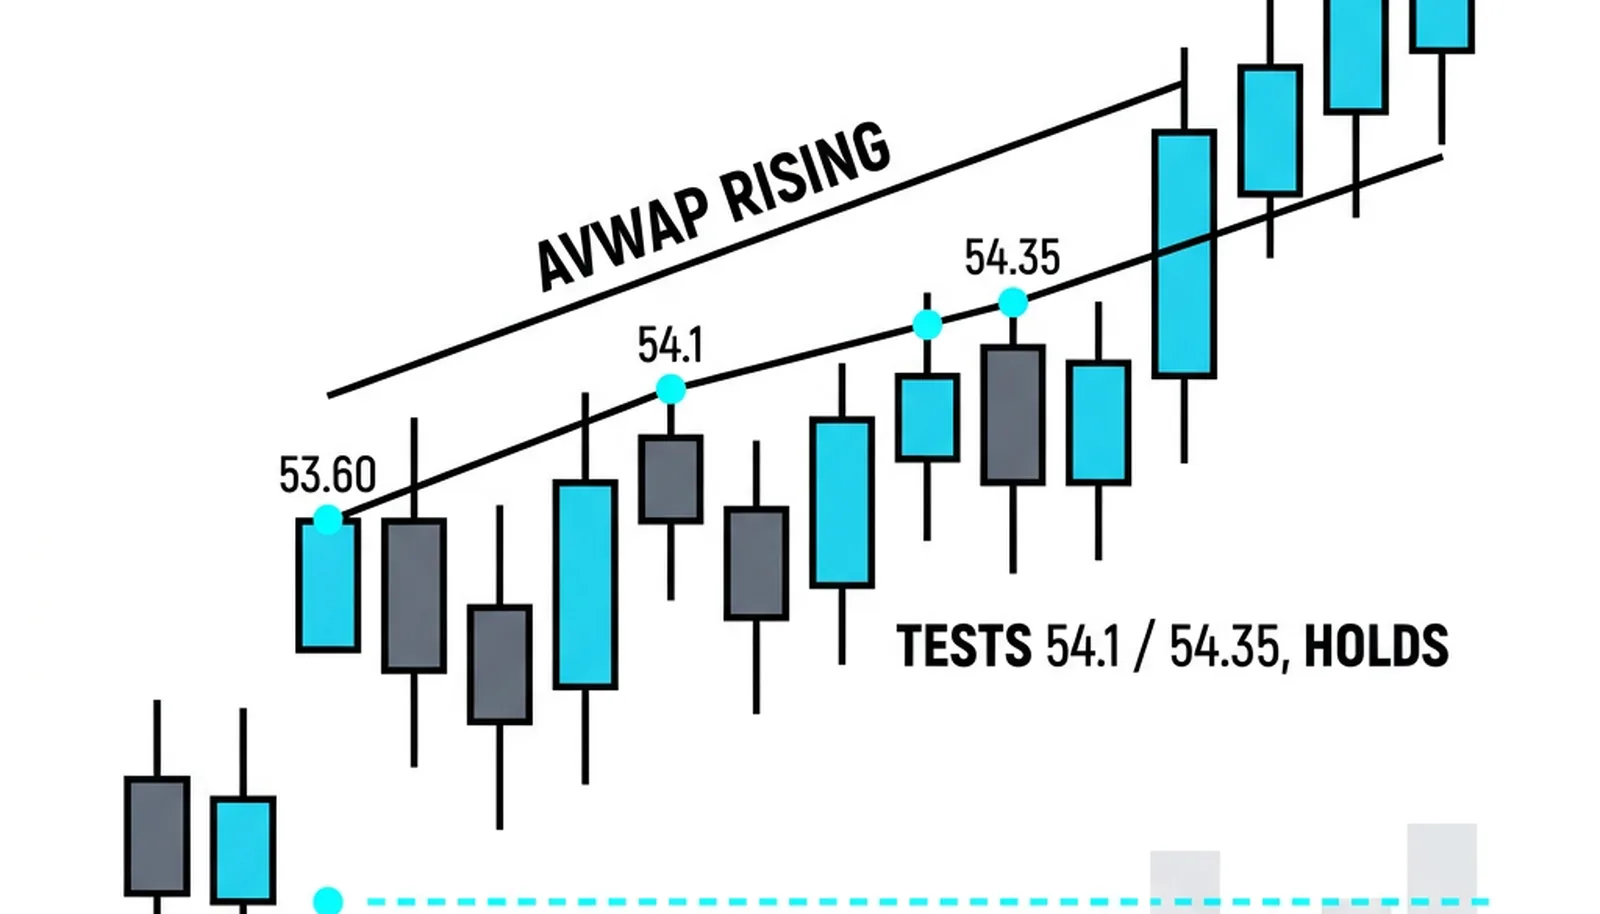
The stock runs to 56.00, then pulls back over three sessions to 54.10. The anchored VWAP from 52.30 has risen to meet it, because heavy post-gap volume keeps pulling the average up. Price tags the rising line at 54.10 and holds, and the pullback volume shrinks each day. The average gap-era buyer is profitable at 54.10, and nobody is rushing for the exit.
A second test comes at 54.35 a few sessions later. It holds too, again on light volume. Two tests, two defenses, sellers absent. The break above 56.80 then arrives on clear volume expansion, and the trend continues. The anchored line framed the whole sequence: buyers in control since the gap, supply drying up at each test, continuation confirmed.
Contrast that with a different stock. It spikes to a blow-off high at 61.80 on a rumor, then collapses. The AVWAP anchored at 61.80 becomes the ceiling. Over the following weeks, every rally into that falling line gets sold, because the average participant since the spike is underwater and sells into strength at breakeven. The first rally into the line fails hard. The second fails with less volume behind the selling. The third pushes through, the supply finally chewed through, and the character of the stock changes. Same tool, same logic, opposite posture.
| Anchor event | What it measures | The bullish read | The bearish read |
|---|---|---|---|
| Earnings gap first trade | Average cost of everyone who traded after the new information | Price holds above the line; post-gap buyers are profitable and calm | Price loses the line; the gap's buyers are trapped and selling rallies |
| Swing high that ended a rally | Average cost since control passed to sellers | Repeated tests chew through supply until price reclaims the line | Each rally into the line is sold by underwater longs |
| Swing low that ended a decline | Average cost of everyone who bought the turn | Pullbacks to the line hold on shrinking volume | The line breaks; the bottom buyers are wrong and become sellers |
| News shock bar | Repriced consensus since the shock | Price builds above the line; the shock is accepted as value | Price fades back under the line; the shock is being faded by the market |
Anchored VWAP, Answered
What is an anchored VWAP?
An anchored VWAP is the volume-weighted average price calculated from a moment the trader chooses rather than from the session open. The math is identical to standard VWAP; only the starting point changes. The result is the average price paid by every participant since the chosen event, plotted as a running line.
Which events make good anchors?
Good anchors are events that changed the market's mind: earnings gaps, swing highs and lows that ended moves, news shocks, and the high or low that started the current trend. The test is simple. If the event visibly changed behavior on the chart, it qualifies. If you need to argue for it, skip it.
Why does anchored VWAP act as support or resistance?
It acts as support or resistance because it marks the breakeven of the average participant since the event. Above the line, that participant is profitable and calm; below it, underwater and motivated to sell rallies. Price returning to the line forces both groups to act, and their actions show up as the line holding or breaking.
Who created the anchored VWAP tool?
The anchored VWAP method created and popularized the anchored VWAP, presenting it as the fulcrum that reveals which side controls the market since a meaningful event. The anchored VWAP method's framework of testing, supply absorption, and stacked anchors remains the standard reference for how the tool is read in practice.
The next lesson moves from single and stacked anchors to the bands around them: standard deviation envelopes that frame how far price can stretch from the line before the stretch itself becomes the signal.