VWAP: The Volume Weighted Average Price
VWAP, the volume weighted average price, answers a question that gets sharper as the session ages: where has this market actually traded today, weighted by how much traded at each price? A simple average treats the first quiet bar of the morning the same as the heaviest bar of the lunch hour. VWAP does something more honest. It weighs every price by the size that traded there, so the answer reflects where the real business was done.

The cleanest way to picture the weighting is a course grade. A final exam worth half the credit moves the grade more than a quiz worth two percent, even if you score the same on both. VWAP treats prices the same way: a price where huge volume traded counts like a final exam, and a price where almost nothing traded counts like a pop quiz. The line that comes out sits near the prices that mattered.
This lesson builds the line from scratch, shows why execution desks at large funds treat it as the benchmark, and walks through how its character changes from the open to the close. For the background on why volume carries information at all, start with what volume is and why it matters, then come back.
The Formula, Weighted by Size
The math fits on an index card. For each bar, compute the typical price: high plus low plus close, divided by three. Multiply it by that bar's volume. Add the results up from the session start and divide by the total volume so far.
VWAP = cumulative (typical price × volume) ÷ cumulative volume.
A worked set of numbers shows why the weighting moves the answer. Take five snapshots of one session:
| Snapshot | Typical price | Volume | Typical price × volume |
|---|---|---|---|
| Morning drift | 100.0 | 100k | 10,000k |
| Late morning | 100.5 | 120k | 12,060k |
| Lunch push | 102.8 | 350k | 35,980k |
| Early afternoon | 103.2 | 380k | 39,216k |
| Close drift | 102.6 | 110k | 11,286k |
The simple average of those five typical prices is 101.82. VWAP is the volume column total, 1,060k, divided into the price-times-volume column total, 108,542k, which gives 102.40. The heaviest two stretches traded near 103, so the weighted answer sits over half a point above the unweighted one. Same data, and the two averages disagree about where the day's fair price was. VWAP's answer is the one an execution desk would recognize.
Two details of the formula matter in practice. First, the cumulative sum resets every session, which makes VWAP a single-day tool by design. Second, the early-session line is jumpy, because a few bars carry the whole average. By lunch, thousands of bars of volume anchor it, and the line barely flinches at any single print.
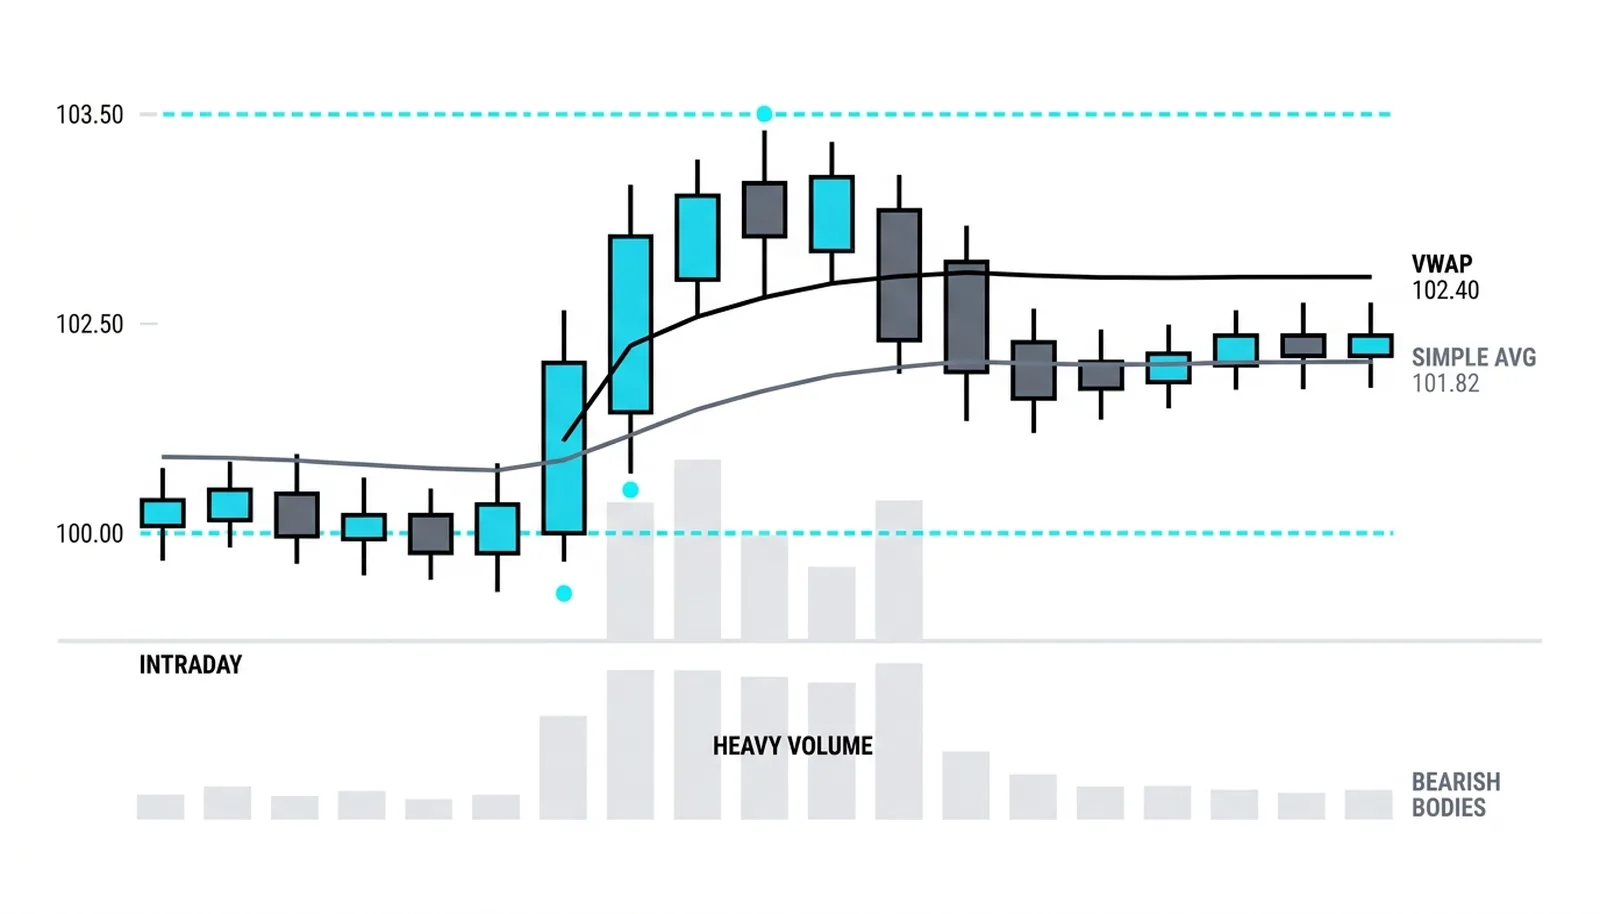
The chart above makes the weighting visible. A quiet open, then a burst of heavy-volume trade at high prices, then quiet again. The simple average splits its attention evenly across all three stretches. VWAP follows the volume, so it sits up with the heavy trade, close to where most of the session's business happened.
Why Execution Desks Treat VWAP as the Benchmark
Institutions came to VWAP through execution, not charting. A pension fund that needs to buy two million shares over a day faces a problem: trade it all at once and the order moves the market against itself. The classic compromise is to slice the order across the day and judge the result against the session's volume weighted average price. Beat VWAP and the desk added value. Miss it and the desk cost the fund money, no matter how the chart looked.
That benchmark role is why the line behaves the way it does on charts. As the anchored VWAP method explains in the work that formalized VWAP as a charting tool, large players algorithmically work orders around the line all day, which turns it into a price zone where real orders cluster. Quantitative backtesting practice makes a related point from the market-making side: the volume weighted average is a natural estimate of an asset's fair value mid-session, which is why mean-reversion systems keep comparing price to it. When a line has both working orders and fair-value logic attached, chart traders get a level that tends to matter.
How the Line Changes Character Through a Day
On a balance day, price orbits VWAP. Buyers above the line find nothing to chase, sellers below it find the market fairly priced, and the session keeps returning to the one price where the volume agrees it should trade. The touches below are the pattern to internalize.
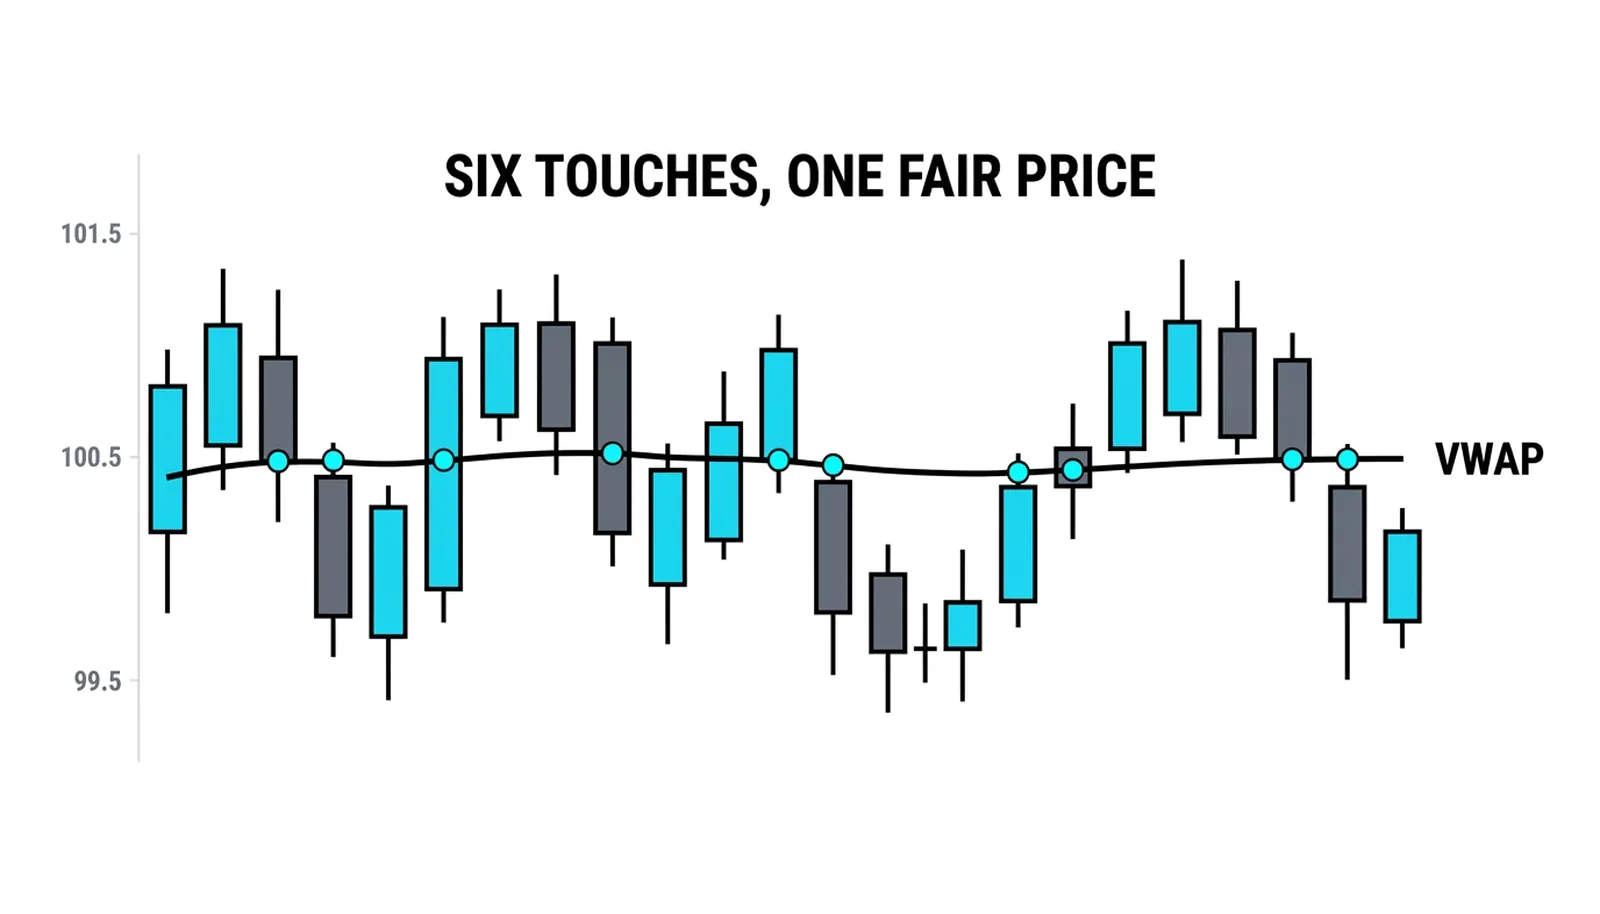
Six touches in one session, and every drift away from the line eventually came back to the weighted fair price. That is the equilibrium regime. The trade implications change completely once a trend day takes over, and the fastest way to see the difference is the same session type side by side.
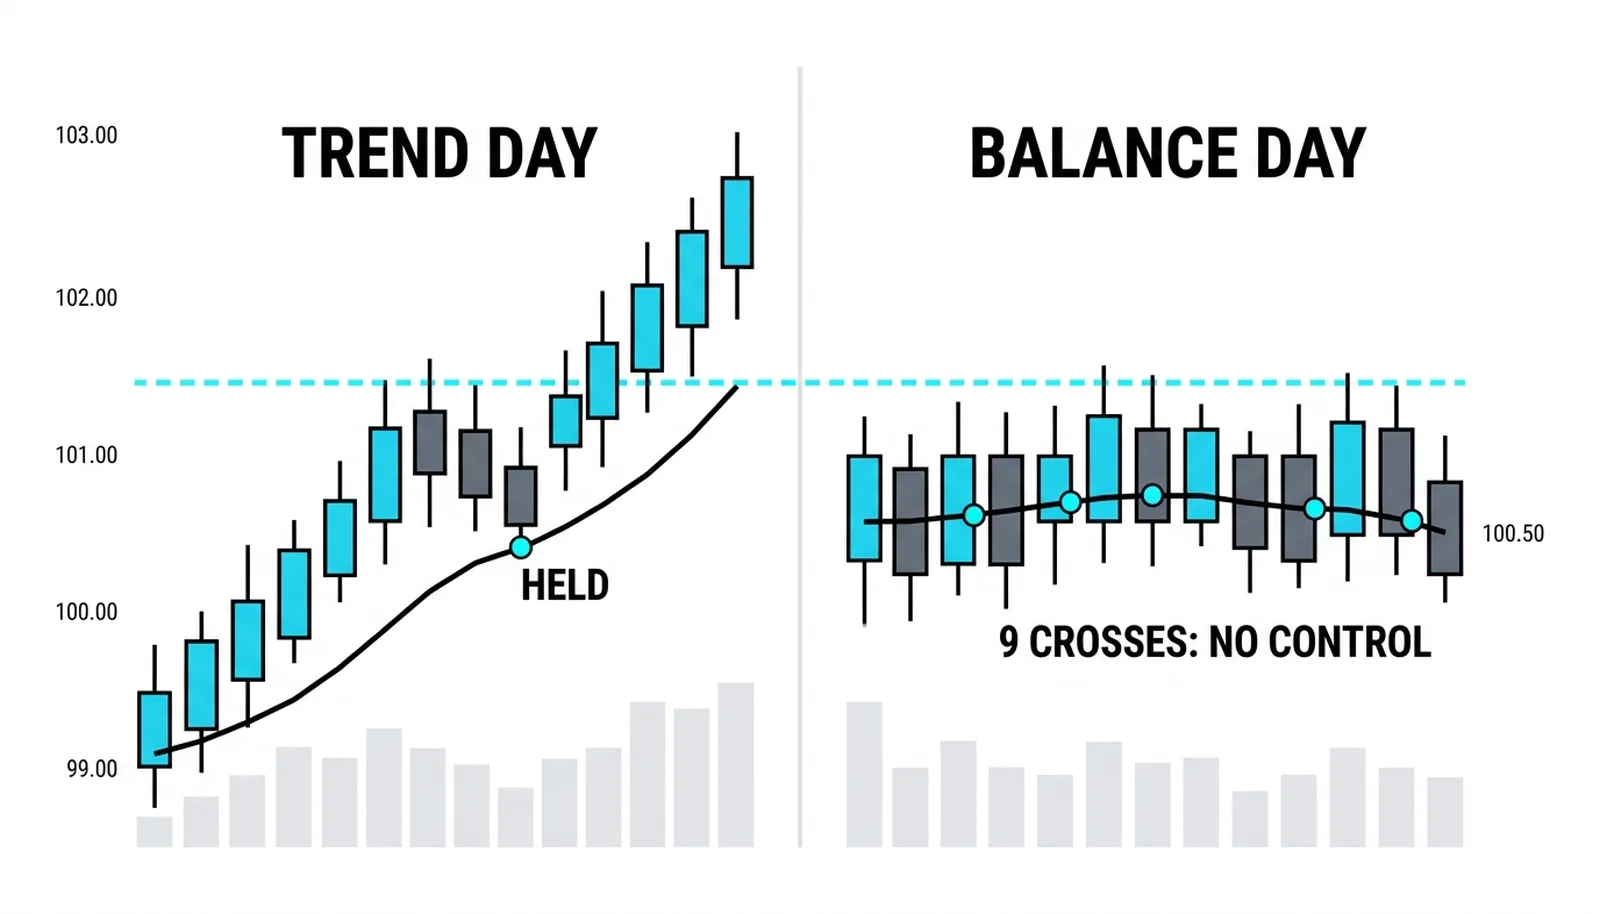
The top panel never looks back: closes hold above VWAP from mid-morning on, which tells you buyers are in control and dips toward the line are being bought. The bottom panel crosses the line nine times, which tells you nobody is in control and the line is fair value, not a launchpad. Same tool, opposite information, and the whole game is identifying which regime you are in.
VWAP also pairs naturally with structure. Static zones mark where price has turned before, while the volume weighted line updates every bar, so many traders read it alongside static versus dynamic support and resistance rather than choosing one or the other. Where a static level and rising VWAP stack in the same price zone, the confluence itself is information.
VWAP, Answered
What timeframe does VWAP use?
It is cumulative from the session open by default, so it lives on intraday charts, and the bar interval you plot it on changes the granularity of the line, never its value. A one-minute chart and a fifteen-minute chart of the same session carry the same VWAP, because both accumulate the same trades. Multi-day and anchored versions extend the idea to longer horizons, and those get their own lessons.
One platform quirk deserves a warning. Some charting packages let you set an arbitrary period on VWAP, which silently turns it into a volume weighted moving average. That tool has uses, though it is no longer the session benchmark, and the reset behavior covered above is gone. Check that your line starts fresh at each session open before drawing conclusions from its level.
Does VWAP work on daily charts?
A cumulative average with no reset date is a different tool. The anchored variant fixes that by choosing a start point, which is where the next lesson picks up.
Is VWAP a support and resistance indicator?
On balance days it behaves like one. On trend days it behaves like a floor or ceiling that price rides. The honest answer is that it is a fair-value line first, and its level behavior is a consequence of the fair value.
Next: trading with VWAP as a dynamic level covers the benchmark rules, the trend-day pullback, and the gap playbook in detail.