High Volume Moves vs Low Volume Moves
High volume moves are price moves carried by well above average participation, and they tend to keep going. Low volume moves are the same price action with nobody behind it, and they tend to stall. Telling the two apart is mostly one habit: compare the volume bar against the move's own recent average, not against any fixed number.

Picture the same chart on two different days. Price pushes through the same resistance level both times. The first push carries triple the usual share count; the second carries less than half. Identical candles, opposite information. A measure passed on 90 percent turnout and the same measure passed on 12 percent turnout are not the same mandate.
What a High Volume Move Tells You
A high volume move means participation is real. Both sides are transacting heavily. Sellers are not absent; they are being absorbed and beaten. When price clears a level on two or three times its average volume, a large number of traders committed actual money to that direction, and that commitment tends to persist beyond the first bar.
This is why breakouts on multiples of average volume tend to extend. The crowd that bought the breakout now has a stake in it working. Pullbacks get defended, because the same participants buy again near their entry. The move develops a base of holders rather than a thin layer of tourists.
A move people pay to join is a different animal from a move nobody joins.
One caution before moving on. High volume confirms the move is real, not that it is safe to chase. A breakout on huge volume can still be extended by the time you see it. Volume tells you the move has backing; your entry timing is a separate problem.
What a Low Volume Move Tells You
A low volume move is drift, not conviction. Price travels because nobody objects, not because anyone insists. The move happens in a vacuum of interest, and vacuums reverse easily.
Low volume breakouts fail more often than they succeed. Price pokes through a level, finds no follow-through, and slides back inside the range. Traders who bought the break are trapped almost immediately, and their exits add fuel to the reversal. This failure is so common that many experienced traders treat a thin breakout as a signal to wait rather than a signal to enter.
In thin markets, even wide bars can be meaningless. A long candle on half the usual volume looks dramatic and means little. The candle body tells you where price went; the volume tells you whether anyone cared enough to carry it there.
Low volume does not always mean weak, though. There is one context where quiet volume is exactly what you want to see, and that is the pullback inside a trend. That case gets its own section next.
The Healthiest Shape a Trend Can Have
The strongest trends breathe in a specific rhythm. Impulse legs, the pushes in the trend's direction, arrive on high volume. Pullback legs, the pauses and dips, arrive on low volume. Effort appears exactly where the trend needs it and disappears exactly where the trend should rest.
That asymmetry is the trend validating itself. Heavy participation on the way up shows buyers keep paying to get in. Light participation on the dips shows holders are not selling; the dip is just the absence of new buyers for a few bars, not the presence of sellers. The two volume signatures together tell a coherent story.
The warning sign is when that shape breaks. If pullbacks start carrying heavy volume, the character has changed. Now the dips are not quiet rests; they are active selling. Someone with size is using the trend's strength to exit. One heavy-volume pullback is a question. Two or three in a row is usually the answer, and the trend is often close to done.
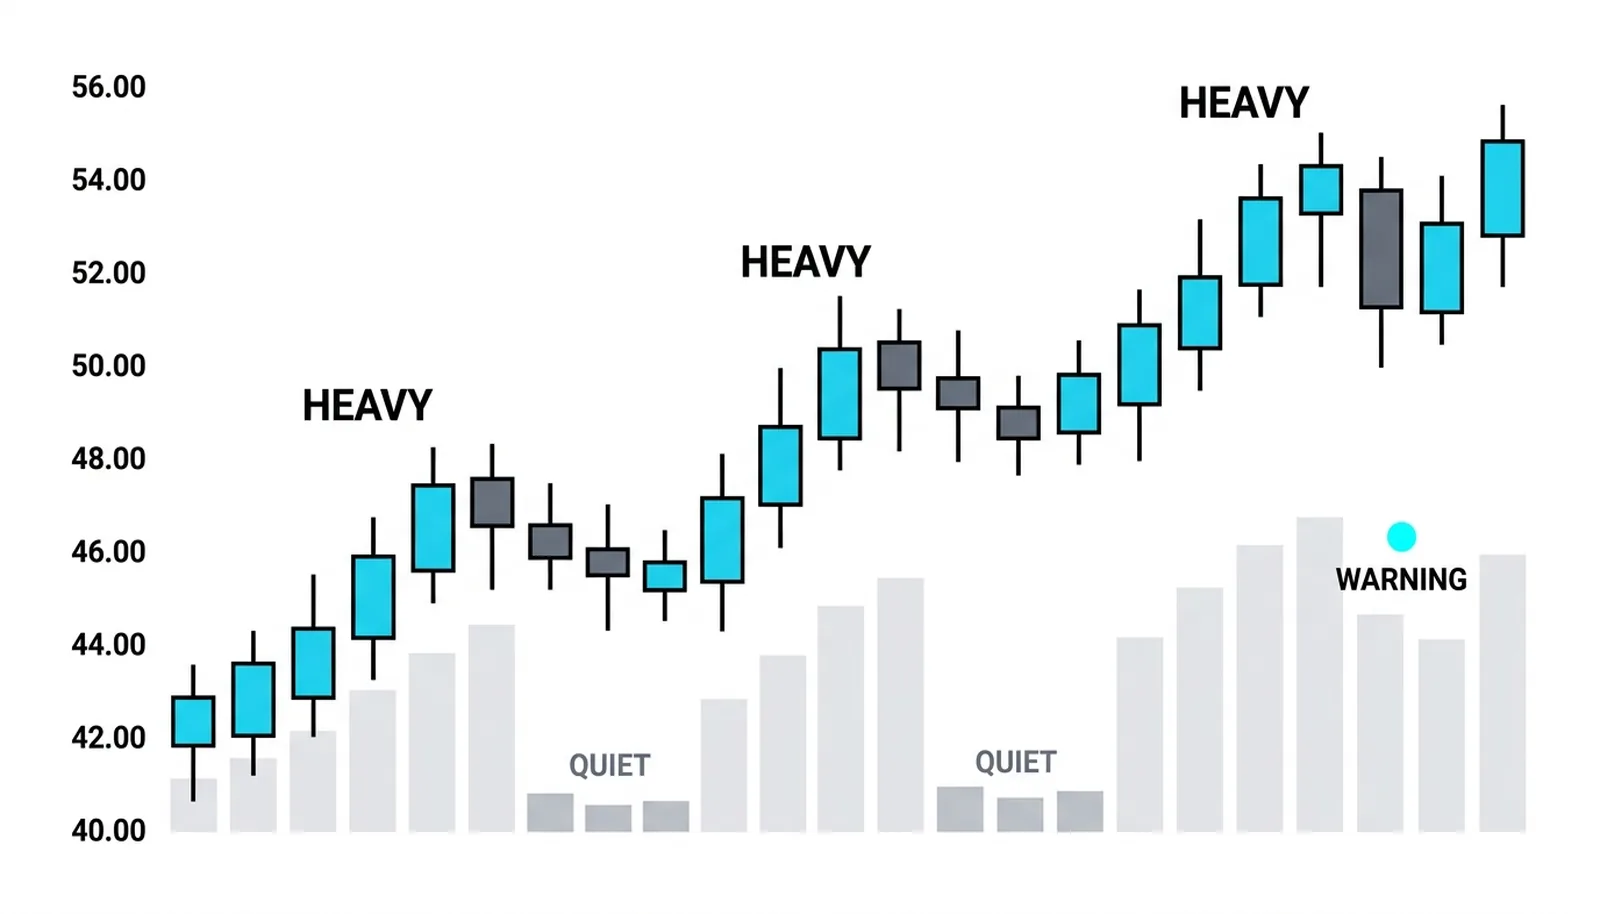
You do not need indicators for this. Volume bars against their own average, read leg by leg, give you the whole shape.
When High Volume Moves Nowhere
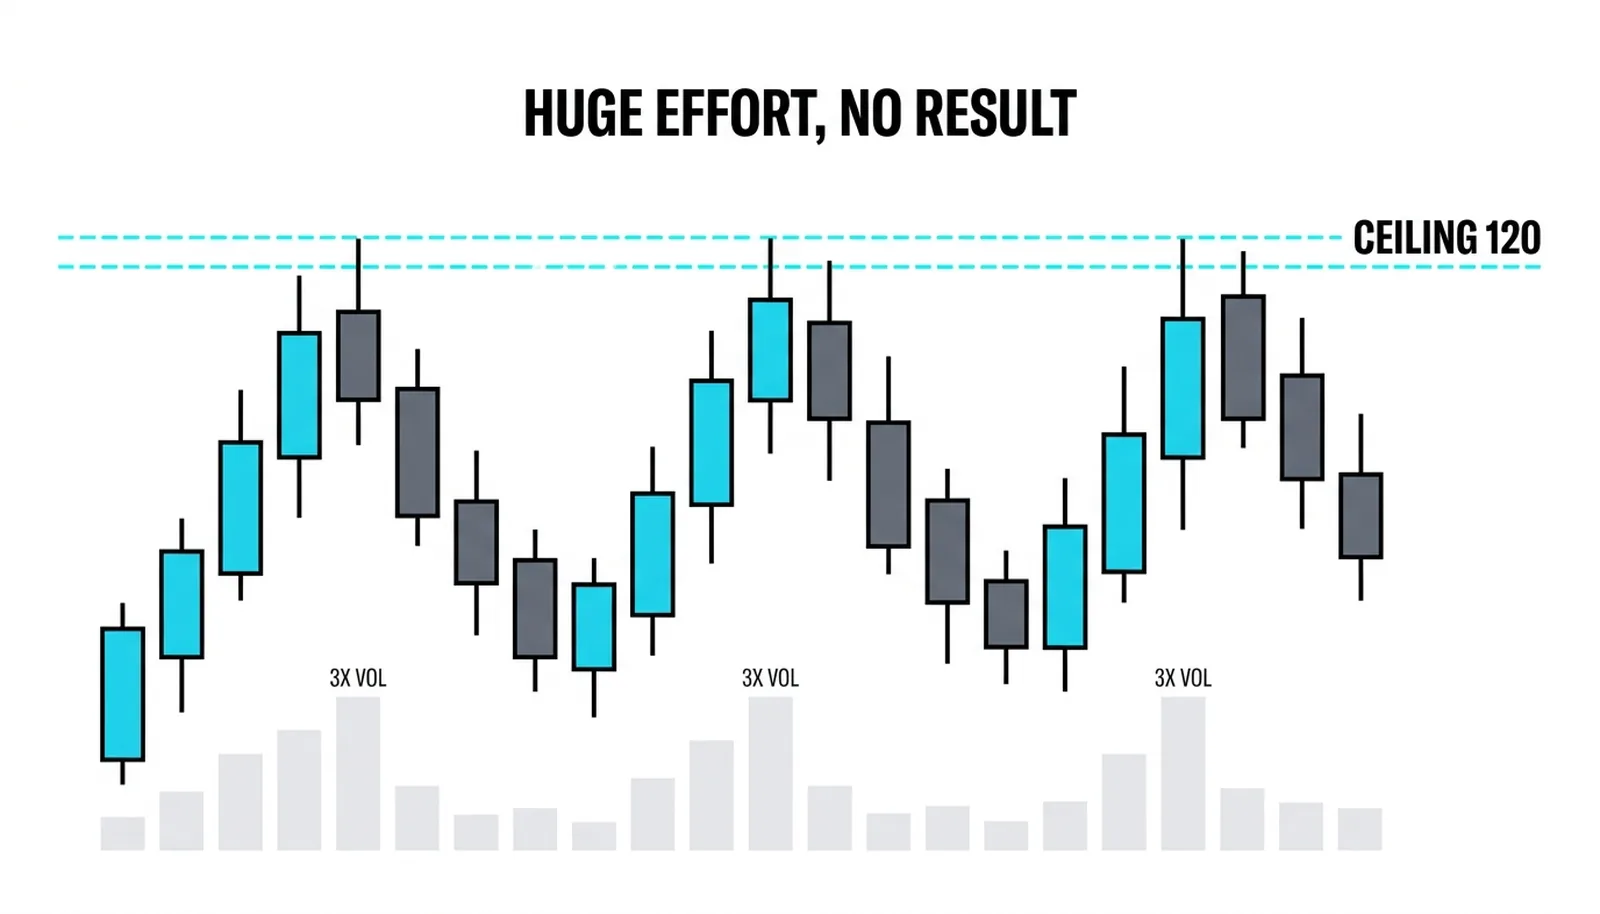
Sometimes you get the opposite puzzle: enormous volume and no price progress at all. Two to three times the average share count changes hands, and price ends the stretch roughly where it began. That is absorption.
Absorption means someone is capping the move. Buyers are pushing hard, and a large seller is meeting every push at the same price. The effort is real; the result is missing, because the seller keeps refilling the wall. The previous lesson covered this effort-versus-result law at the single-bar level, and this is the same law applied to a whole move.
The resolution matters. When the capped side finally gives way, price usually moves hard against the direction that was being capped. A ceiling that absorbed weeks of buying becomes a trap for everyone who bought into it, and their exits accelerate the break. Watch for heavy volume with no progress near obvious levels. It is one of the clearest tells that a level is being defended by size, and it warns you not to assume the move will continue just because participation is high.
Two Breakouts, Two Turnouts
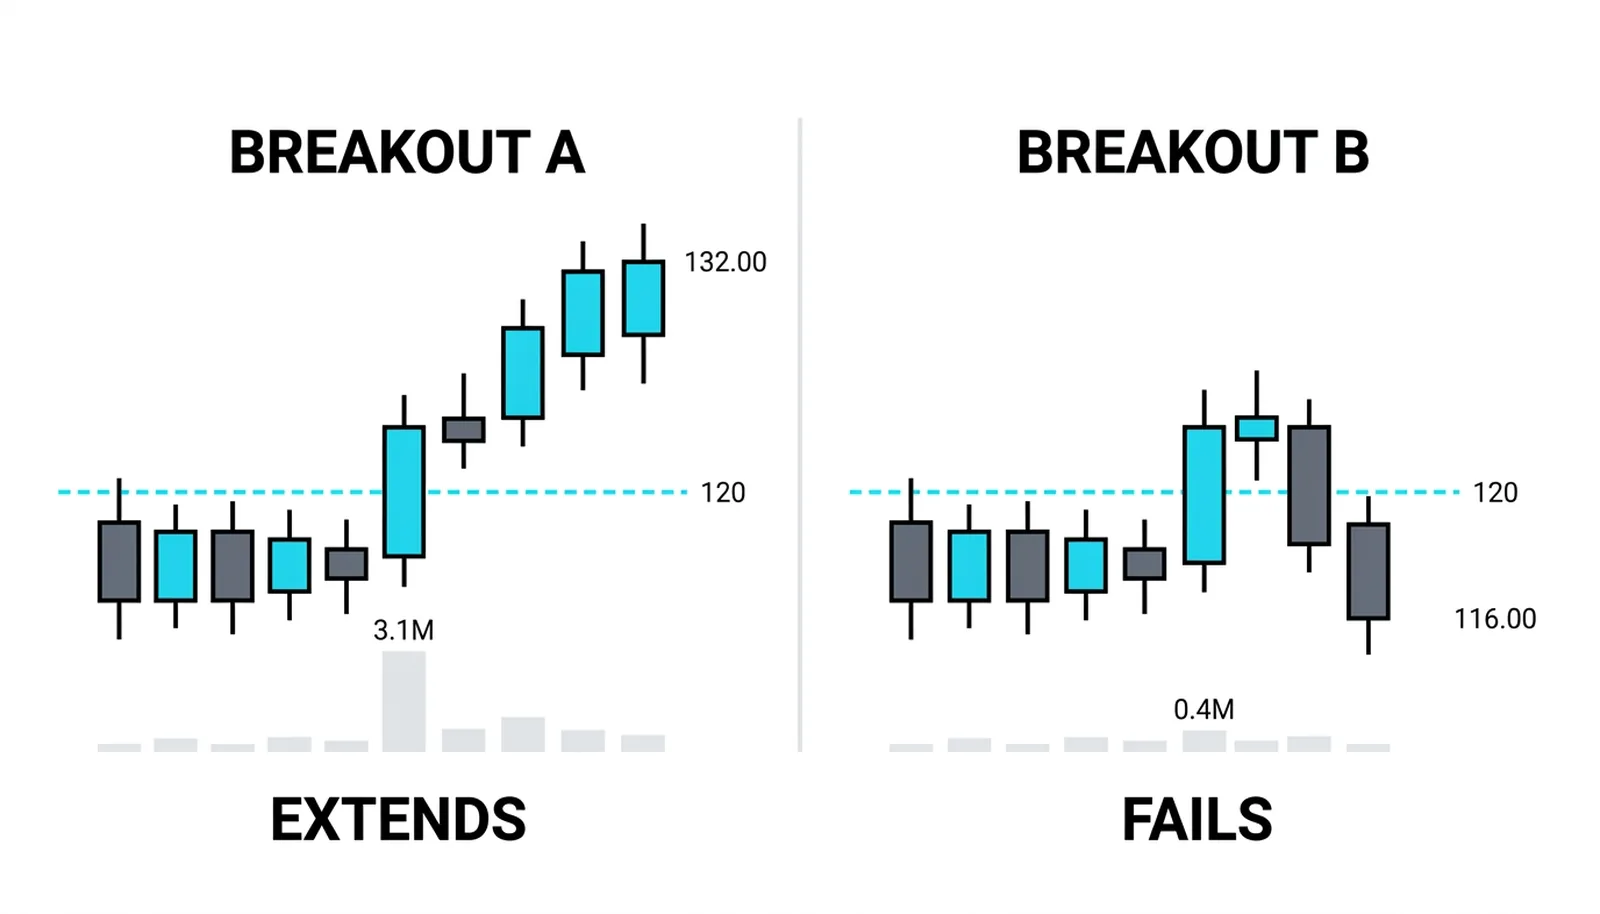
A hypothetical stock averages 1.0 million shares a day and has spent weeks pinned under resistance at 120.
Breakout A: price clears 120 on 3.1 million shares, roughly three times average. Participation is overwhelming. Over the following three weeks, the stock extends to 132, and each small dip along the way prints well under a million shares. The healthy shape holds: heavy impulses, quiet pullbacks.
Breakout B: weeks later, at the same 120 level after a pullback, price clears 120 again, this time on 0.4 million shares, less than half the average. Within two sessions it is back inside the range. Nobody showed up to carry it, and the move collapsed under its own emptiness.
Identical chart levels. Opposite outcomes. The count told you beforehand which breakout deserved your money and which one deserved your patience.
| Move type | Volume signature | What it usually means | The honest follow-up question |
|---|---|---|---|
| High volume breakout | 2x to 3x average or more | Real participation; the break has backing and tends to extend | Is it already too extended to enter at a good price? |
| Low volume breakout | At or below average | Drift through the level; fails more often than it succeeds | Should I wait for a retest that holds on rising volume? |
| High volume pullback | Well above average on the dip | Active selling into the trend; the healthy shape may be breaking | Is this the first heavy dip, or the latest of several? |
| Low volume pullback | Noticeably below average | Quiet rest inside a trend; holders are not selling | Does the next impulse leg arrive on rising volume to confirm? |
High vs Low Volume Moves, Answered
What counts as a high volume move?
A move where the volume bars run well above the instrument's own recent average, with roughly double the 20-day average as a working threshold for "clearly high." The comparison is always against that instrument's own history, never against another stock or a fixed share count.
Are low volume moves always weak?
No. Low volume breakout attempts are weak, but low volume pullbacks inside a trend are healthy and often the best entry points. Context decides the meaning: quiet volume against the trend's direction is rest, quiet volume in the trend's direction is apathy.
Why do low volume breakouts fail?
Because no one committed. A breakout needs follow-through buying after the level clears, and thin volume shows that buying never existed. The first wave of breakout buyers finds itself alone, the price slips back, and their exits push it back inside the range.
Should I compare volume to an average or to yesterday?
To an average. A single day's volume can be an outlier for random reasons, so comparing today only to yesterday can mislead you in both directions. A 20-day average smooths the noise and gives every new bar a fair baseline.
Once you can sort moves by the participation behind them, the next step is spotting the moments when participation itself becomes the signal: volume climaxes, where the heaviest trading of the entire move often marks the move's end rather than its strength.