Up Bar vs Down Bar in VSA
An up bar closes above its open and a down bar closes below it, and in volume spread analysis that color is the least informative thing about the bar. What matters is the volume behind it, the spread it traveled, and where it closed within its range. Whether the candle printed green or red tells you almost nothing on its own.

Two emails can share the same subject line while their bodies say opposite things. Candle color is the subject line. The body is volume, spread, and closing position, and you have to open it before you know what was actually said.
The previous lesson covered the three variables and how to measure them. This lesson applies them to the most basic classification on the chart, the one every trader learns on day one and most never question again.
The Four Reads That Actually Matter
Every bar you will ever see reduces to one of four useful readings. Color is the label. The variables are the content.
Up bar, wide spread, heavy volume, closing near the high. This is genuine demand. Buyers paid up through the whole range, traded in size, and finished at the top. Nobody knocked the price back down. When this bar appears after a decline or at support, it deserves your attention.
Up bar closing off its highs. The candle is green, but the close pulled back from the top of the range. Supply appeared above. Someone used the strength to sell into it, and the bar's upper wick is the evidence. The color says buyers won; the close says the win was contested.
Down bar, wide spread, heavy volume, closing near the low. Genuine selling. Sellers pressed the whole session, volume confirmed real participation, and buyers never mounted a defense. Respect this bar when it appears after a rally or at resistance.
Down bar closing off its lows. The candle is red, but the close recovered from the bottom of the range. Demand appeared underneath. Someone absorbed the selling and pushed the price back up before the close. The color says sellers won; the close says buyers showed up where it counted.
Notice the pattern. In two of the four reads, the color and the verdict agree. In the other two, they point in opposite directions. A coin flip would give you the same accuracy as reading color alone.
What Color Gets Wrong
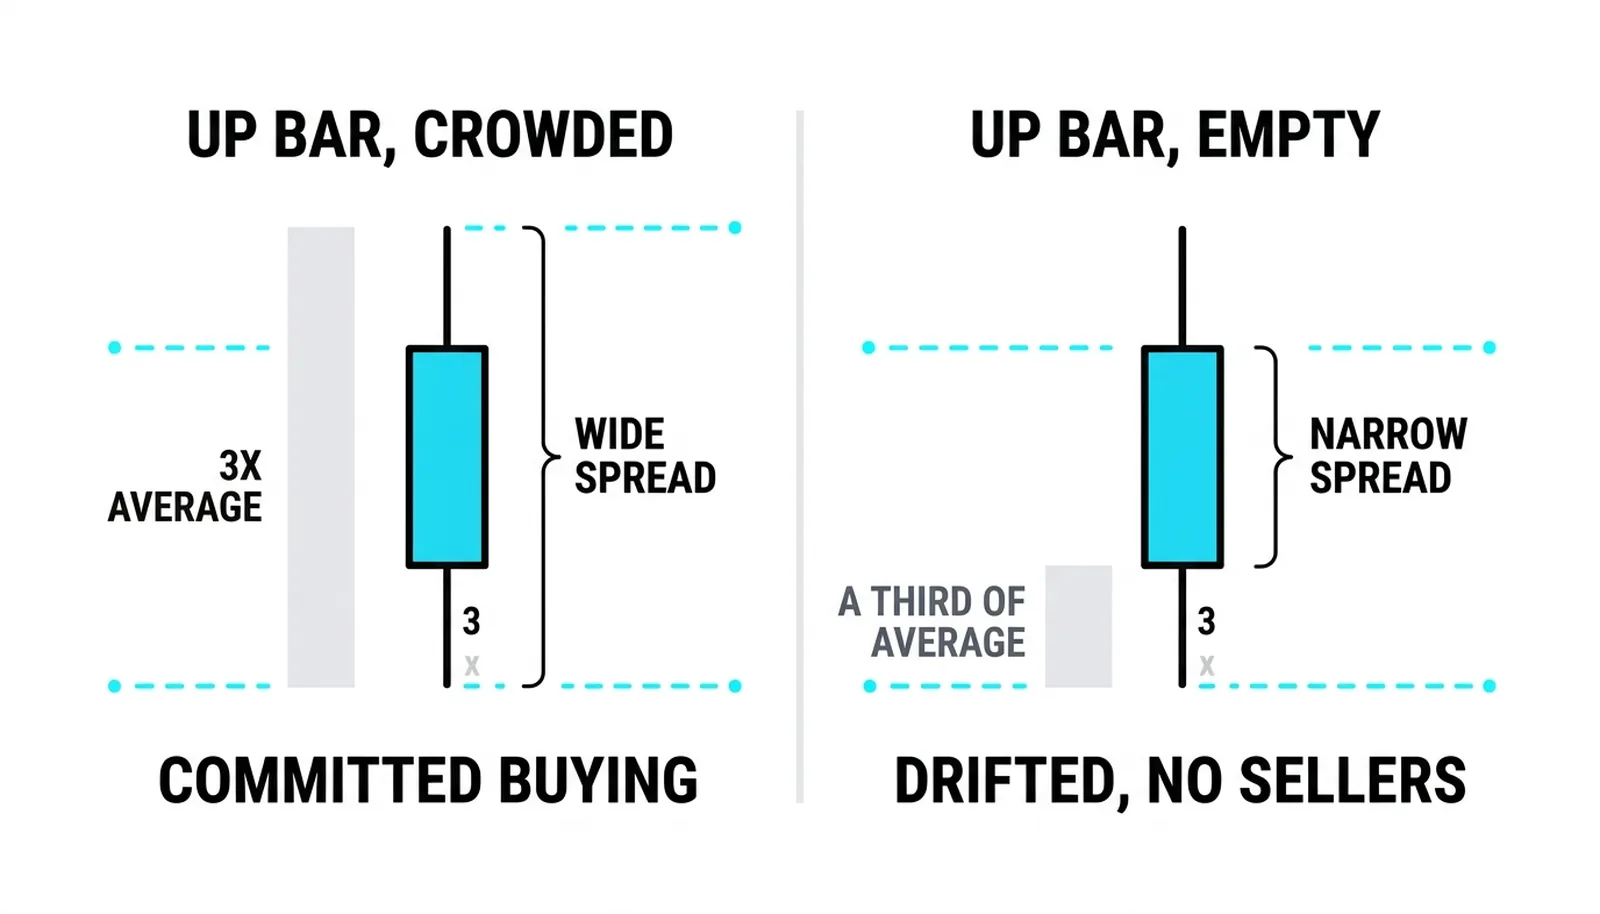
Take two up bars of identical size, both closing at the same price. One traded triple its average volume with a wide spread. The other traded a third of average on a narrow range. Same color, same close, opposite meanings. The first shows committed buying. The second shows a price that drifted up because nobody was selling, which is a very different thing and often a warning.
That quiet up bar matters more than most traders realize. A green candle on thin volume and a narrow spread, especially after a rise, is the seed of the no-demand pattern you will study two lessons from now. The bar looks harmless. It is often the first sign that buyers have run out of conviction.
The mirror image is the quiet down bar inside a pullback. Price dips on shrinking volume and a narrowing spread. Sellers are not pressing; they are absent. That bar is the seed of the no-supply pattern, and it frequently marks the exact spot where an uptrend resumes.
The trap is color-only trading, and it is the habit to break. An up bar can be the strongest evidence of demand on the chart or the weakest, and the candle's color cannot tell you which. A green candle is a claim, not a fact.
Closing Position Changes the Story
Volume and spread tell you how hard both sides fought. The closing position tells you who won.
Take a wide bar on heavy volume that closes mid-range. Both sides showed up in size and fought to a draw. The effort was enormous and the result was nothing. That bar is a standoff, and it usually resolves in the direction of the next strong bar.
Now take the same bar, same volume, same spread, but closing at the extreme. One side absorbed everything the other side offered and still finished on top. Same effort, decisive result. These two bars can look nearly identical at a glance and mean completely different things.
This is why the close carries so much weight in VSA. Volume measures participation. Spread measures movement. Closing position is what turns the color into a verdict. Without it, a green candle near the top of its range and a green candle at the bottom of its range look the same to anyone reading color alone.
Train yourself to see the close as the settlement of the session's argument. Everything above the close on an up bar was rejected. Everything below the close on a down bar was rejected. The wick is the record of what failed.
A Simple Bar-Reading Order
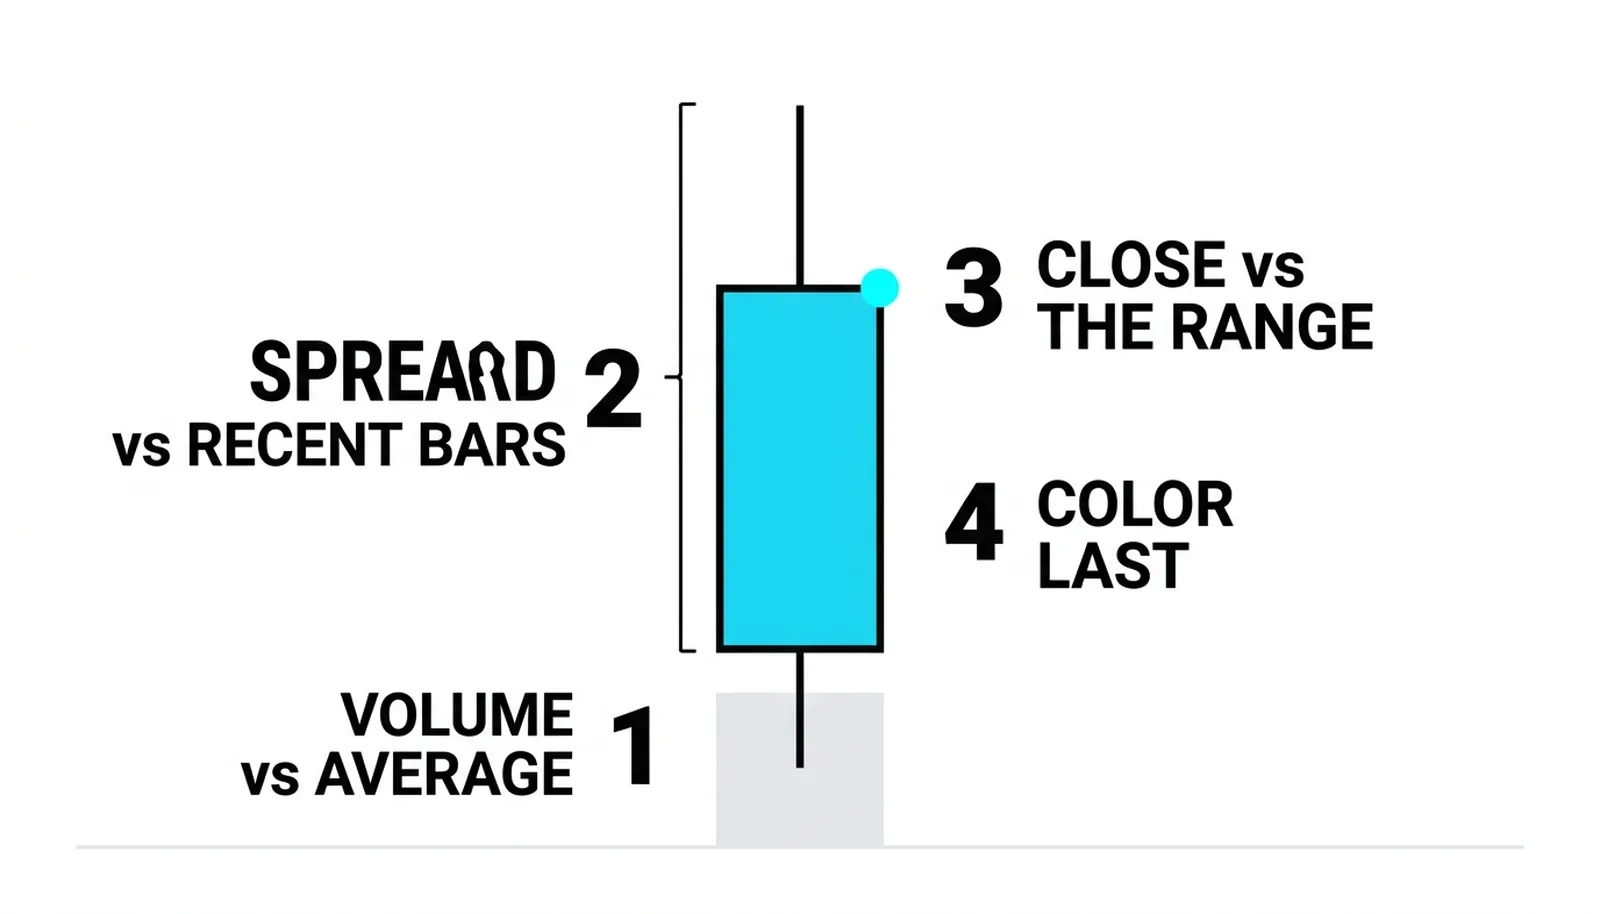
Sequence matters because color is the easiest thing to see and the hardest thing to ignore. Put it last and it stops contaminating your judgment. The checklist:
- Volume against average. Is participation heavy, normal, or thin compared with recent bars?
- Spread against recent bars. Is the range wide, average, or narrow for this instrument?
- Close against the range. Did the bar finish near the high, near the low, or in the middle?
- Color last. Only now note whether it was an up bar or a down bar.
Work through the first three steps and the fourth usually confirms what you already concluded. When it contradicts your read, trust the first three. Read the bar, then check the color, and notice you rarely needed it.
Two Green Candles, One Chart
Everything below is a hypothetical illustration with invented round numbers.
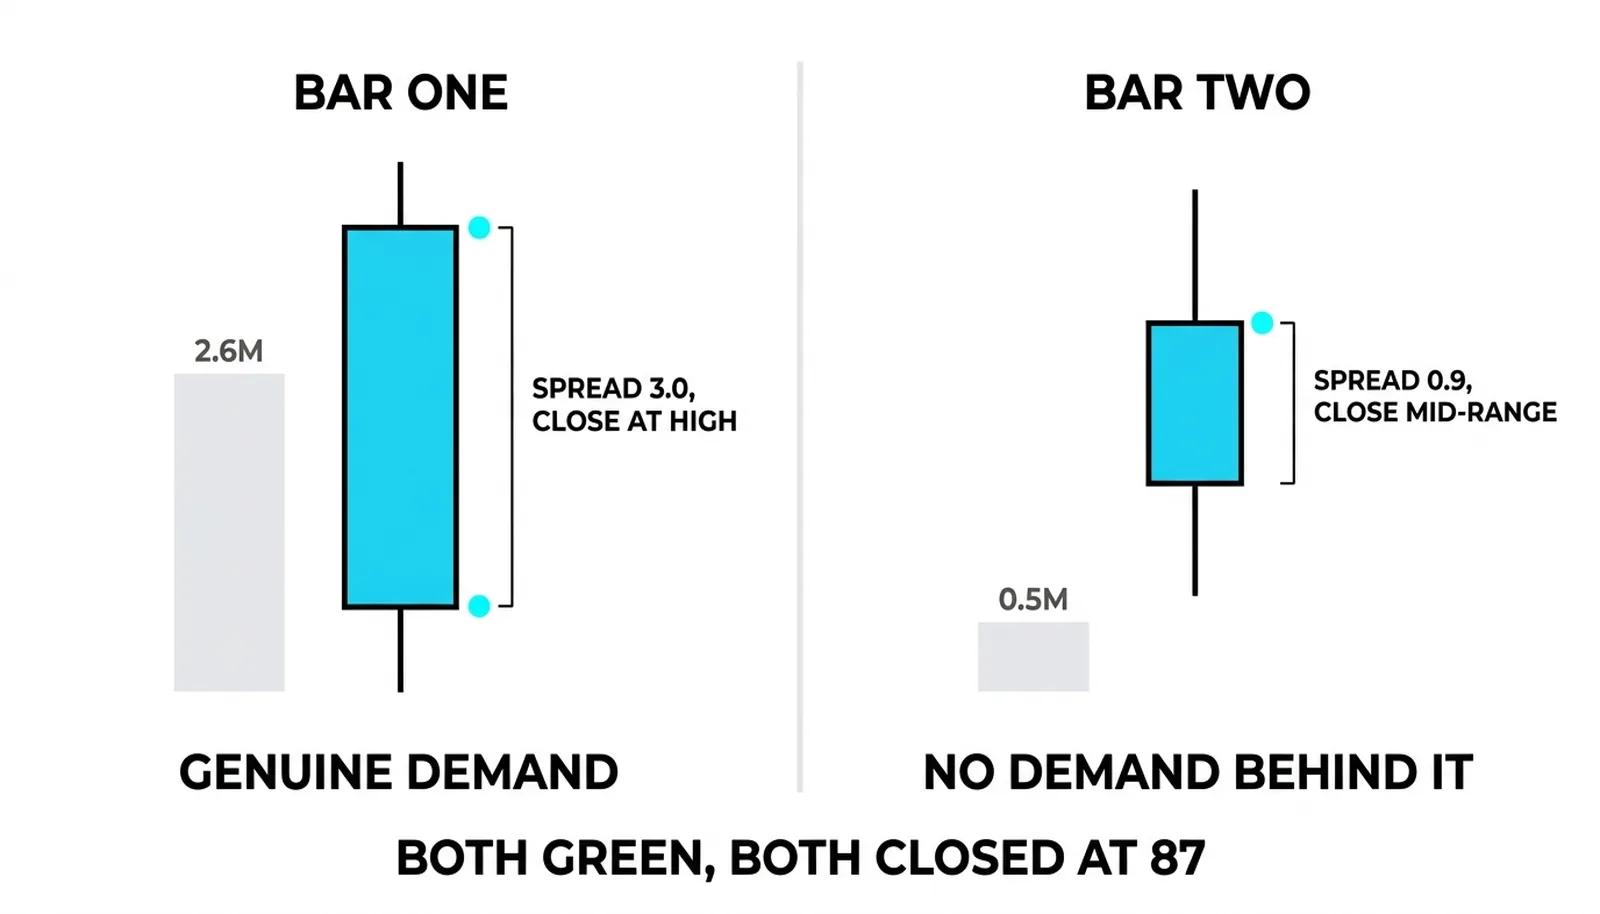
A stock closes two sessions up 1.2 points each. Both candles are green. Both close at 87. A trader reading color sees two identical bullish bars.
Bar one prints on 2.6 million shares, well above the stock's recent average. The spread is 3.0 points, the widest in two weeks. The close sits at the session high. Heavy participation, wide movement, finish at the top. Demand validated. Real buyers paid real size to own this stock, and nobody sold them back down.
Bar two arrives three days later, at an old resistance level. Volume is 0.5 million shares, a fraction of average. The spread is 0.9 points. The close lands mid-range. Nobody paid for the push. Price drifted up on absence of selling, stalled at resistance, and gave back half its gain before the bell. Same color, same close price, opposite verdicts.
| Bar | Volume | Spread and Close | Verdict |
|---|---|---|---|
| Bar one | 2.6 million shares | 3.0 spread, closed at the high | Genuine demand |
| Bar two | 0.5 million shares | 0.9 spread, closed mid-range | No demand behind the rise |
| Color | Both green | Both closed at 87 | Identical and useless |
| Read order | Volume first | Spread and close next | Color last |
The second bar is the one that hurts traders who read color. It looks like continuation and behaves like exhaustion. The three variables saw it coming. The color hid it.
Up Bar vs Down Bar, Answered
What is an up bar?
An up bar is any candle or bar that closes above its open. It tells you price finished higher than it started and nothing more. Its meaning comes from volume, spread, and closing position.
What is a down bar?
A down bar closes below its open. Like the up bar, the label alone carries no trading information. A down bar on heavy volume closing at its low is real selling; a down bar on thin volume closing off its lows can be quietly bullish.
Does candle color matter in volume spread analysis?
Barely. Color is the last variable checked, not the first. Two bars of the same color can carry opposite meanings, and the deciding factors are always volume, spread, and where the bar closed within its range.
What makes an up bar trustworthy?
Heavy volume, a wide spread, and a close near the high. That combination shows buyers participated in size and finished in control. An up bar missing any of those three elements is a claim waiting to be tested, not evidence.
Next the framework gets sharper: the two bars where color is most misleading of all, the no-supply and no-demand bars, where the most important signal is the volume that never showed up.