The D-Shape Profile: Reading a Balanced Day
The word "balanced" is doing real work here: the D-shaped profile is the bell-shaped day, fat through the middle and thin at both ends, and it is the picture of a market that found a fair price early and kept returning to it. Balanced trade is the most common market condition you will ever see on a profile, and it is also the least directional signal on the board. Most sessions resolve nothing, and the D is what "nothing resolved" looks like when you draw it.

The two previous lessons covered the P-shape and the B-shape, the initiative days where one side drives a tail and leaves its mark. This lesson owns the third and most common day type, the D, and it works by different rules. Picture a roundabout at rush hour: traffic circling one center and leaving in every direction, nothing piling up at any single exit, the flow only jamming when someone stops circling and forces the issue. That is a balanced day. Everyone passes through, nobody takes control, and the trouble only starts when a trader insists on a breakout that the day never promised.
What the Bell Curve Is Saying
The D-shape shows an auction that agreed on value and rotated around it. Price sweeps up to the value area high, gets rejected, sweeps down to the value area low, gets bought, and closes near the fairest price of the session. The heaviest volume sits in the middle, at the point of control, because that is where both sides kept agreeing to trade.
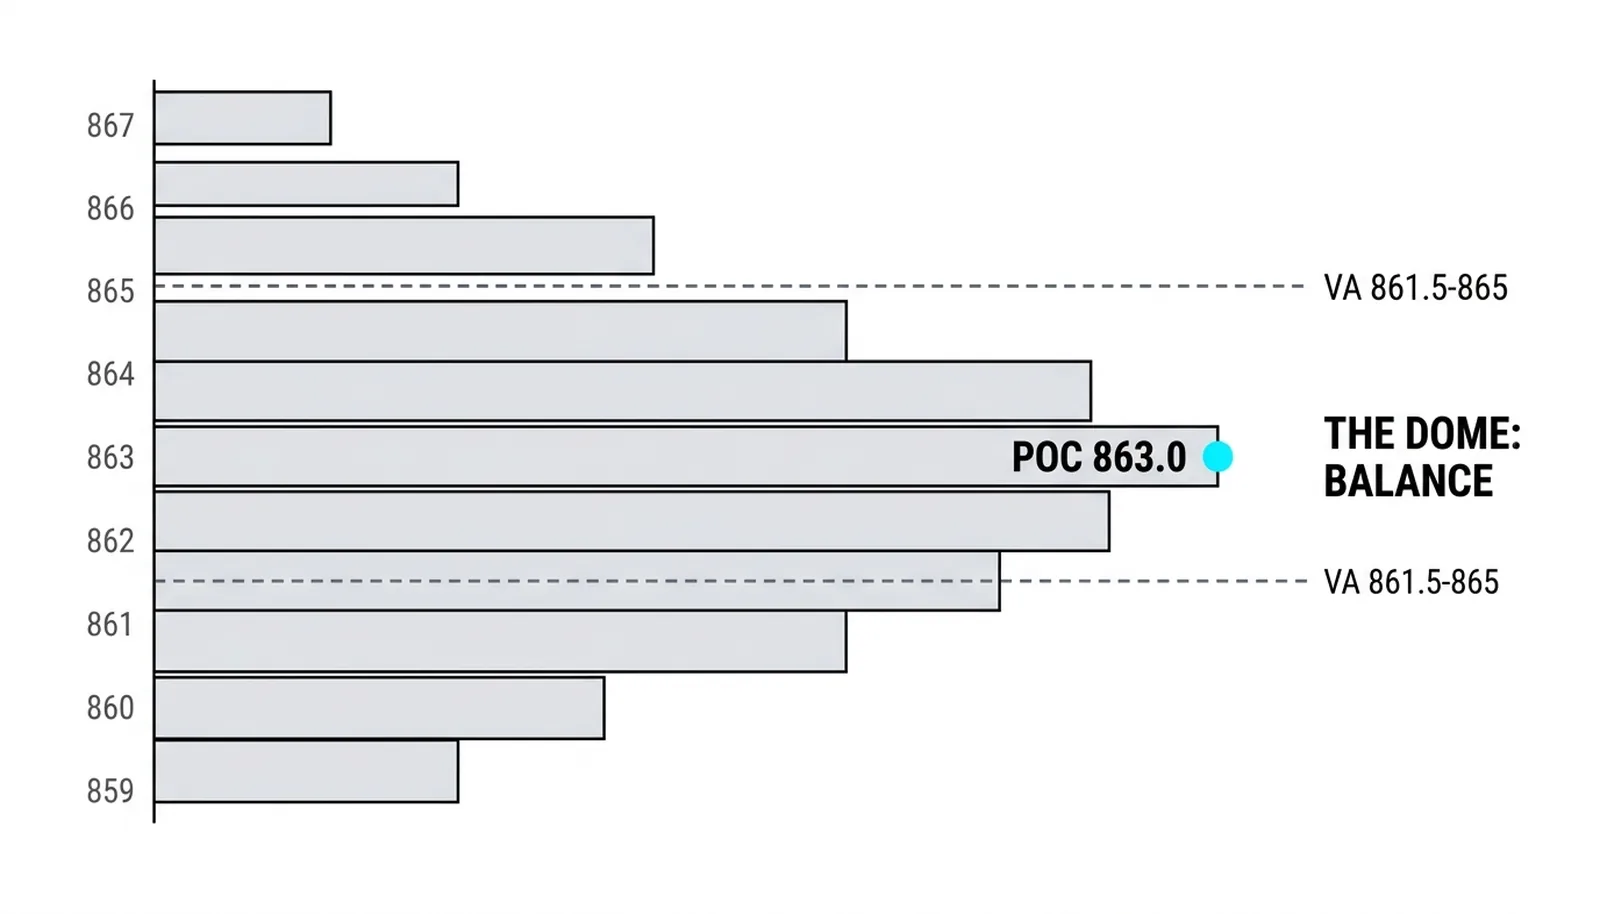
Market profile practice frames this with the dome: the more time the market spends distributing around a price, the larger the dome grows, and the stronger the acceptance that dome represents. Time plus volume at one region is not indecision in the weak sense. It is acceptance in the strong sense. The market looked at that price from above and below and kept saying yes.
Read the shape literally. Thin tails at the top and bottom mean probes that found no followers. The fat middle means the auction was content. A D day is the market telling you where it thinks fair value sits, with unusual clarity, and then doing nothing dramatic about it.
That clarity is the trap. A clear statement of fair value is not a statement of direction, and traders who confuse the two donate money on quiet days.
Why Balance Forms
Balance forms when the early range is wide enough to satisfy both sides. Buyers get filled low, sellers get filled high, and neither side feels the need to push further. Once that two-sided trade is established, the session tends to keep rotating inside it, because every push away from the center meets responsive orders waiting to fade it.
The classic producer of a D day is uncertainty. A scheduled announcement lands tomorrow, an earnings release or a policy decision, and nobody with real size wants to commit before the information arrives. Both sides trade responsively. Neither initiates. The result is a session that looks busy on the tape and says almost nothing about the future.
Low-conviction periods produce the same shape without any scheduled catalyst. After a strong trending week, the market often pauses into balance simply because the easy move already happened and the next impulse needs new information. The D is the resting state of the auction, not an accident.
Two honesty beats belong here. First, a D alone carries no direction at all. It is the most common shape precisely because most days resolve nothing, and treating every bell curve as a setup is how traders overtrade quiet sessions into losses. Second, the same shape means opposite things in different locations. A D that forms after a long rally can be rest before continuation, or it can be distribution at the top. The profile shape cannot tell you which. Only where the D forms, and what value does the following day, answers that question.
Trading a D Without Fighting It
On a balanced day, rotation beats breakout attempts. The natural trade is fading the value area edges back toward the point of control: sell the probe into the value area high when it stalls, buy the probe into the value area low when it holds, and take profits near the middle rather than waiting for a trend that the day has not offered.
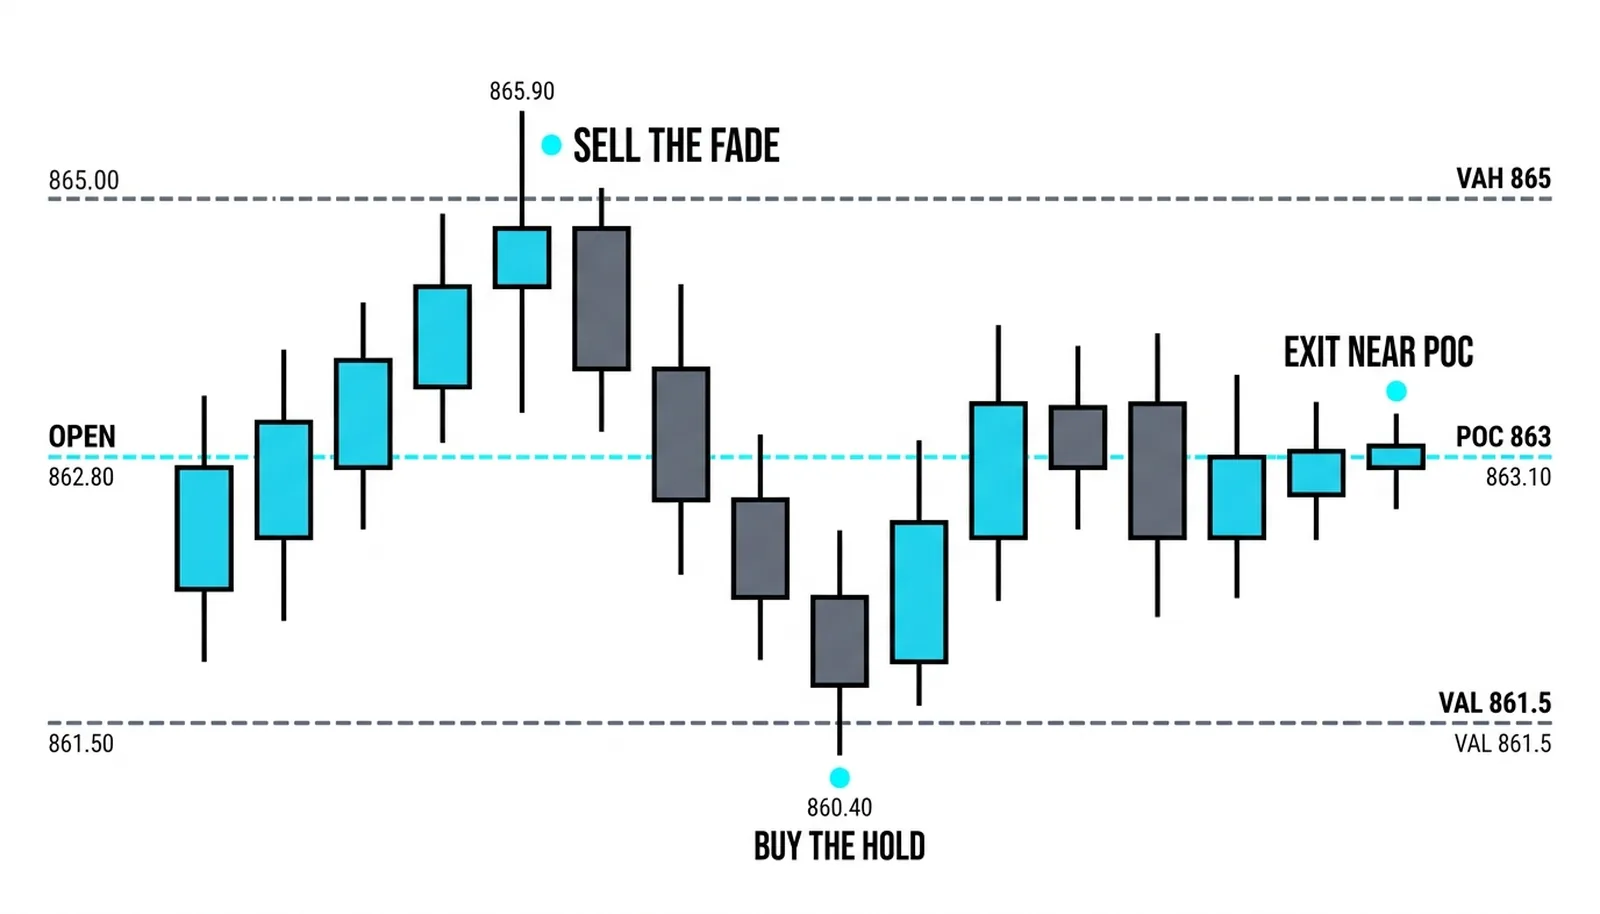
The natural loss is the mirror image. Buying new highs into the dome means buying the exact price where responsive sellers have been reloading all session. Chasing a breakout on a D day is betting that the one condition the shape has been denying all day will suddenly appear at the moment you pay for it.
Stops on edge fades belong just outside the extreme of the probe, because a real break of the edge is the signal that balance may be ending. Targets belong at the point of control, not beyond it. If the edge breaks with initiative volume and holds, the day type has changed and the fade logic is void. Respect that transition instead of averaging into it.
Size matters here too. Rotation trades are high-frequency, modest-reward trades, so costs and slippage eat them faster than trend trades. If the value area is narrow, the rotation often is not worth trading at all. Sitting out a tight D is a position.
One Balanced Day, Start to Finish
All numbers here are invented round figures for illustration. A stock opens at 862.8. By mid-morning it rallies to 865.9 and gets rejected, hard, with sellers appearing the moment price stretches above the developing value area. Early afternoon it slides to 860.4 and gets bought just as quickly. It closes at 863.1, almost exactly where the day has been telling you fair value sits.
The session profile prints its heaviest bin at 863.0, with roughly seventy percent of the day's volume between 861.5 and 865. The tails above and below are thin. That is a textbook D: a wide early range that satisfied both sides, then hours of rotation around 863.
Two traders took opposite lessons from the same tape. A breakout buyer who chased 865.9 sat through an immediate rejection and watched the position sink back through the value area, paying the dome's sellers for the privilege. A trader who faded the value area high back toward 863 banked the rotation, because the trade aligned with what the day was actually doing instead of what the trader hoped it would do.
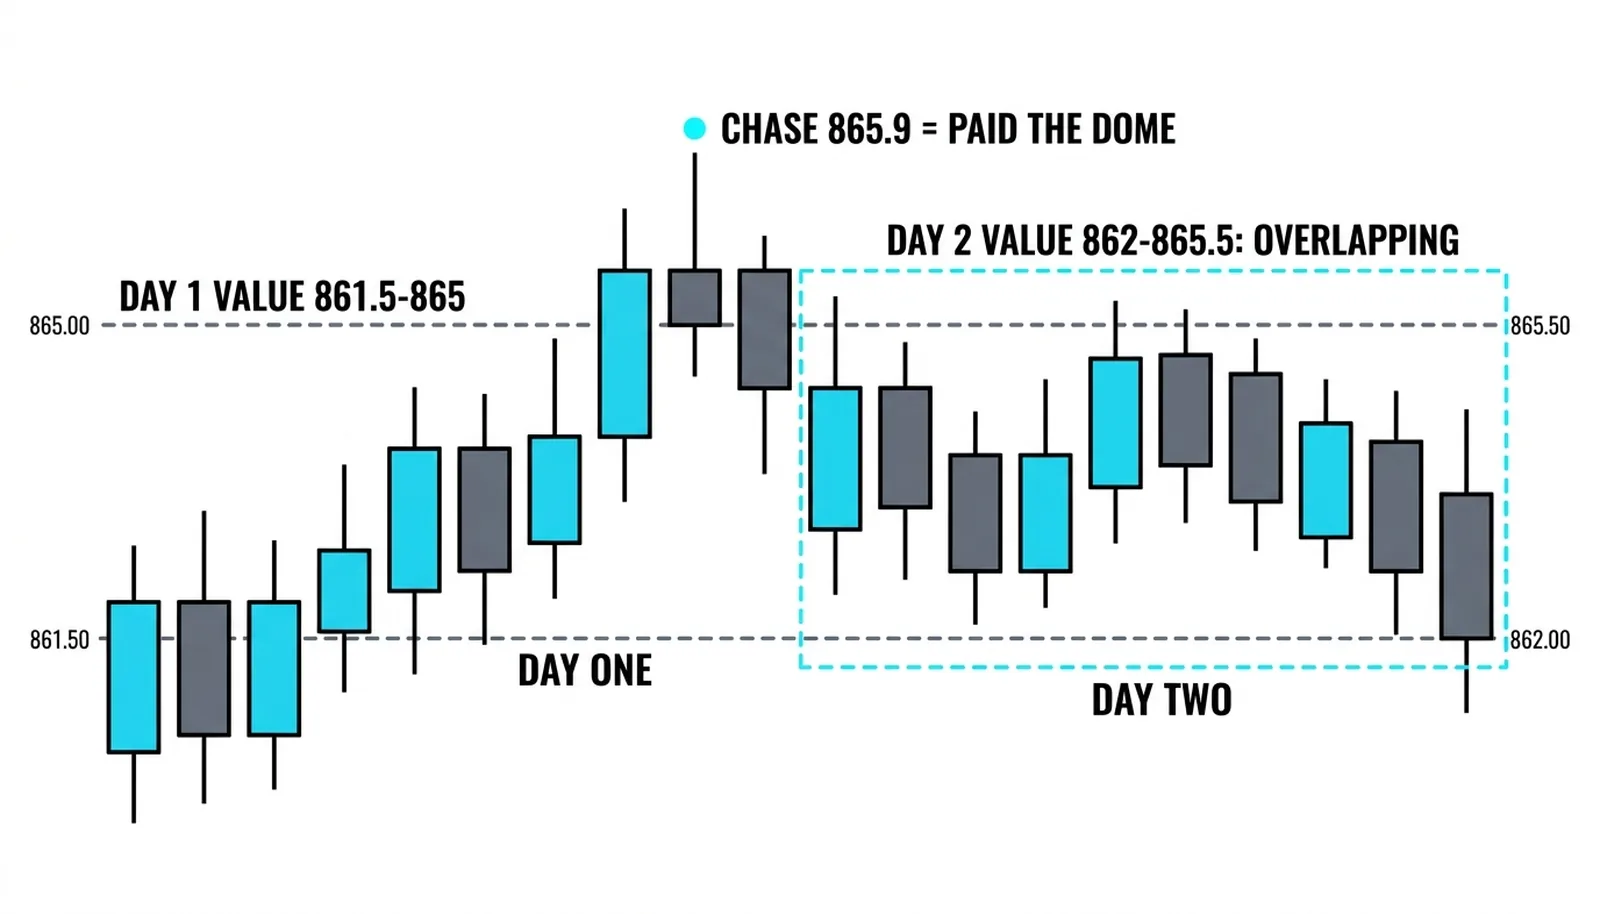
The next day opened at 864.2 and built value from 862 to 865.5, overlapping the prior day's value area almost entirely. Overlapping value is the confirmation: balance held, no migration, no new information priced in. The two-day read is one continuous auction agreeing on the same region. A directional trader waits for value to break away from that overlap before committing. Until then, the edges are the trade and the middle is the exit.
| Day type | Shape | Where the volume sits | The signal |
|---|---|---|---|
| P-shape | Fat base, thin top | Low in the range | Buyers drove up and held; initiative buying |
| B-shape | Thin base, fat top | High in the range | Sellers drove down and held; initiative selling |
| D-shape | Bell curve, fat middle | Centered at the point of control | Balance and acceptance; no direction given |
| Double distribution | Two fat zones, thin middle | Two separate regions | Value relocated mid-session; trend within the day |
The D-Shape Profile, Answered
What is a D-shaped profile in trading?
A D-shaped profile is a session where volume distributes in a bell curve, heavy through the middle and thin at both extremes, showing that the market accepted one price region as fair and rotated around it all day. It is the most common profile shape because most sessions resolve nothing.
What does a balanced profile day mean?
A balanced day means buyers and sellers agreed on value and neither side initiated a sustained move away from it. It tells you where fair price sits with unusual clarity, and it tells you nothing about direction on its own. Location and the following day's value answer the direction question.
How do you trade a D-shaped profile?
Trade the rotation, not the breakout. Fade probes of the value area high and low back toward the point of control, place stops just outside the extremes, and take profits near the middle. Refuse to chase new highs or lows into the dome, because that is where responsive orders reload.
What is the difference between a D-shape and other profile shapes?
The P and B shapes are initiative days where one side drives price and leaves a tail, carrying directional information. The D is a responsive day where both sides fade moves back to the center, carrying location information instead. Double distribution sits between them, showing value relocating within one session.
Once you can spot balance on sight, the next skill is reading what happens inside it: the low volume nodes where price travels fast and the high volume nodes where it stalls. Those two features turn the profile from a day-type label into an actual map of where trades are easy and where they are expensive, and that is where this block goes next.