Unemployment Rate and Jobless Claims
The unemployment rate is the share of the labor force without work, published once a month, while jobless claims are the weekly count of people filing for unemployment benefits. Think of the unemployment rate as a photograph taken once a month and jobless claims as the video feed running between photos. The photograph is complete and carefully framed. The video is rough, shaky, and constant. Together they tell you whether the labor market is healing or cracking long before any single payrolls print settles the argument.

Labor sits at the center of macro policy because jobs are how growth reaches households. When people work, they earn, spend, and pay taxes. When they stop working, spending contracts and the whole demand side of the economy softens. The Fed's dual mandate and why policymakers watch employment were covered in the central bank lessons, so we will not re-derive that here. What matters now is the plumbing of the two labor series traders check most often.
You already met nonfarm payrolls in the NFP lesson. That lesson treated the unemployment rate and jobless claims as companions. This lesson owns them.
The Unemployment Rate: What It Actually Tracks
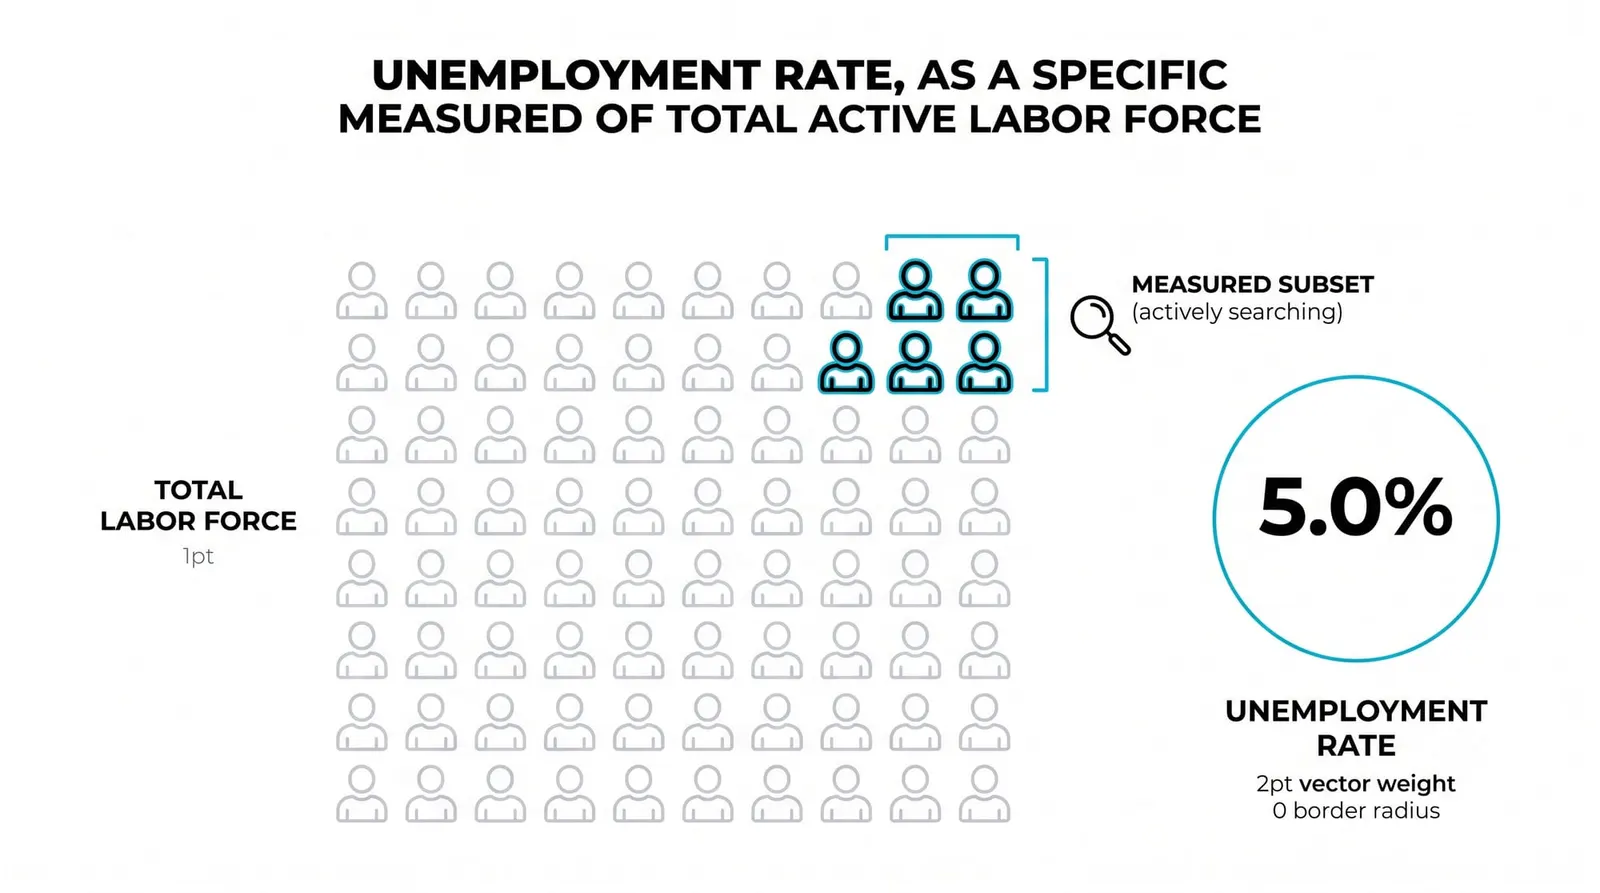
The unemployment rate comes from a monthly survey of households, not from employer records. Interviewers ask tens of thousands of households who worked, who looked for work, and who did neither. The rate is the number of unemployed people divided by the labor force.
Those definitions carry real weight. To count as unemployed, a person must have no job and have actively searched for work in recent weeks. A person with no job who stopped looking is classified as out of the labor force entirely. They vanish from both the numerator and the denominator.
This creates a strange mechanical effect. The participation rate, the share of the population in the labor force, moves the unemployment rate in ways that say nothing about hiring. If 100 people are in the labor force and 5 are unemployed, the rate is 5 percent. If 2 of those 5 stop searching, the labor force shrinks to 98 and the unemployed to 3. The rate drops to about 3.1 percent. Nobody found a job.
So read a falling rate with suspicion until you know why it fell. A decline driven by hiring is strength. A decline driven by discouraged workers leaving the labor force is a worse story wearing a better number. Check participation alongside the headline every single month.
Jobless Claims: A Faster, Rougher Signal
Every week, two claims numbers publish. Initial claims count people filing for unemployment benefits for the first time. Continuing claims count people still receiving benefits in the following weeks. Initial claims tell you about layoffs arriving. Continuing claims tell you how long people stay unemployed once they lose a job.
Because the weekly series is noisy, analysts lean on the four-week moving average of initial claims. Holidays, weather, and one-off events distort single weeks. A plant retooling or a storm can spike one print without meaning anything. The four-week average strips most of that out and shows the underlying drift.
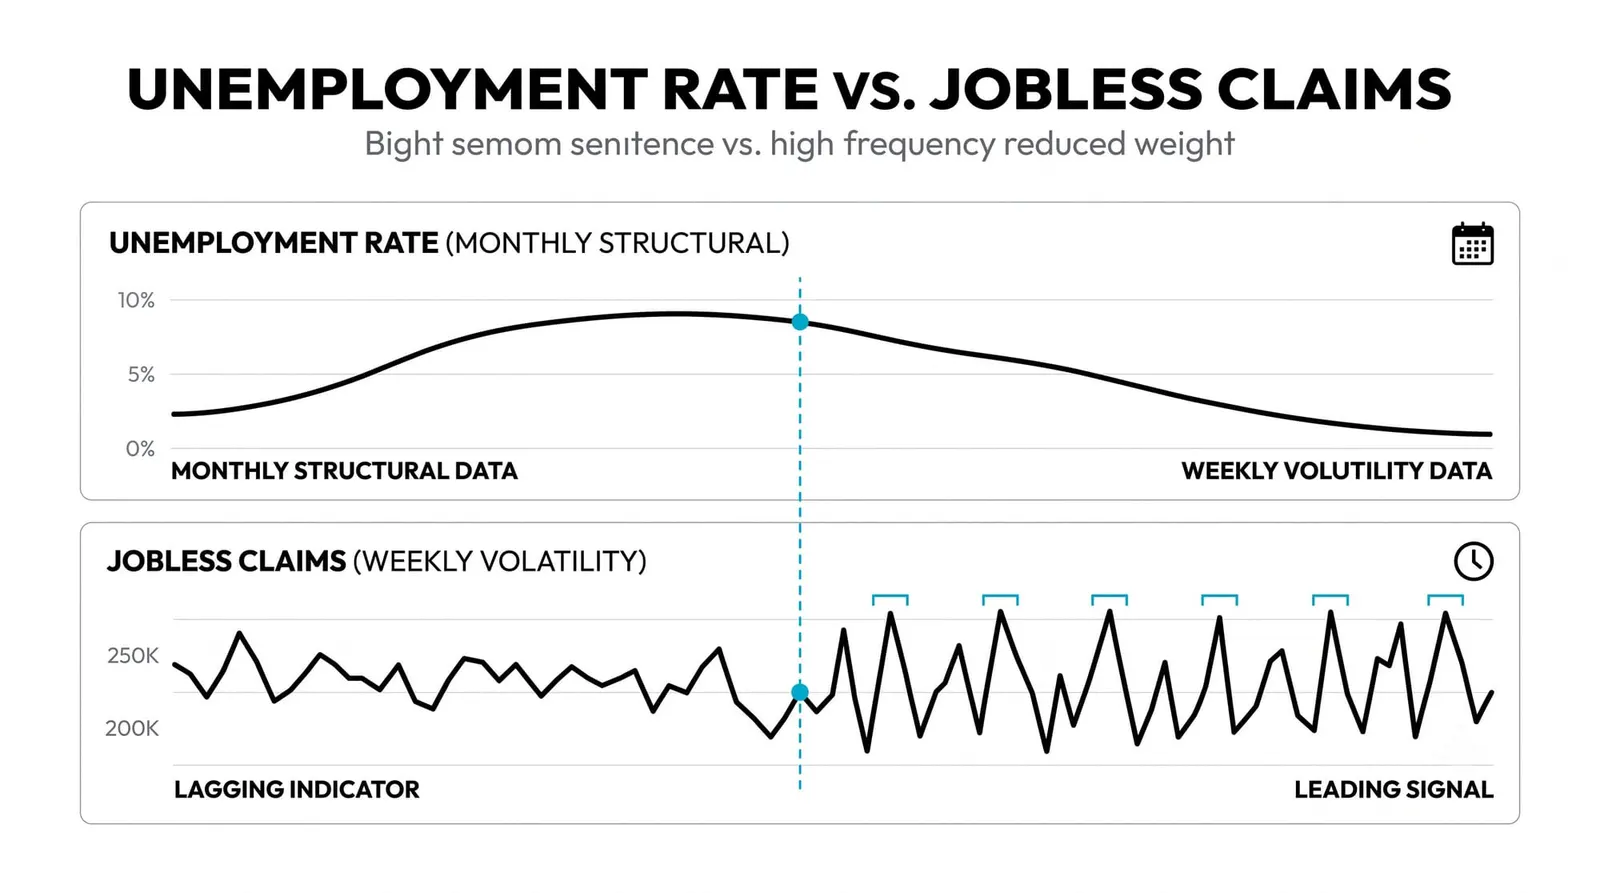
Claims are high frequency, revised, and rough. But they turn fast. When an economy rolls over, layoffs show up in claims within weeks, while the monthly survey takes longer to confirm it. Speed is the entire reason traders tolerate the noise.
Why These Two Reports Read Differently
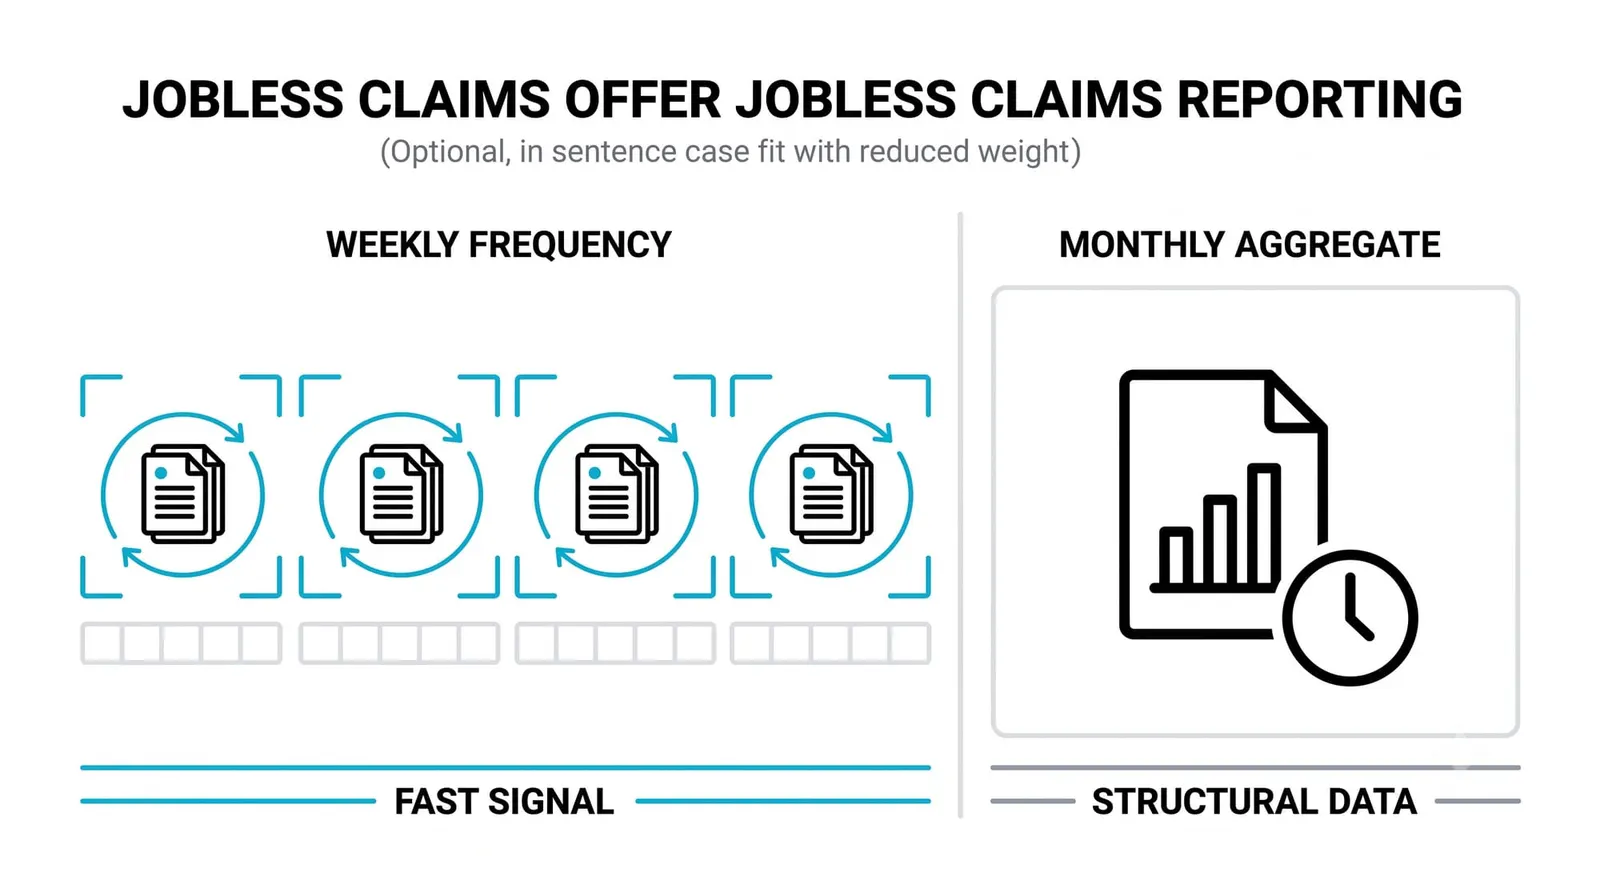
The two series come from different machines. The unemployment rate is a survey of households, built from interviews and statistical estimation. Jobless claims are administrative records, actual filings processed by state agencies. One measures a concept. The other counts paperwork.
Because of that, they can disagree for weeks at a time. A laid-off worker who does not qualify for benefits appears in the survey but never in claims. A worker who files a claim but finds a new job within days shows up in claims and never in the unemployment count. Eligibility rules, which vary, sit between the two series like a filter.
The typical sequence at turning points is claims first, rate second. Layoffs begin, initial claims climb, and only later does the monthly survey reflect the damage. On the recovery side, claims fall while the rate stays elevated, because rehiring takes time to show up in a monthly snapshot. Expect the disagreement. Do not treat it as a data error.
Putting Labor Data Together With NFP
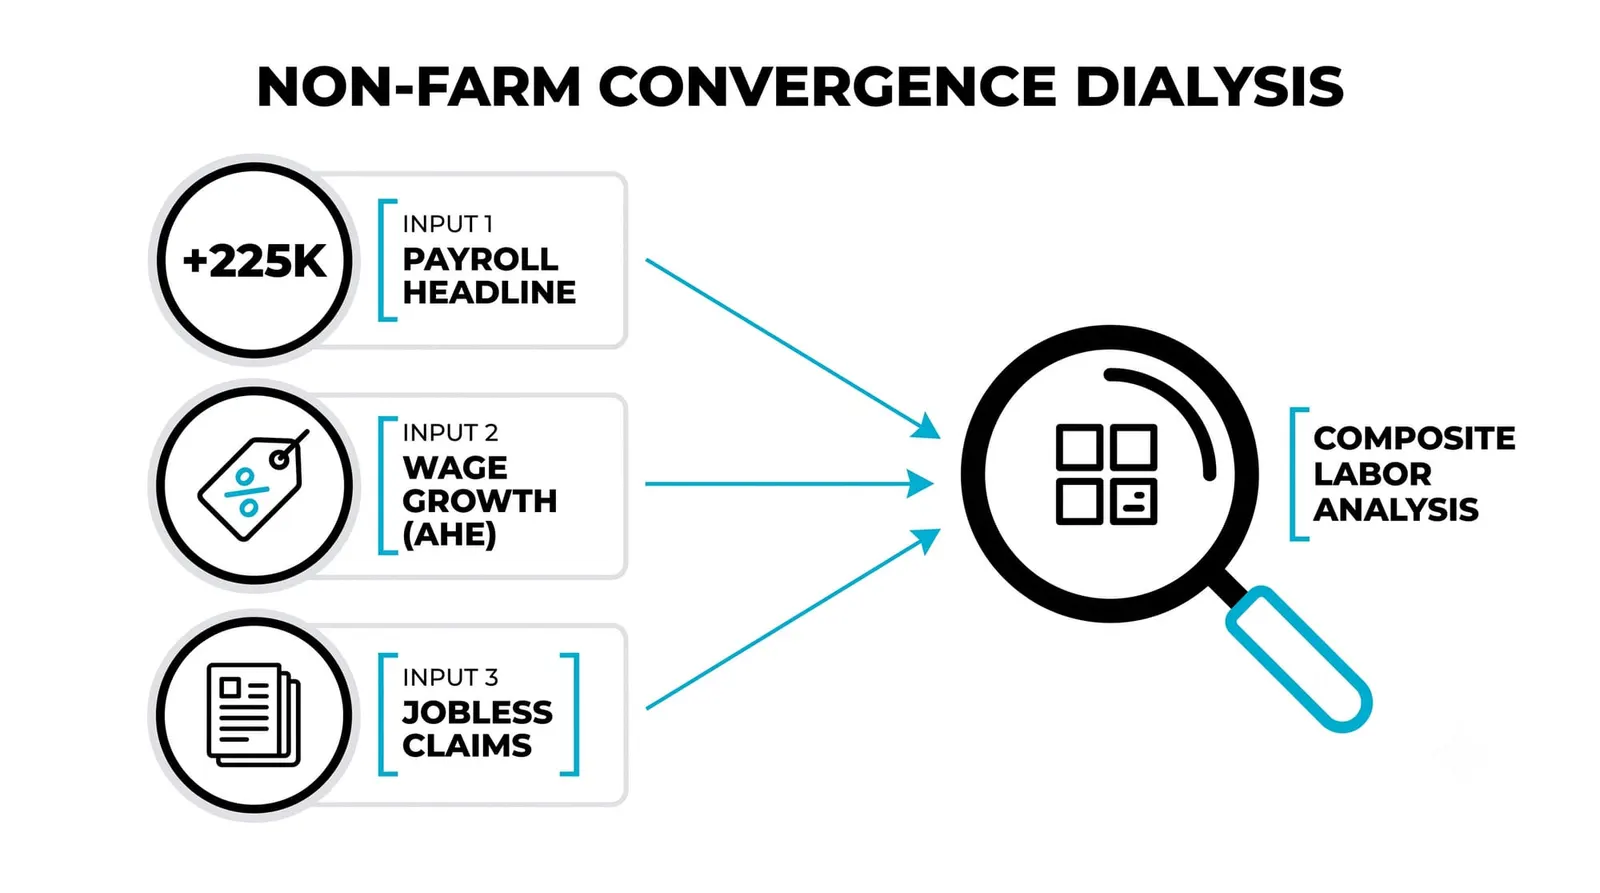
Serious labor analysis runs on a monthly triangle: payrolls, the unemployment rate, and claims. Payrolls count jobs added from the employer side. The rate measures slack from the household side. Claims track the flow of layoffs in near real time. Each covers a blind spot in the other two.
The triangle matters most when it argues with itself. A strong payrolls print paired with steadily rising claims is a warning, because payrolls are backward-looking and heavily revised while claims are current. Employers report the jobs that existed last month. Claims report the layoffs happening this week.
Traders weigh the conflict by asking which series has a reason to be wrong. Payrolls get revised, sometimes by large amounts. The household survey has sampling error. Claims get distorted by holidays and one-off events but rarely lie about direction for long. When two of the three agree and the third lags, the pair usually wins. When all three split, the honest position is smaller size and more patience.
Three Months of Mixed Signals
Here is a hypothetical quarter with round numbers. Payrolls average +150,000 per month. Initial claims climb steadily from 210,000 to 260,000. The unemployment rate edges from 4.0 percent to 4.2 percent.
Read each series alone first. Payrolls at +150,000 say the economy is still adding jobs at a decent pace. Claims rising from 210,000 to 260,000 say layoffs are accelerating week after week. The rate drifting up two-tenths says slack is building, slowly.
Now combine them. The payrolls number is the oldest information in the pile and the most revised. Claims are the freshest and they point one direction: up. The rate confirms the direction, gently. The combination reads as a labor market that is still standing but losing footing. A trader watching only the headline payrolls print would have missed the turn forming underneath it.
Now the mirror quarter. Payrolls average a soft +80,000 per month, but initial claims fall steadily from 260,000 back to 210,000 while the rate holds flat at 4.2 percent. Payrolls alone look weak. Claims say layoffs are drying up, which is what happens before hiring recovers. The flat rate says the damage stopped spreading. The combination reads as stabilization, not deterioration.
Which signal would a rate-setting committee watch first? Claims. Policymakers can wait for the monthly data to confirm, but the weekly series is what tells them the direction is changing while there is still time to respond. Confirmation comes later from the rate. The order is claims for the alert, the rate for the verdict.
The Four Series Side by Side
| Series | What it measures | How fast it updates | What it is good at catching |
|---|---|---|---|
| Unemployment rate | Share of the labor force without work | Monthly | The complete picture of labor slack |
| Initial claims | New filings for unemployment benefits | Weekly | Layoffs starting, turning points early |
| Continuing claims | People still receiving benefits | Weekly, with a lag | How long unemployment lasts |
| Four-week average | Smoothed initial claims trend | Weekly | The underlying direction through noise |
Unemployment Data, Answered
Why can claims rise while unemployment falls?
Because the two series measure different things through different doors. Claims count benefit filings, which spike with layoffs, while the rate counts people actively searching. If laid-off workers find new jobs quickly, or if new entrants find work faster than layoffs accumulate, claims can climb while the rate still falls. Eligibility rules widen the gap further.
What is the natural rate of unemployment?
It is the estimated rate consistent with stable inflation, the level of joblessness that exists even in a healthy economy due to people between jobs and skills not matching openings. It is an estimate, not a measurement, and economists revise their guesses over time. Treat it as a reference band, not a target carved in stone.
How fast do jobless claims get revised?
Weekly claims revisions are usually small and arrive quickly, often within a week. Larger adjustments come from annual re-benchmarking and seasonal factor updates, which can reshape several months of history at once. The four-week average absorbs most of the routine revision noise.
Which one should a new trader watch first?
Watch initial claims first, because they update weekly and turn earliest, then check the unemployment rate each month for confirmation. Claims give you the direction of travel. The rate tells you how far the journey has gone. Building the habit of reading both, against each other, is the skill this whole level keeps circling back to.
Next in this level, growth data: GDP, the number the whole dashboard exists to explain, and the surveys that try to get ahead of it.