Trade Balance and Import Export Data
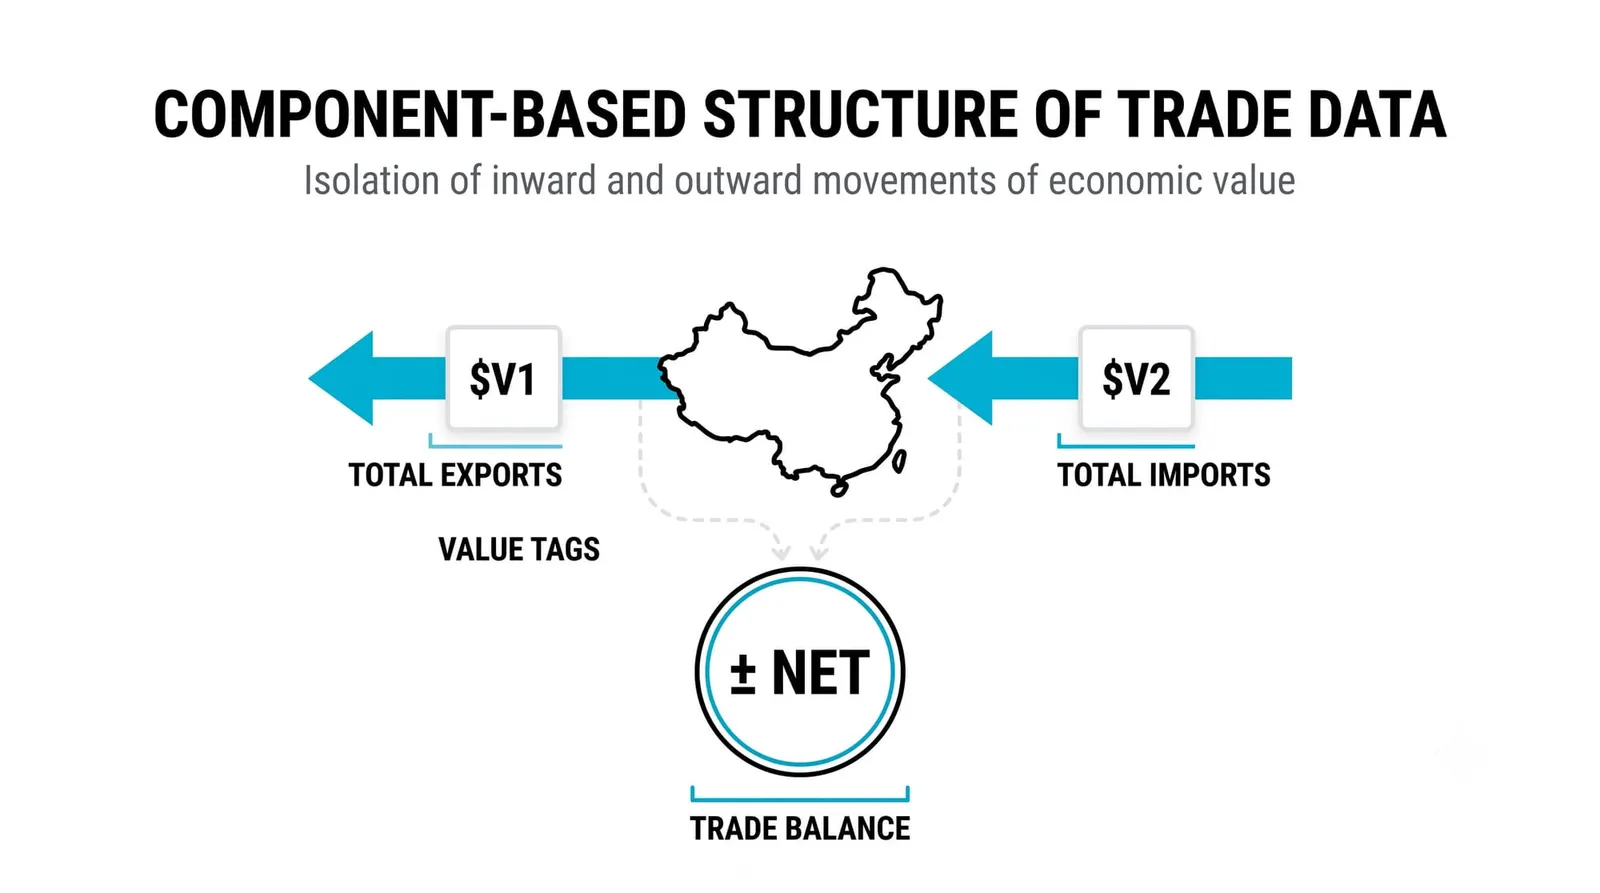
The trade balance is the difference between what a country exports and what it imports over a period, and for economies where trade is a large share of activity, the number moves currencies and risk appetite. Exports are money flowing in. Imports are money flowing out. Subtract one from the other and you have the headline figure traders watch each month.

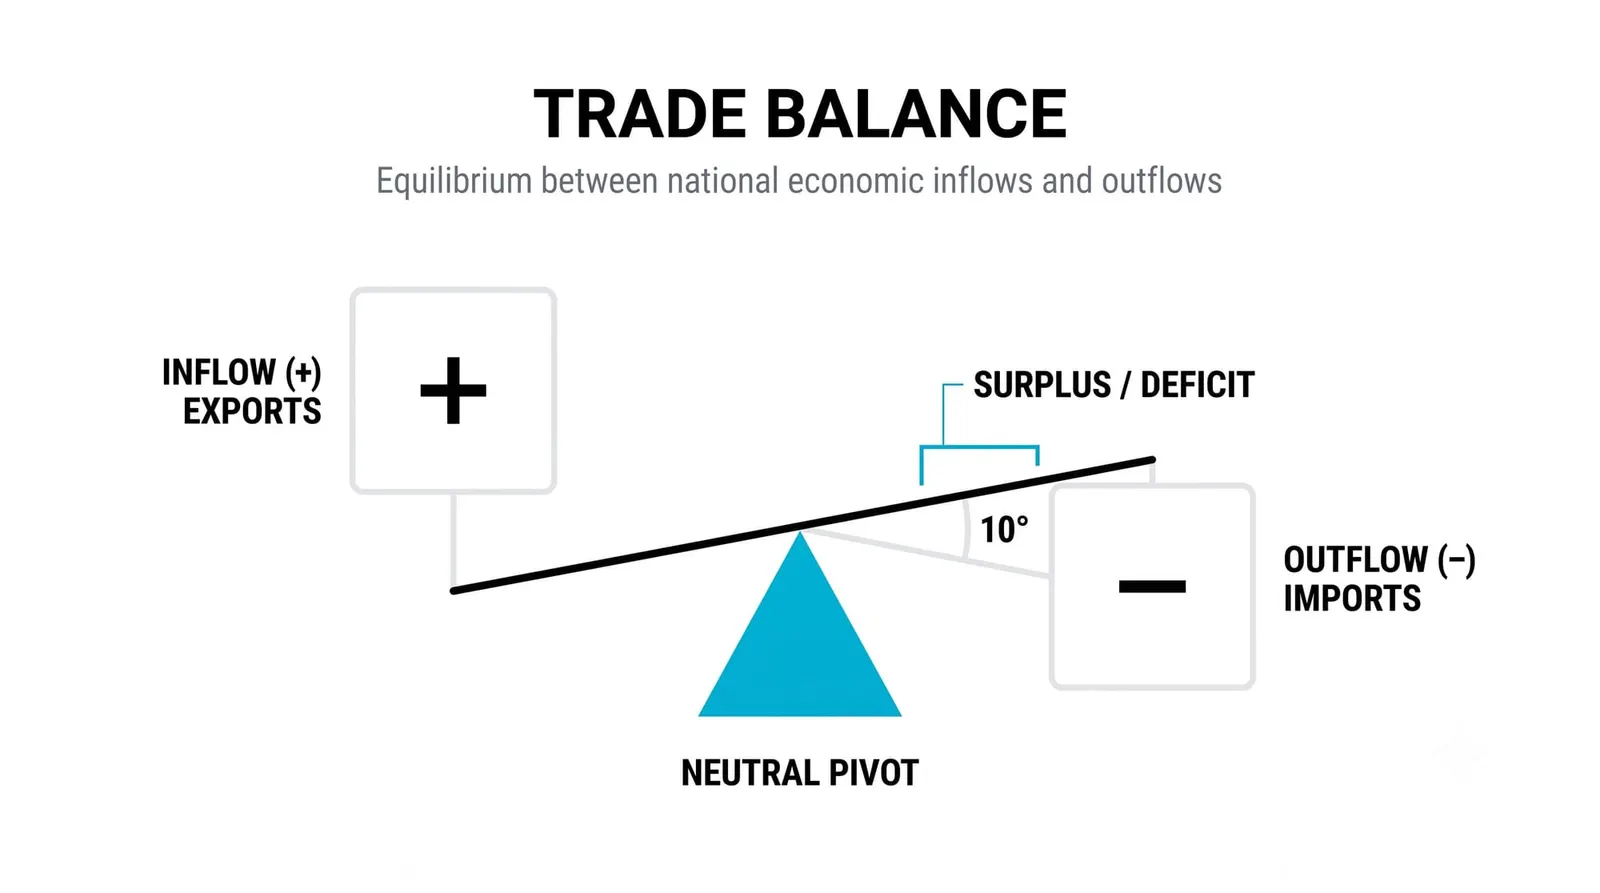
Think of the trade balance as the harbor master's count: ships leaving full and ships arriving full, and the difference tells you who is earning and who is spending. A country that ships out more than it brings in runs a surplus. A country that buys more than it sells runs a deficit. Neither is automatically good or bad, and that distinction is where most beginners go wrong.
What the Trade Balance Measures
The calculation is simple. Take the total value of goods and services a country sells abroad, subtract the total value of goods and services it buys from abroad, and the remainder is the trade balance. A positive number is a surplus. A negative number is a deficit.
The split between goods and services matters. Goods are physical: cars, wheat, oil, machinery. Services are intangible: banking, software, tourism, shipping insurance. Some economies run large goods deficits but offset them with services surpluses. Reading only the headline hides that structure.
A surplus means foreigners are sending the country more money for its output than the country sends abroad for theirs. A deficit means the reverse. In plain words, the surplus country is a net earner from trade, and the deficit country is a net spender.
The monthly number is an estimate, not a final count. Customs records, shipping documents, and survey data take time to compile, so statistical agencies publish a preliminary figure and revise it as complete data arrives. Sometimes the revision is larger than the original surprise. Treat every first print as a draft.
The current account, which folds the trade balance together with income flows and transfers, was covered earlier this level. This lesson goes deeper into the import and export data itself and how it trades.
Why It Moves Currencies
Trade flows are currency flows. Every cross-border purchase requires a currency exchange underneath it, and that mechanical fact is the transmission channel.
An importer buying foreign goods must sell local currency and buy the foreign one to pay the supplier. An exporter receiving payment in foreign currency eventually converts much of it back home. Scale that up to a national level and persistent trade patterns create persistent currency demand.
A country with a chronic surplus sees steady structural buying of its currency as export earnings flow home. A country with a chronic deficit sees steady structural selling. These are slow forces, not day-trading signals, but they form the tide beneath the shorter waves.
The currency section earlier covered how these flows feed exchange rate demand. What follows here is how the monthly data release itself gets traded.
Reading the Import and Export Detail
The split matters more than the total. Two identical headline numbers can carry opposite meanings depending on what drove them, and the detail section of the release is where that story lives.
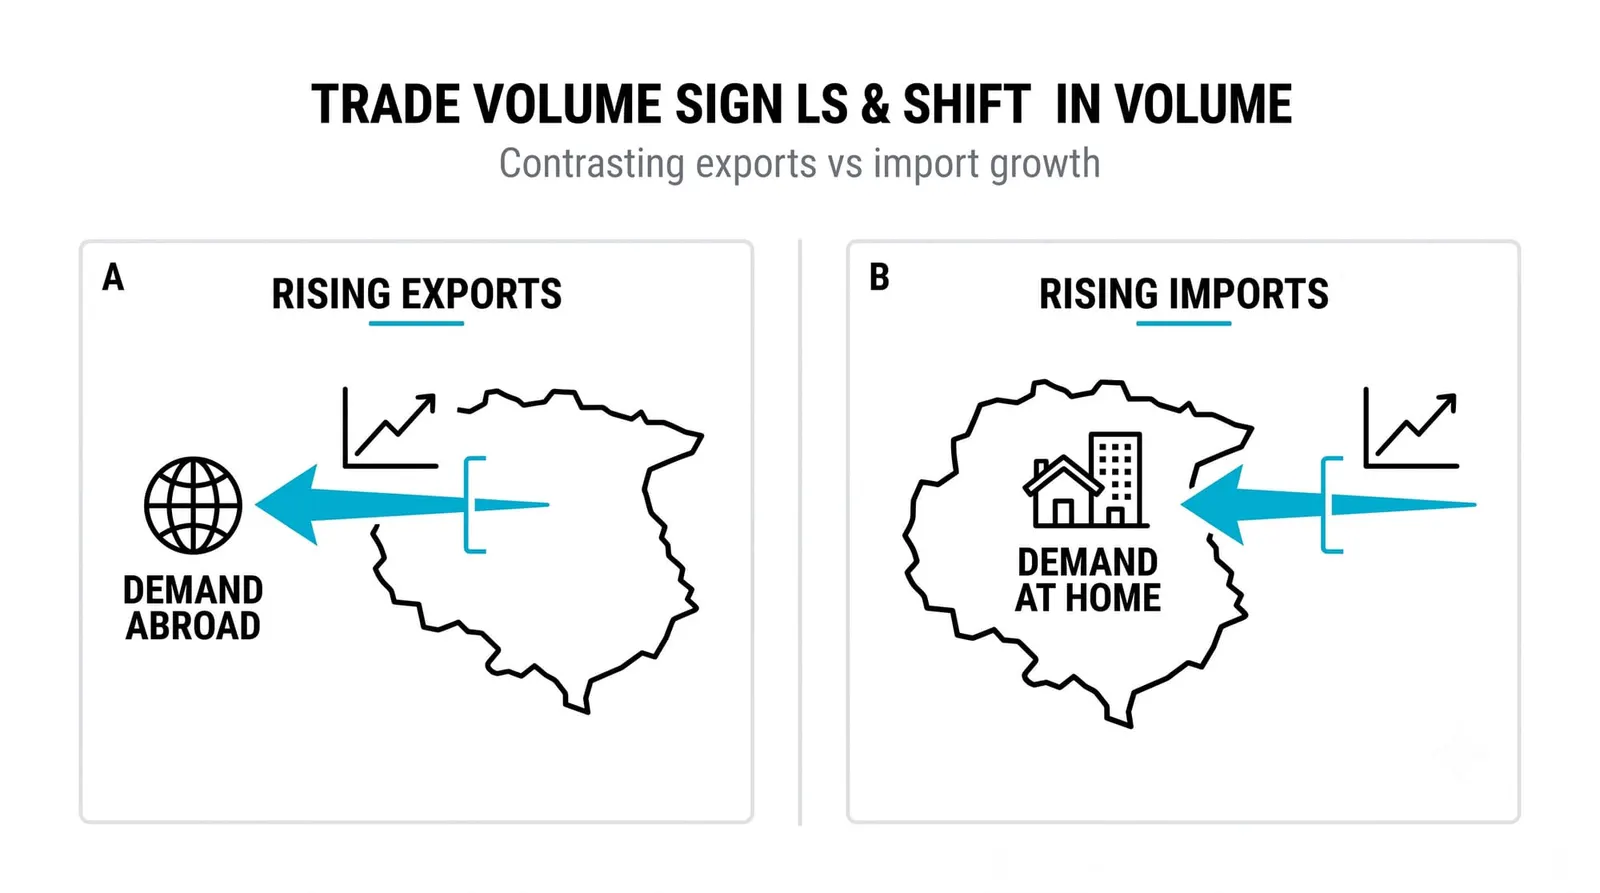
Start with imports. Rising imports because domestic consumers and businesses are spending strongly is a sign of healthy demand. Rising imports because energy prices jumped, while volumes stayed flat, is a cost shock, not strength. Same direction, different diagnosis.
Then look at exports through the price-versus-quantity lens. Export value can rise because the country sold more units, or because the price of each unit rose. A commodity exporter whose export value jumps on higher raw material prices is experiencing something different from a manufacturer selling more machines. Volume tells you about competitiveness. Price tells you about terms of trade.
A practical reading checklist:
- Import volumes up, broad-based: strong domestic demand, usually growth-positive.
- Import values up, volumes flat: rising costs, often energy, squeezing the balance.
- Export volumes up: genuine external demand for the country's output.
- Export values up on prices alone: favorable pricing, not necessarily stronger competitiveness.
- Export volumes down: weakening foreign demand or lost market share, the most concerning read.
When the Number Moves Markets
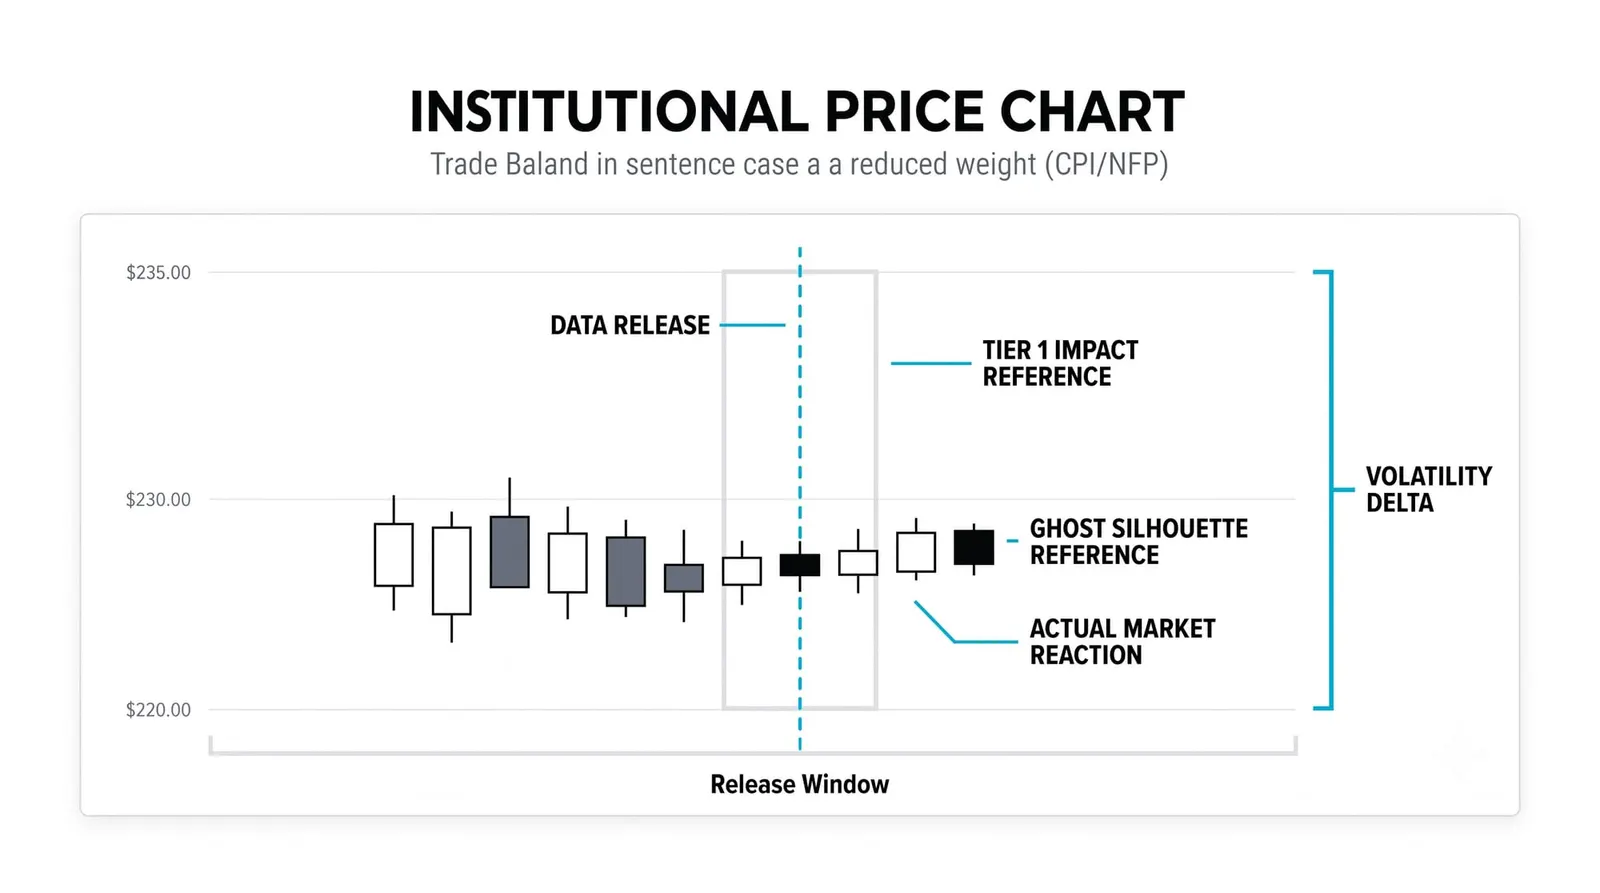
Markets trade the surprise, not the number. Before each release, analysts publish forecasts, and those forecasts get baked into prices. The deviation between the actual print and the consensus is what moves prices in the minutes after release.
A deficit that comes in exactly as expected can produce no movement at all. A small deficit that was forecast to be a surplus can produce a sharp one. The size of the miss matters more than the size of the balance.
Sensitivity varies by economy. Countries where exports drive a large share of output, especially commodity exporters, see their currencies react strongly to trade data because the print feeds directly into national income. Energy importers react when import costs swing, since expensive fuel bills widen deficits and pressure the currency. Large, domestically driven economies often shrug off the release unless the miss is extreme.
The second-order read runs through interest rates. A trade number that signals strong domestic demand can shift expectations toward tighter central bank policy. One that signals collapsing exports can shift expectations toward easing. Since rate expectations are the dominant driver of currency value, the trade print often moves markets less through the flow story and more through what it implies for the next central bank decision.
One Deficit, Two Stories
Here is a hypothetical illustration with invented round numbers. A country reports a monthly trade deficit of 60 billion against a forecast of 50 billion. The miss is 10 billion on the wrong side, and the currency falls half a percent in the first minutes after the release.
Version A: the detail shows imports surged because consumers are buying heavily across categories, while exports held steady. Traders read this as strong domestic demand. Strong demand suggests solid growth and possibly firmer rate expectations, so buyers step back in. The currency recovers much of the initial drop within the session. The deficit widened, but the story underneath was healthy spending.
Version B: the detail shows imports were flat and export volumes collapsed. Now the widening deficit reads as lost competitiveness or weakening foreign demand. That points toward softer growth and easier policy ahead. Sellers press, and the half-percent fall extends toward a full percent by the close.
Same headline. Same initial reaction. Opposite follow-through, decided entirely by the composition of the number. Traders who read only the headline got the first move right and the rest of the day wrong.
| Reading | What it says | Usual currency read |
|---|---|---|
| Surplus | Exports exceed imports; net money flowing in from trade | Mildly supportive, structural demand for the currency |
| Deficit | Imports exceed exports; net money flowing out | Mildly negative, but tolerated if growth is strong |
| Widening balance | The gap is growing, in either direction | Depends on the driver: demand strength is forgiven, export collapse is punished |
| Narrowing balance | The gap is shrinking | Supportive if driven by rising exports, worrying if driven by collapsing imports |
Trade Balance Data, Answered
Does a trade deficit weaken a currency?
Not by itself. A deficit creates structural selling pressure, but capital flows, rate differentials, and growth expectations routinely overpower it. Many currencies have strengthened for years alongside persistent deficits because investors wanted in more than importers wanted out.
How often is trade data released?
Monthly in most major economies, typically with a lag of several weeks after the period ends. Quarterly figures also exist but the monthly print is the one markets trade.
Why do revisions matter so much in trade data?
The first estimate is built from incomplete customs and survey records, so later revisions can be large enough to change the story entirely. A deficit that looked like a surprise miss can be revised back to the forecast, which is why experienced traders wait for the detail and sometimes the revision before committing to a view.
Which countries' trade data moves markets most?
Export-driven economies and major commodity exporters tend to see the strongest currency reactions, because trade is a large share of their national income. Large commodity importers react when energy costs swing the balance. The biggest, most domestically driven economies often see muted reactions unless the miss is severe.
Next, the focus shifts from trade flows to positioning: how the commitment of traders report reveals what different groups of market participants are actually holding, and how to read crowding before it unwinds.