Trade Balance and the Current Account
The trade balance is the difference between what a country sells abroad and what it buys from abroad in goods and services, and it sits inside a wider ledger called the current account that also counts investment income and transfers. Together, these two numbers tell you whether a country is a net earner or a net spender in the world economy. That matters for currencies, but slowly. The pressure builds over years, not days.

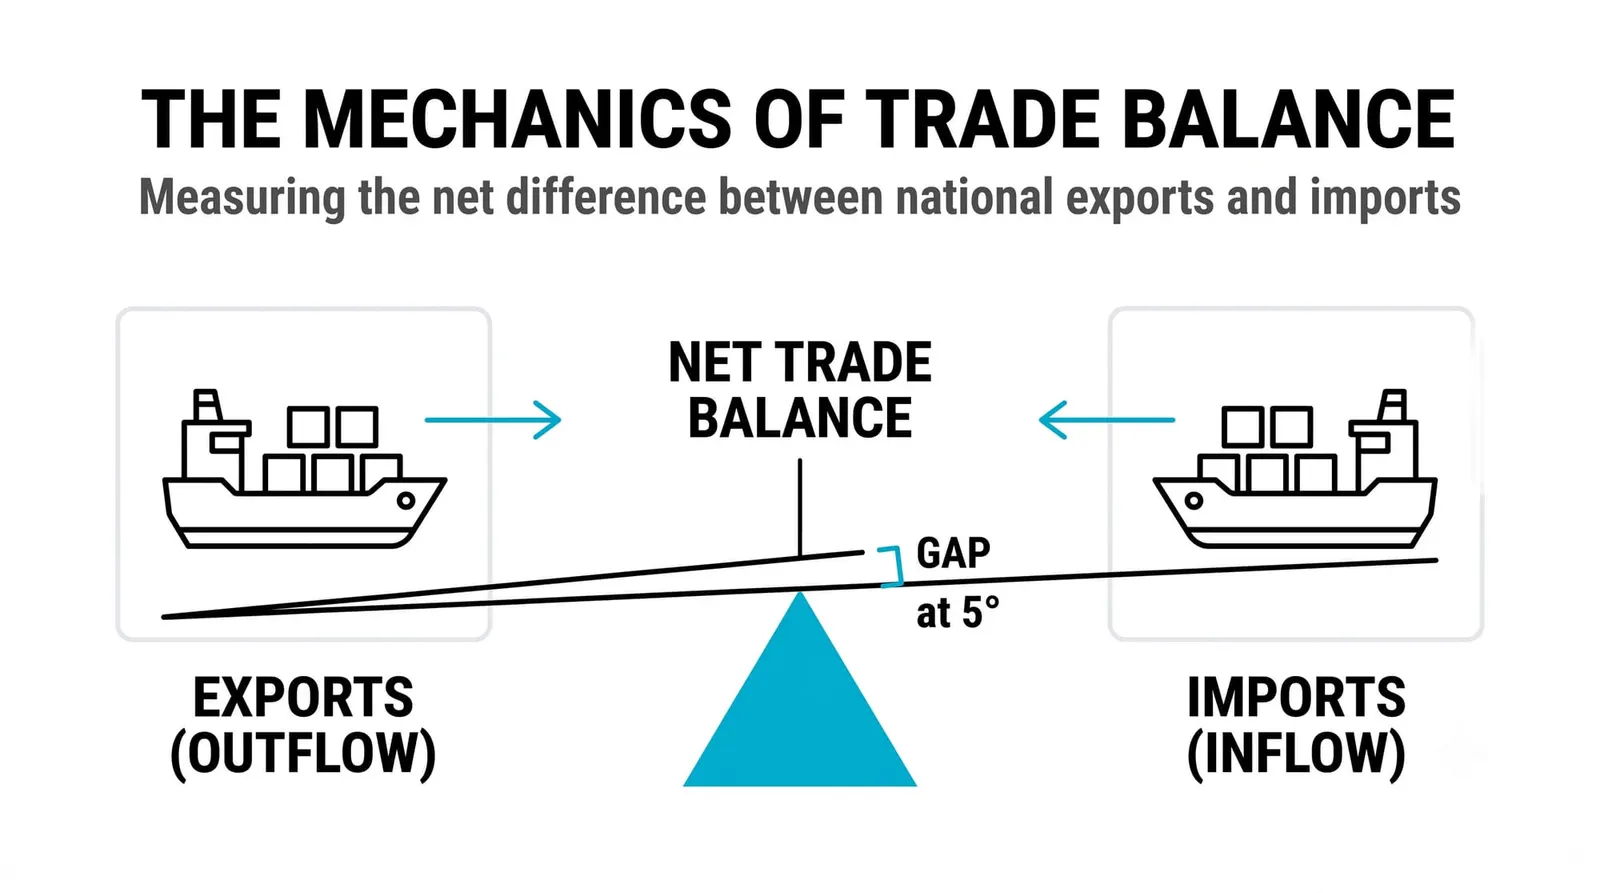
Think of exports and imports as the two big pipes through the wall of a water tank; the balance is the water level, and the current account adds every smaller pipe in the wall. Once you see the ledger this way, the headlines stop being confusing. A deficit is a level falling. A surplus is a level rising. Neither is a verdict on its own.
What the Trade Balance Actually Measures
Start with the arithmetic. A country's exports are everything it sells to foreigners: cars, software, wheat, banking services, tourism. Its imports are everything it buys from foreigners. Subtract imports from exports and you have the trade balance.
A positive number is a surplus. The country sold more than it bought. A negative number is a deficit. It bought more than it sold.
Neither is automatically good or bad, and this is where most commentary goes wrong. A deficit can mean consumers are confident and spending freely, much of it on foreign goods. It can also mean a country is importing machinery and equipment to build future productive capacity, which is an investment, not a weakness. A surplus can reflect competitive exporters, or it can reflect households too cautious to spend. The number alone does not tell you which story is true.
You met foreign demand for a country's exports earlier in this level, as one block of macro demand in the supply and demand lesson. The trade balance is simply where that block gets measured, so we will not re-teach it here.
One more distinction matters. Trade figures are usually split into goods and services. A country can run a goods deficit and a services surplus at the same time, and the net figure is what counts. Economies heavy on finance, law, and technology often show exactly that pattern.
From Trade Balance to Current Account
The trade balance is the biggest page of a larger book. That book is the current account, and it adds two more categories of cross-border flow.
The first is investment income. When a country's citizens and firms own assets abroad, the dividends, interest, and profits flowing home count as income. Payments flowing out to foreign owners of domestic assets count against it. A country that has spent decades building foreign investments can earn a large, steady stream here.
The second is transfers. These are one-way payments with nothing received in return. The largest example in most countries is remittances: money that workers abroad send home to family. Foreign aid fits here too.
Add trade, investment income, and transfers together and you get the current account. It is the full flow statement of a country against the rest of the world. The trade balance usually dominates the total, which is why the two terms get blurred in headlines, but for countries with large foreign investment positions or large remittance flows, the gap between the two can be wide.
What Surpluses and Deficits Signal About a Currency
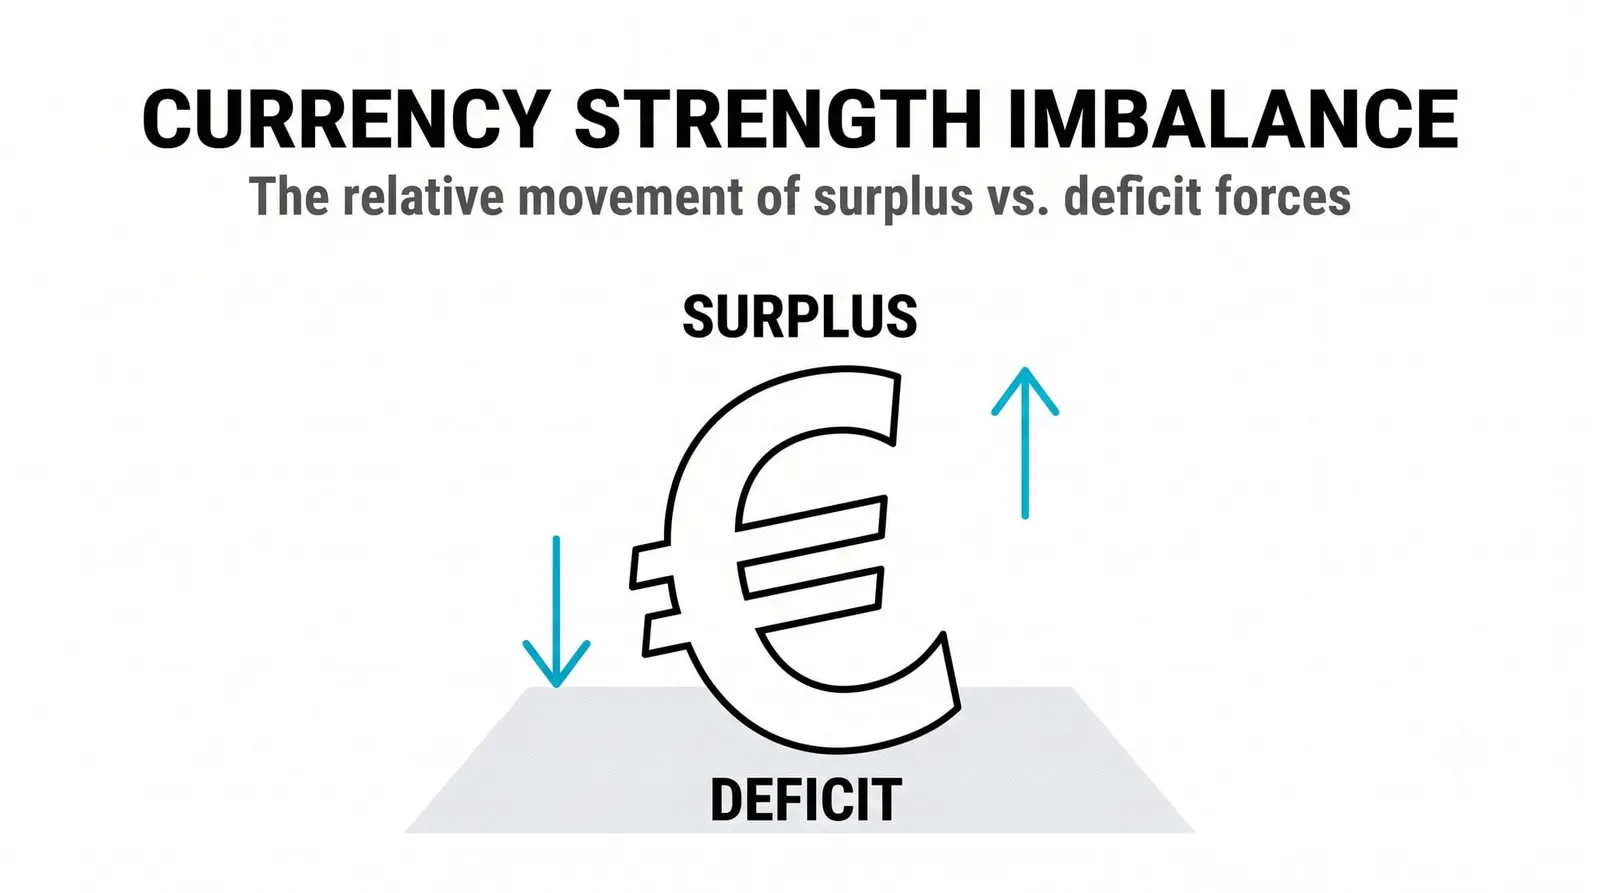
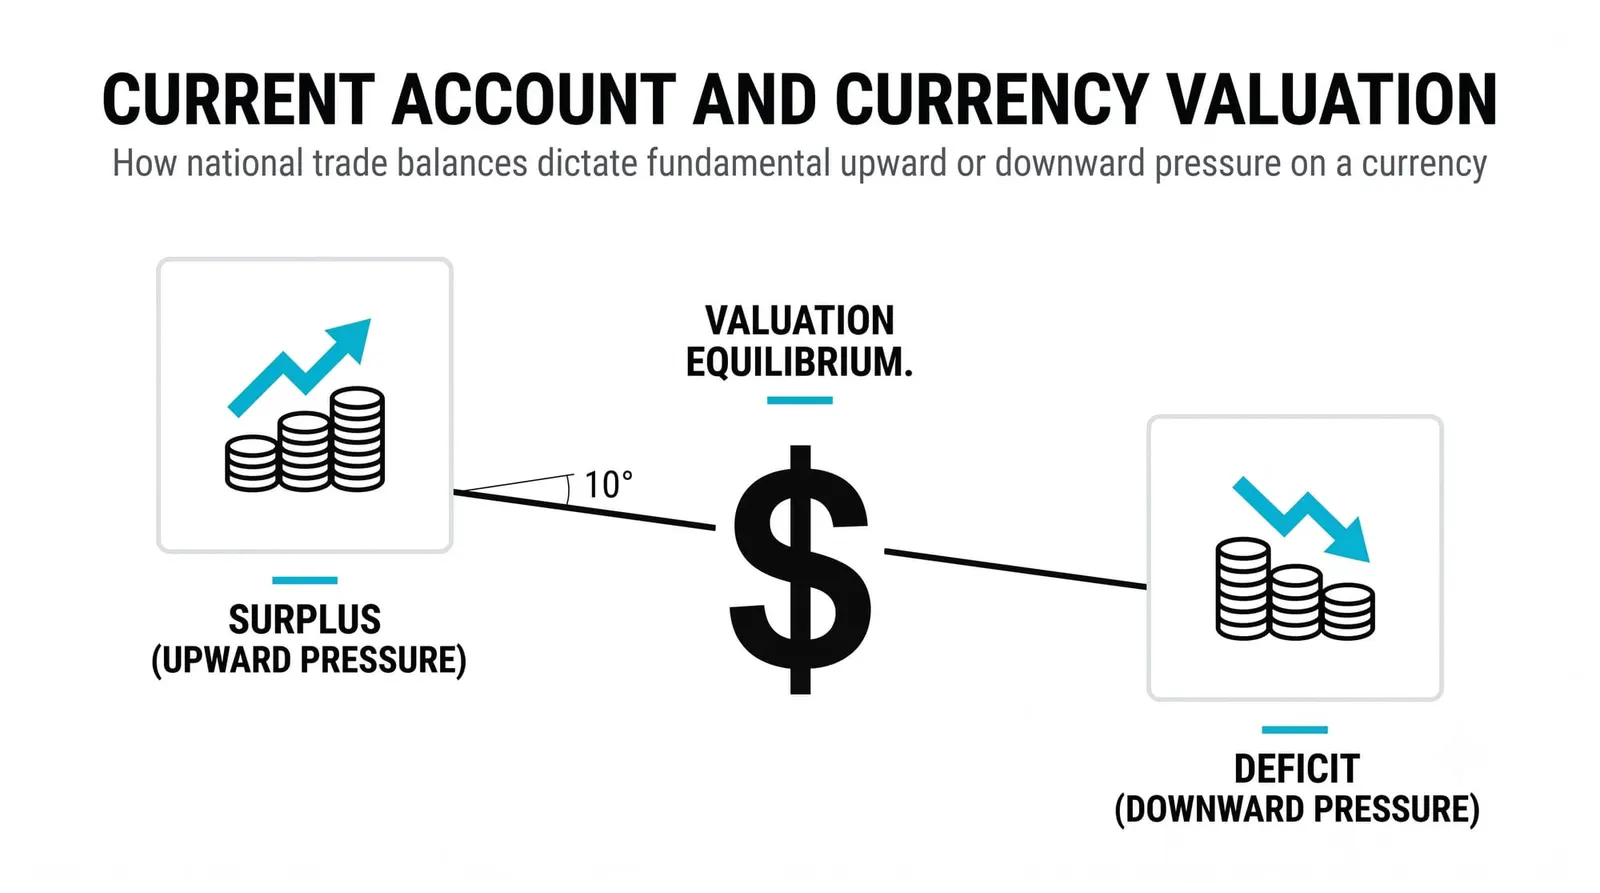
Here is the mechanical link. A country running a persistent deficit is spending more abroad than it earns. That gap must be financed somehow. The country borrows from foreigners, or it sells assets to them: bonds, companies, property. Year after year, that financing creates a slow, steady selling pressure on the currency, because the country is a net supplier of its own money to the world.
A persistent surplus is the mirror image. Foreign earnings keep flowing in, get converted home, and create steady underlying demand for the currency.
Treat this as a structural current under the market, not a wave on the surface. It rarely shows up as a spike on any given day. You will not watch a release and see a currency collapse because the deficit widened. What you see instead, over years, is a persistent headwind or tailwind behind every other move.
The previous lesson covered the currency side of this directly: how these flows translate into exchange rate strength and weakness over long horizons. This lesson supplies the ledger underneath it.
One caution. A deficit financed by productive foreign investment is very different from a deficit financed by short-term borrowing that can flee. The composition of the financing matters as much as the size of the gap, and it is why two countries with identical deficits can have very different currency experiences.
Why Traders Watch This Number
Trade data arrives monthly in most major economies, and the fuller current account figures arrive quarterly. That cadence tells you something about its role: this is a slow indicator.
Most of the time, the release confirms a story already in place. A country known for deficits prints another deficit, and the market shrugs. Occasionally the number shifts quietly but persistently in one direction over several releases, and that is when patient traders pay attention, because a trend change here rewrites the long-run currency story.
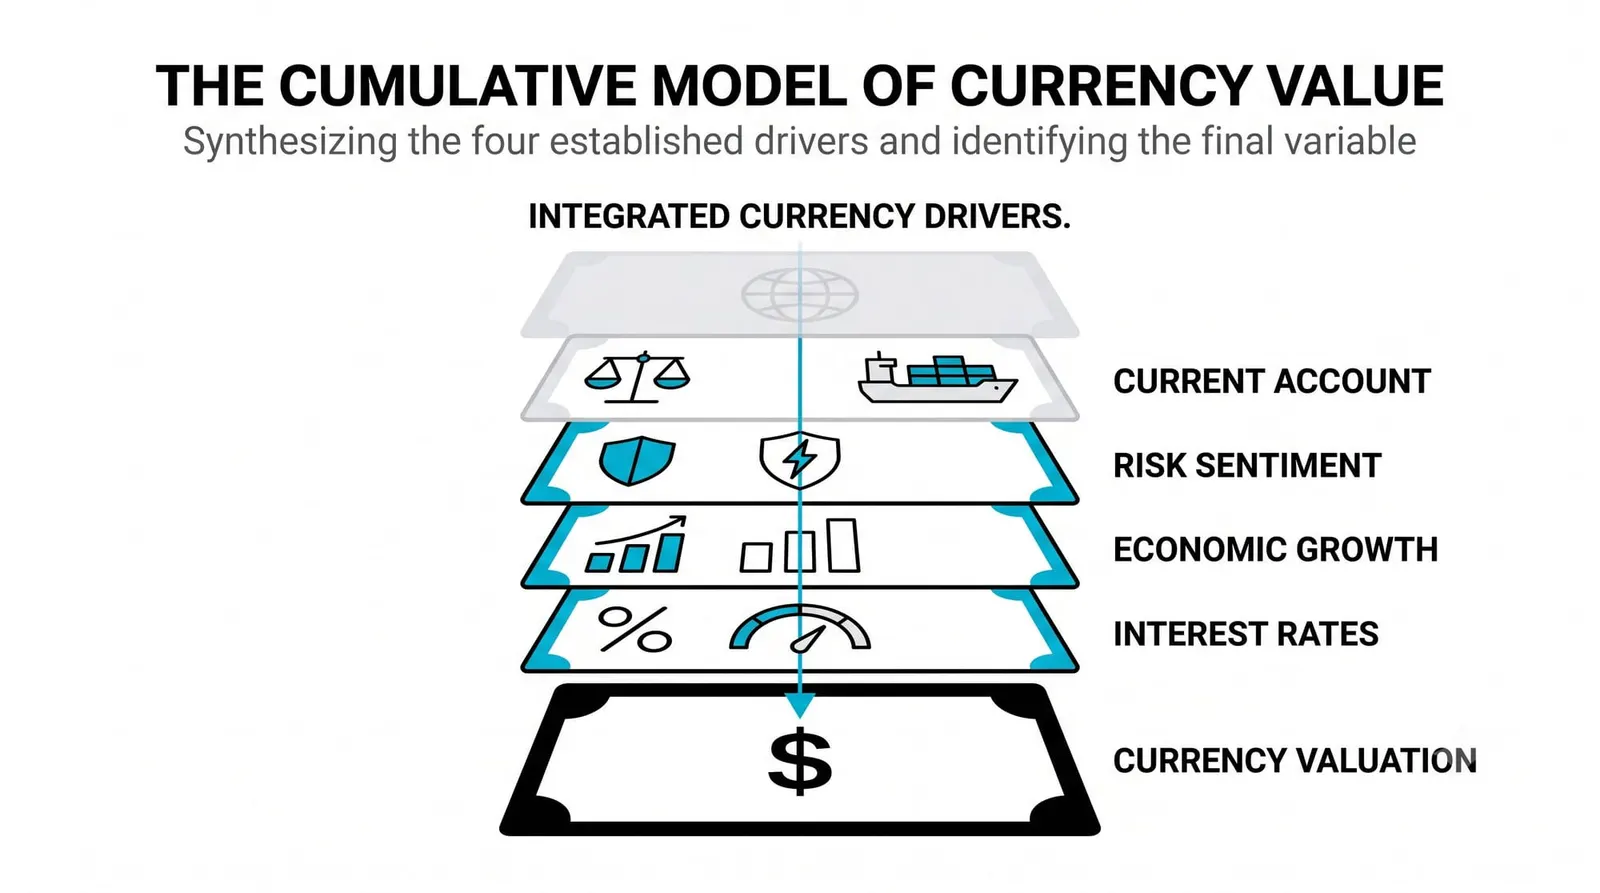
Place it honestly in the hierarchy. Interest rates and growth usually shout louder. A central bank decision moves currencies in minutes. A trade release moves the narrative in months.
The practical habit is simple. Know whether each currency you trade sits on a surplus or a deficit. Know whether that position is improving or deteriorating. Then let the louder, faster indicators drive your actual timing.
Two Countries, Two Ledgers
Everything below is a hypothetical illustration with invented round numbers.
Country A exports 1,100 worth of goods and services and imports 1,000. Its trade balance is +100, a surplus. Country B exports 900 and imports 1,050. Its trade balance is -150, a deficit.
Now add the smaller pipes. Country A earns 30 in investment income from assets it holds abroad. Its current account comes to roughly +130. Country B pays out 60 to foreign lenders and investors. Its current account comes to roughly -210.
Read the two ledgers. Country A is a net earner, pulling in more from the world than it sends out. Over years, that is a steady source of underlying demand for its currency. Country B is a net spender to the tune of 210 a year. It must finance that gap by borrowing from foreigners or selling them assets, and that is a persistent, gentle headwind on its currency.
Now the honest twist. Country B can still hold a firm currency for long stretches. If its interest rates are attractive and its growth is strong, capital will flow in to buy its bonds and its companies, and those inflows can outweigh the trade outflow for years at a time. Trade is one pipe among several. The ledger tells you the direction of the underlying pressure, never the timing of when it wins.
| Line | What It Counts | What It Signals |
|---|---|---|
| Exports | Goods and services sold to foreigners | Foreign demand for the country's output |
| Imports | Goods and services bought from foreigners | Domestic appetite and spending strength |
| Trade balance | Exports minus imports | Net earner or net spender on trade alone |
| Current account | Trade balance plus investment income and transfers | The full flow position against the world, and the long-run currency pressure |
The Trade Balance, Answered
Is a trade deficit bad for a currency?
Over long horizons, a persistent deficit creates steady selling pressure on a currency, because the country must borrow from or sell assets to foreigners to fund the gap. But a deficit is not automatically a sign of weakness. It can reflect strong consumer demand or heavy investment in future capacity, and capital inflows attracted by high rates or strong growth can offset it for years.
Why does a big deficit not crash the currency immediately?
Because the pressure is structural, not event-driven. The deficit is financed continuously through borrowing and asset sales, so the adjustment shows up as a slow drift over years rather than a single sharp move. Currency markets reprice daily on rates, growth, and risk appetite, all of which move faster than trade flows.
How often is the number released?
Trade balance figures are published monthly in most major economies. The fuller current account data, including investment income and transfers, is usually published quarterly. Either way, single releases matter less than the direction of the trend across several of them.
Where does the current account figure come from?
It is compiled by national statistical agencies and central banks as part of the balance of payments, the complete record of a country's economic transactions with the rest of the world. They gather customs data on goods, surveys on services, and reports on cross-border income and transfers, then assemble the full ledger.
Next in this level, the shocks: how wars, sanctions, and elections change the rules markets run on, why prices move before anyone knows the full story, and why most of those moves fade.