The COT Report: How to Read It
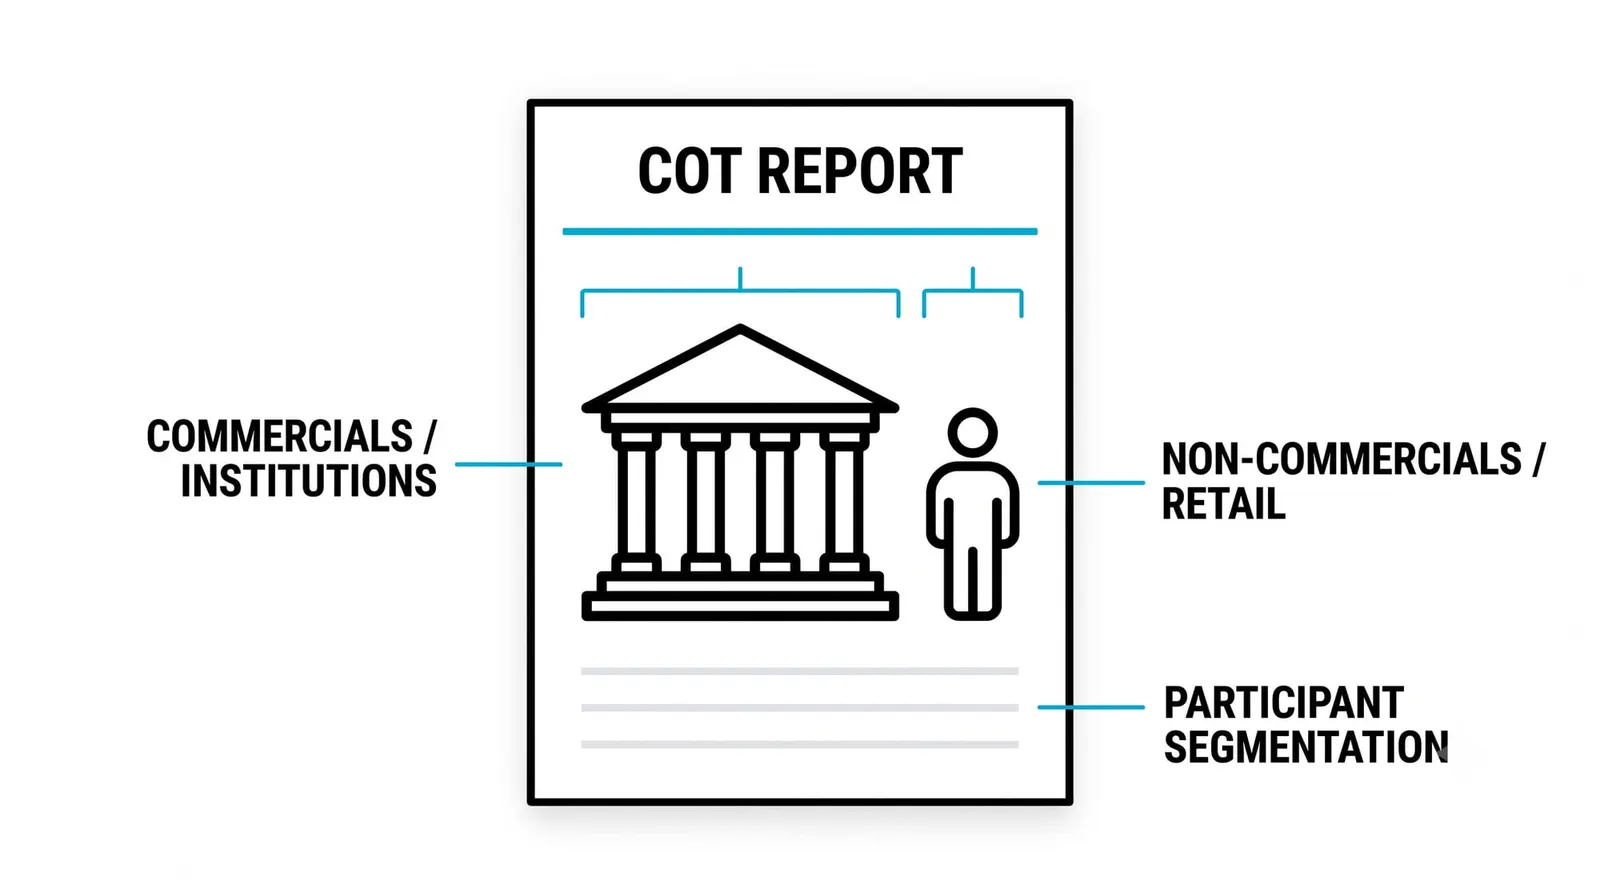
The COT report is a weekly government publication that shows how big groups of futures traders are positioned: who is long, who is short, and by how much. It stands for Commitments of Traders, and it is the clearest public window into institutional positioning that a retail trader will ever get. No survey, no opinion poll, no sentiment index comes close to showing you actual money on the table.
Last lesson covered market sentiment as a broad concept. Positioning is one of its primary measurements, and the COT report is where you measure it. Think of it as a census of who holds what, published every week with a delay, and like any census its value is in the shape of the crowd rather than any single household.
Next lesson covers the VIX, another sentiment gauge built from a completely different source. Keep the two separate in your head: one measures where money sits, the other measures what traders will pay for protection.
What the COT Report Actually Is
The Commodity Futures Trading Commission, the US regulator for futures markets, publishes the report every week. It is built from data that exchanges and clearing firms are required to submit, covering positions held as of the prior Tuesday. The release usually lands on Friday afternoon.
Reporting is mandatory above certain size thresholds. Any trader holding a position large enough to cross the CFTC's reporting level for a given market must be identified and classified. That threshold varies by contract, but the effect is the same everywhere: the big money cannot hide.
Small traders fall below the reporting line, so their positions are not individually visible. The report still captures them, though, as a residual. Once the reported positions are totaled, whatever is left over is attributed to the small, non-reportable crowd. Nothing disappears; it just gets bucketed.
The report covers futures markets across currencies, stock indexes, interest rates, energies, metals, and agricultural products. For a macro-focused trader, the currency and index sections tend to matter most.
The Categories: Who Is Holding What
Three groups make up every COT report, and each behaves differently for structural reasons.
Commercial hedgers use the futures market because of their business. A wheat exporter hedges the crop. A multinational hedges currency exposure on future revenue. These players are not betting on direction for profit; they are offloading risk. Their positioning often runs against the prevailing trend, because hedging demand rises as prices move.
Large speculators are the funds. Commodity trading advisors, hedge funds, and managed money accounts fall here. They trade for profit, and they tend to run with trends. When a move has legs, this group piles in, and their net position grows in the direction of the trend.
Small traders are the non-reportable residual. This group is often treated as a rough proxy for retail participation, though that is a loose label. Their positioning tends to be noisy and frequently wrong at turning points.
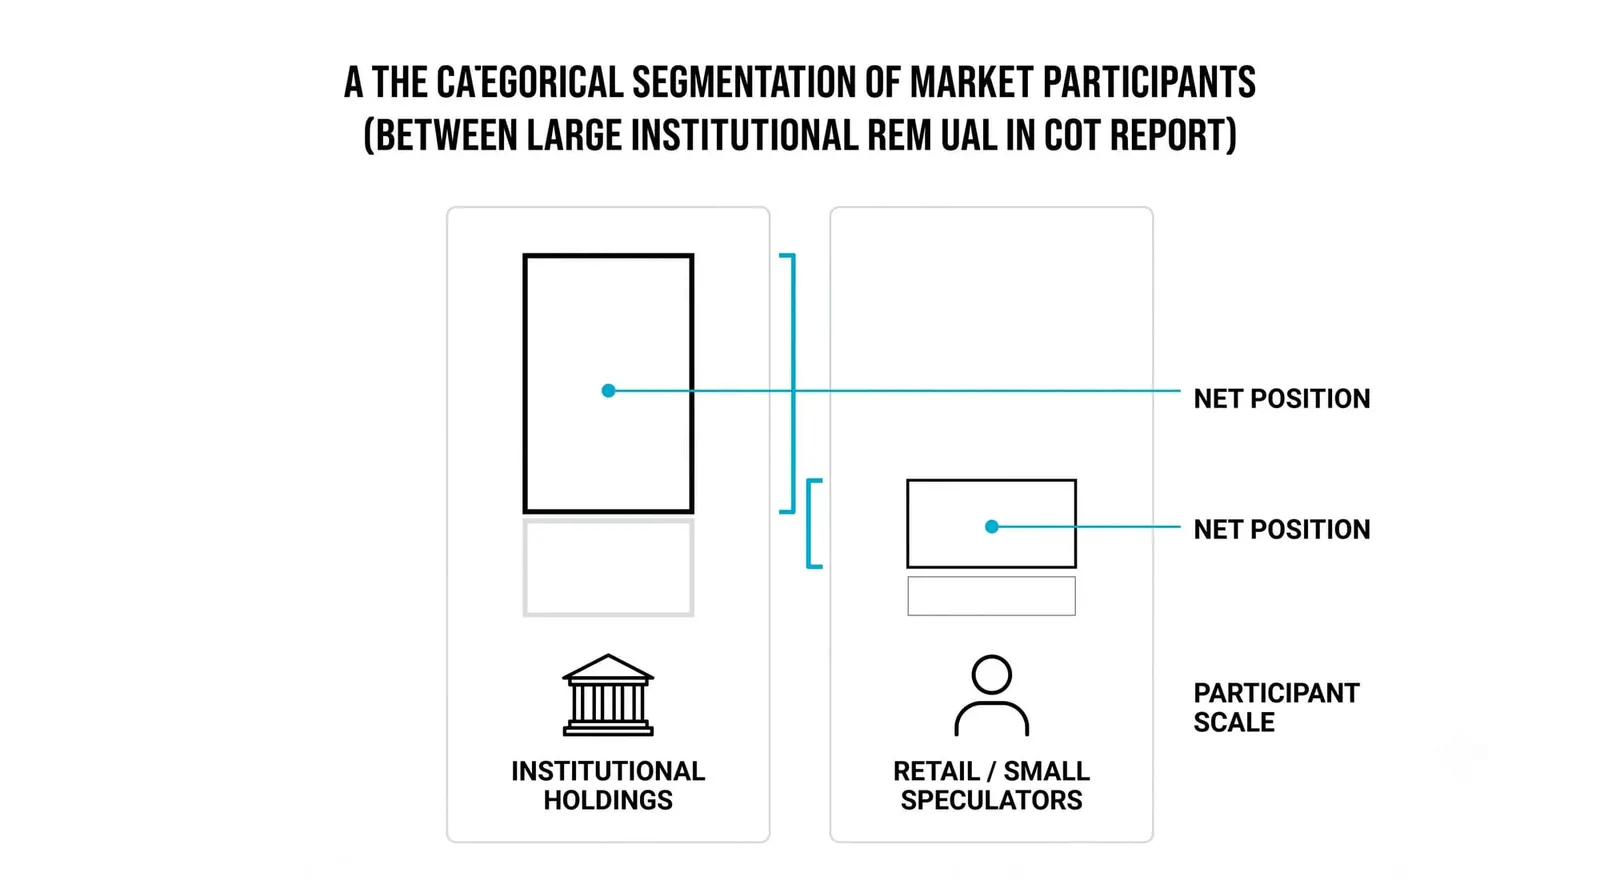
The raw count means little on its own. What carries information is how each group's position compares to its own history, and how the groups line up against each other.
Reading Positioning for Extremes
Start with net positioning. Subtract short contracts from long contracts for each group, and you get a single number that says which way that crowd leans and how hard. A group can hold both longs and shorts at once, so the net figure is the honest summary.
Watch the spread between groups. Large speculators and commercials usually sit on opposite sides, and the gap between their net positions widens as a trend matures. When that spread stretches to a multi-year extreme, the trend has become crowded.
Raw contract counts mislead, because market size grows over time. A net-long of 100,000 contracts means something different in a market that trades twice the volume it did a decade ago. Convert positions into percentiles against their own history instead. A reading in the 95th percentile of the past five years tells you far more than any absolute number.
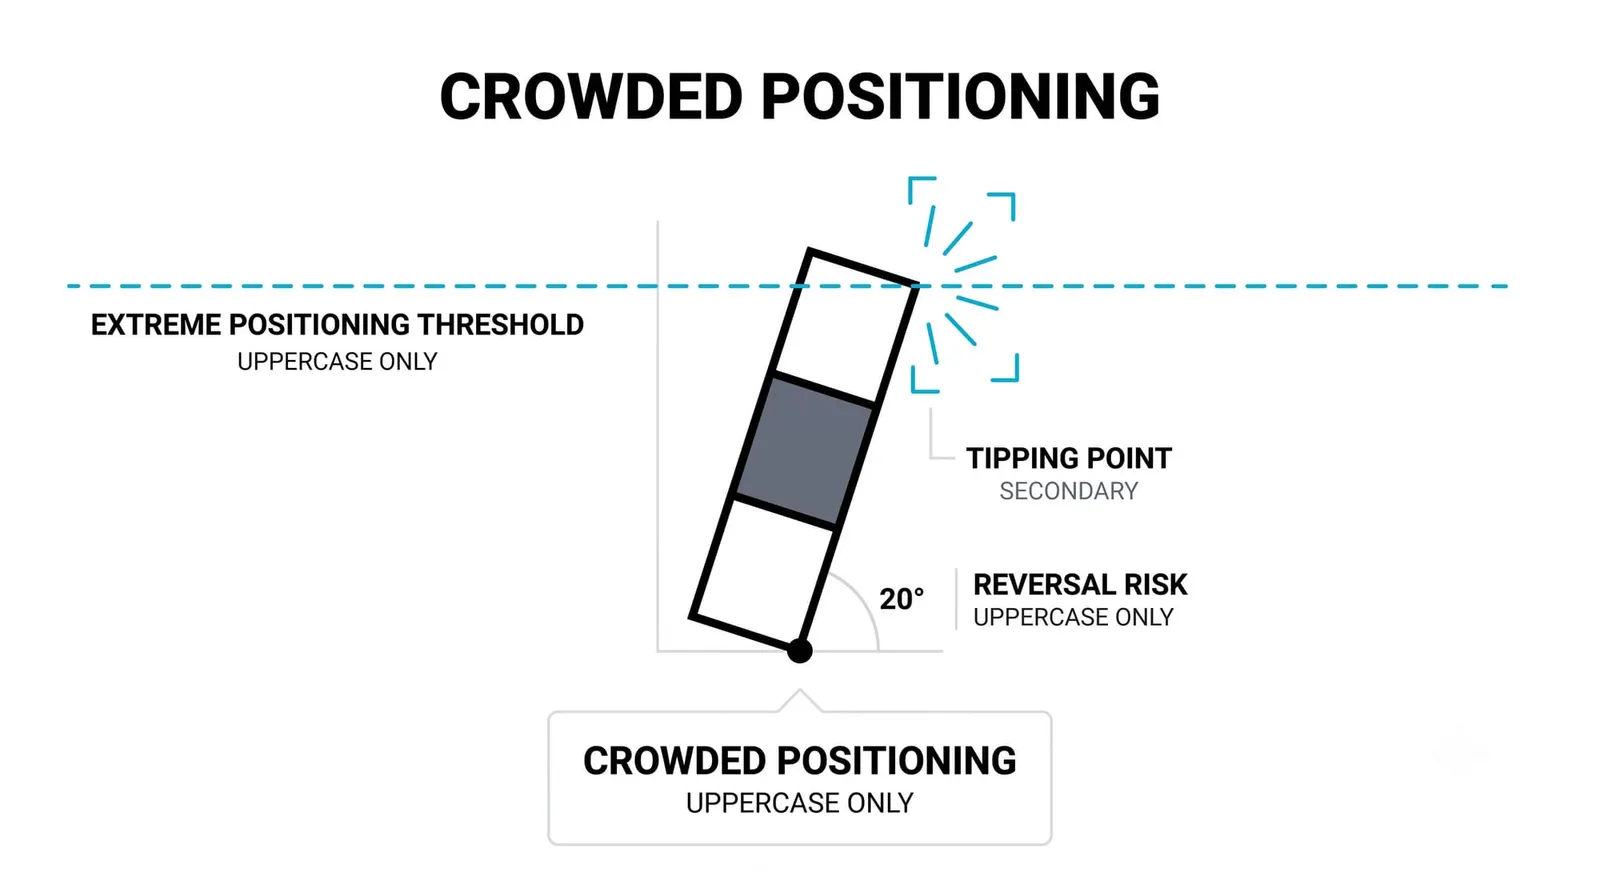
Extreme positioning is fuel. When everyone who wants to be long is already long, there is nobody left to buy. The trend does not need bad news to stall; it only needs the absence of new buyers. And when price turns, all those crowded positions become potential sellers at once.
Why the Report Lags and Why It Still Matters
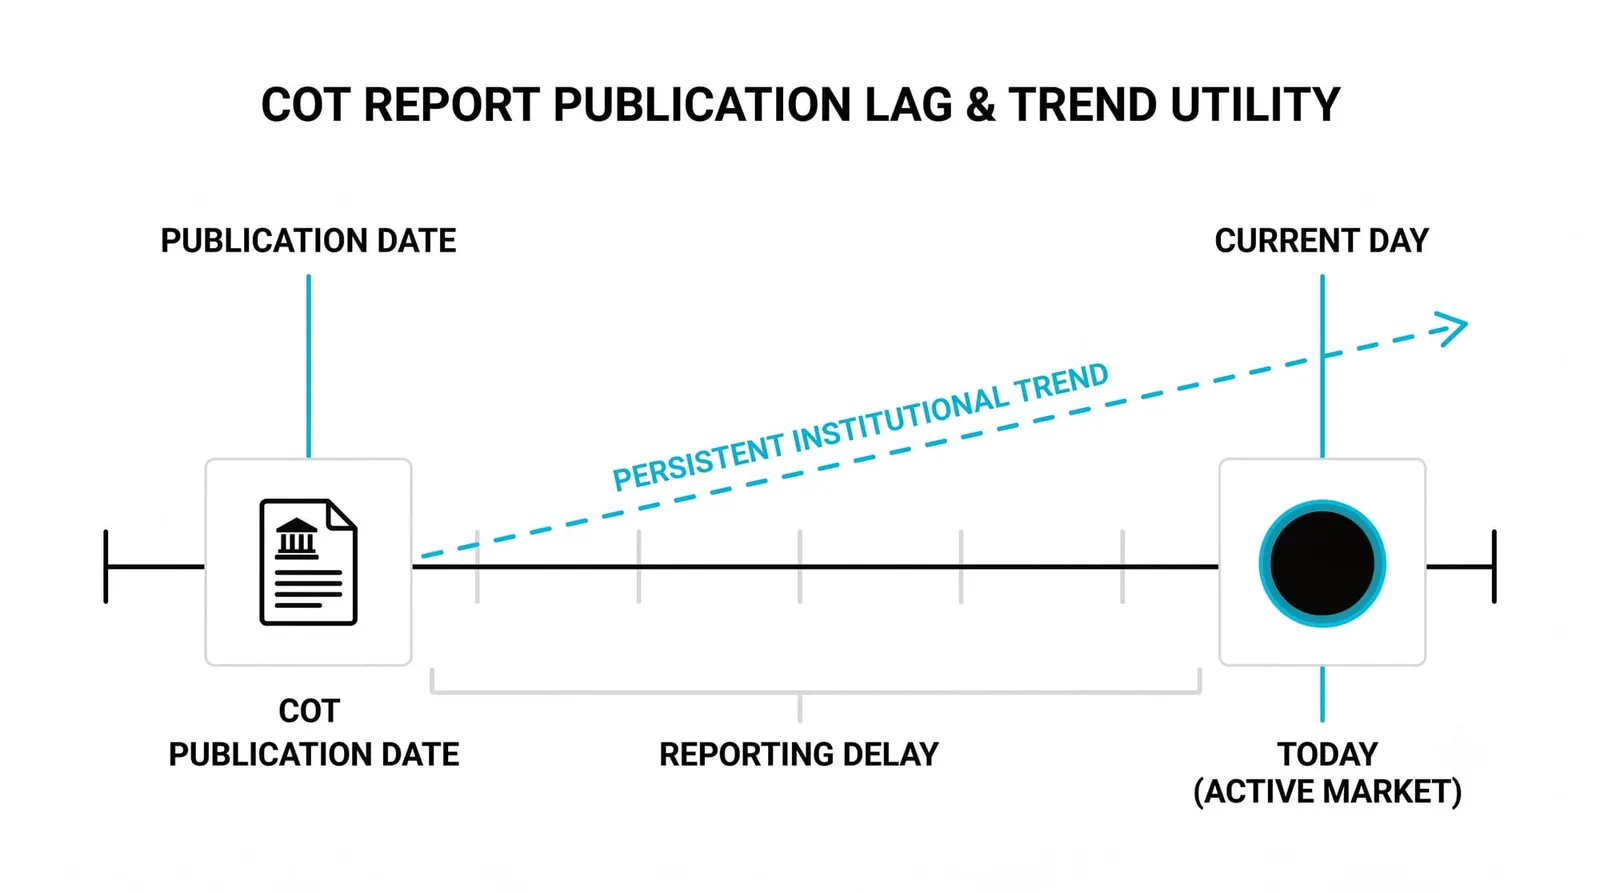
The data describes Tuesday. You read it on Friday. Positions can shift meaningfully in those three days, and critics point to this lag as a fatal flaw.
The lag matters less than it looks. Positioning extremes do not form in three days. They build over weeks and months as a trend attracts more and more capital. A fund complex that spent four months accumulating a record long does not unwind it between Tuesday and Friday. The shape of the crowd persists even when the edges move.
Treat the report as a slow-burn tool. It tells you how much fuel is stacked up, not when the spark arrives. Traders who use it as a timing signal get frustrated. Traders who use it as context, layered under the technicals you already know, get real value from it.
One blunt rule: the COT report will never tell you when to enter. It tells you how dangerous the room is.
One Currency, Three Crowds
Imagine a hypothetical currency that has rallied steadily for six months. Every number here is invented for illustration.
The COT report now shows large speculators net-long 120,000 contracts, a five-year extreme. Commercials sit net-short 80,000 contracts, near their own record. Small traders are net-long too, riding the same trend. The net spread between speculators and commercials is 200,000 contracts, the widest ever recorded in this market.
Now ask who has room to add. The speculators are already at a historic long. To push price higher, they would need to buy beyond anything they have done before. The commercials are hedging, not speculating, so they will not chase. The small traders are already in. The buyer pool is close to exhausted.
Price stalls. It drifts sideways for a few weeks, then rolls over and breaks a level the technicals flagged as support. Now the mechanics turn. Speculators who were comfortably profitable start cutting. Their selling pushes price lower, which pressures the next layer of longs, who sell too. The same 120,000-contract long that looked like conviction becomes a queue of exits.
The commercials, short all the way up, are now profitable and can cover into the decline, which softens the fall but does not stop it. The reversal is violent precisely because positioning was extreme. A crowded trade unwinds through a narrow door.
Nothing here predicted the exact turning point. The report flagged the vulnerability months in advance, and the price chart supplied the trigger.
| Group | Who They Are | Typical Behavior | What Their Extremes Tend to Mean |
|---|---|---|---|
| Commercials | Businesses hedging real exposure | Position against the trend as hedging demand grows | Record shorts or longs often mark late-stage trends |
| Large speculators | Funds and managed money trading for profit | Run with trends and pile in as moves extend | Record net positions signal crowding and thin remaining fuel |
| Small traders | Non-reportable residual, loosely retail | Noisy, often late to moves | Alignment with speculator extremes adds to the crowding signal |
| Net spread | Gap between speculator and commercial positioning | Widens as trends mature | Multi-year wides flag the most vulnerable, fuel-heavy markets |
The COT Report, Answered
How often is the COT report published?
Weekly. The CFTC releases it on Friday, and the data reflects positions held as of the prior Tuesday. That three-day gap is built into everything you do with it.
Is the COT report useful for spot forex traders?
Yes, with an adjustment. Spot forex has no centralised positioning data, but currency futures track the same exchange rates. Speculator positioning in a currency futures contract is a reasonable proxy for how the broader market is leaning on that pair.
What does net positioning tell you?
It tells you which direction a group leans and how heavily, in a single number. Long contracts minus short contracts: positive means net-long, negative means net-short, and the size relative to history is what carries the signal.
Can COT extremes predict reversals?
No. Extremes flag vulnerability, not timing, and crowded trends can stay crowded far longer than seems reasonable. Use the report to size your respect for a trend's risk, and let price action decide when to act.
Next up is the VIX, a sentiment gauge built from option prices rather than positions. Where the COT report shows you where money sits, the VIX shows you how much traders will pay to sleep at night, and the two together give sentiment a second dimension.