How to Read the Balance Sheet
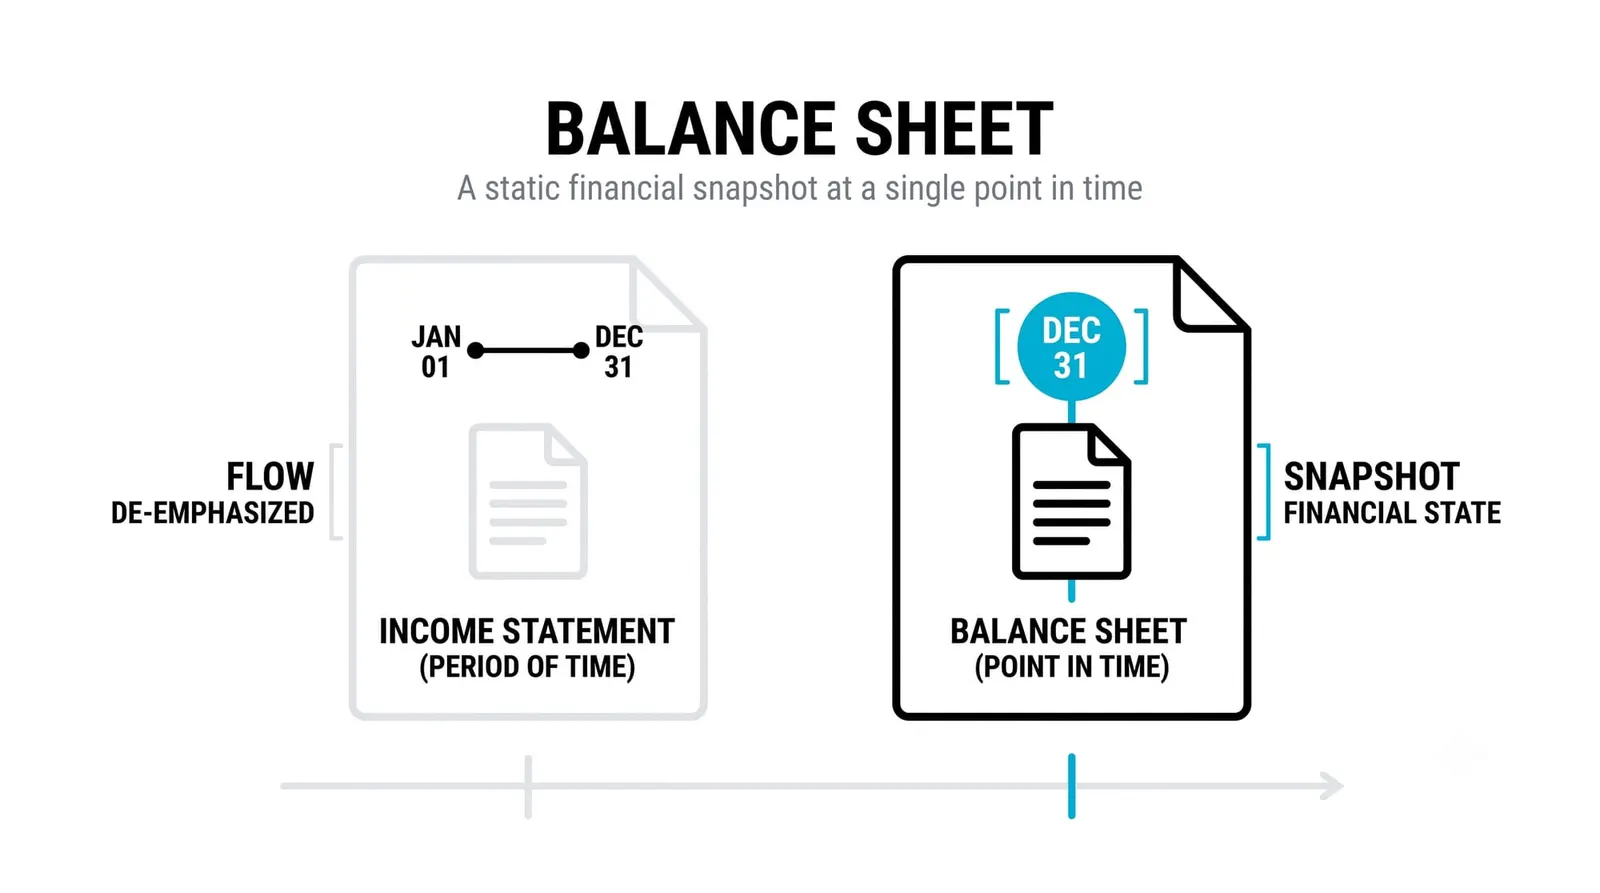
The balance sheet is the financial statement that shows what a company owns and what it owes on a single date, with the difference between the two recorded as shareholders' equity. It is a position, not a performance. The income statement you studied last lesson tells you how the company did over a period of time. The balance sheet freezes one moment and asks a different question: where does this business stand right now, and how exposed is it?

Think of it as a set of scales. Assets sit on one pan, liabilities on the other, and equity is the difference the scales are built to display. Every company files one every quarter, and learning to read it is where valuation stops being abstract and starts being concrete.
The Equation That Never Breaks
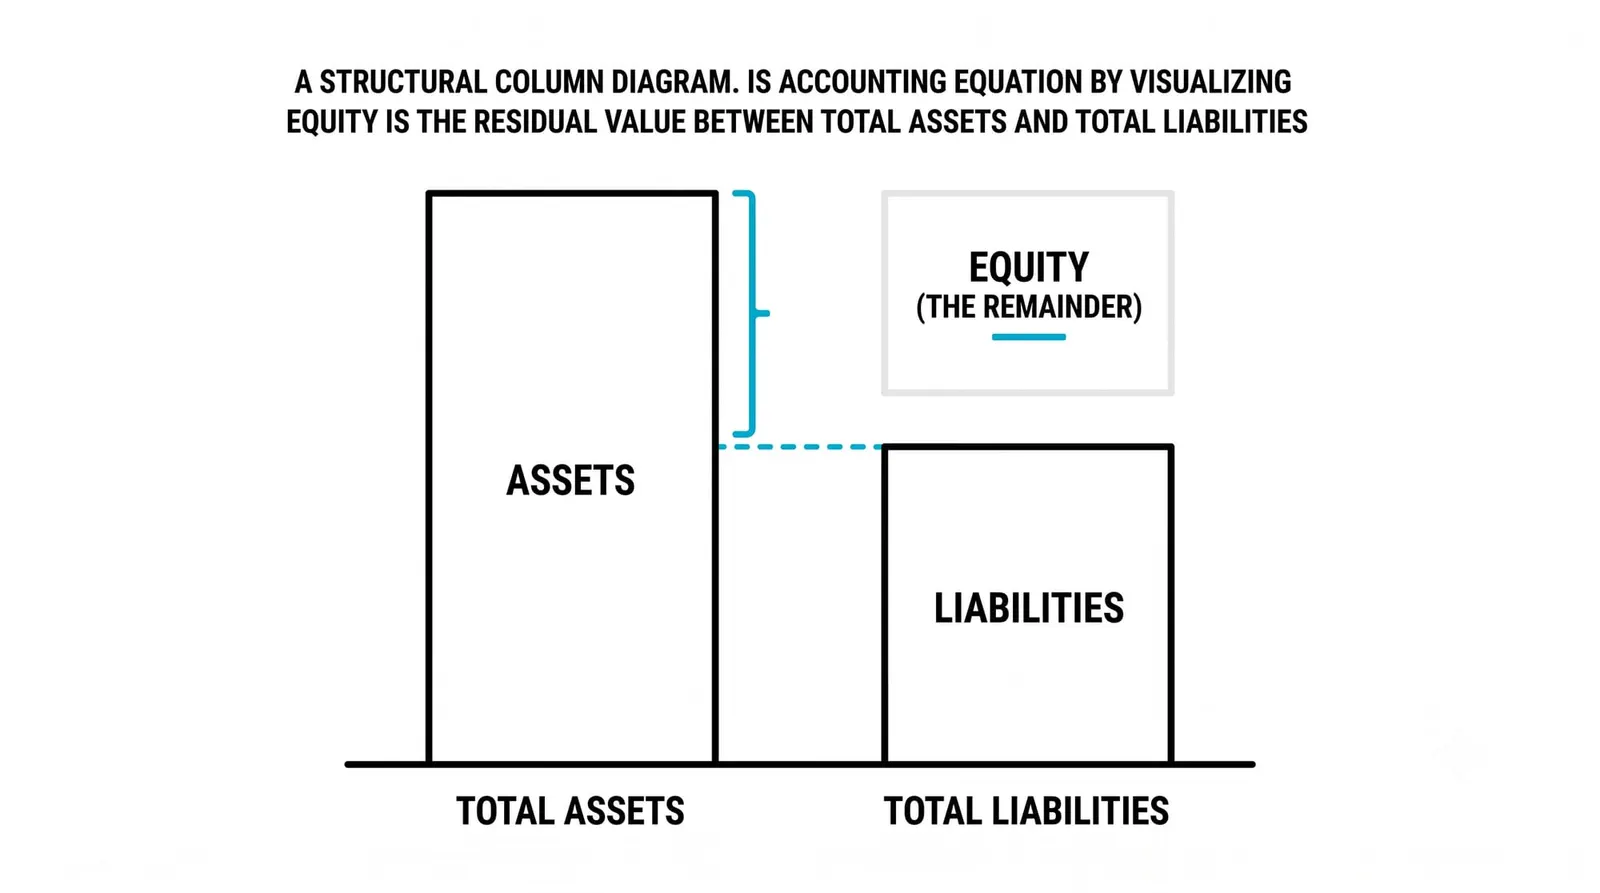
Every balance sheet obeys one rule: assets equal liabilities plus equity. This is not a theory or a tendency. It is an accounting identity, built into how the document is constructed. If a company owns 100 units of value and owes 60, the remaining 40 belongs to shareholders by definition. There is no other place for value to go.
The equation holds because equity is defined as the residual. Accountants do not measure equity independently and check whether it fits. They measure what the company owns, measure what it owes, and subtract. If the two sides of a published balance sheet ever failed to match, the document would be wrong, not the equation.
Both sides split by time. Current assets are things the company expects to convert to cash or use within a year. Long-term assets are everything it will hold longer. Current liabilities are obligations due within a year, and long-term liabilities are everything due later. That one-year line runs through the whole document, and you will see it again when debt and leverage ratios get their own lesson next.
Why does this matter to you as an analyst? Because the equation forces honesty. A company cannot make itself look richer by acquiring things on credit. Every borrowed asset arrives with a matching liability, and the scales stay level even when the risk underneath them has changed.
Assets: What the Company Owns or Is Owed
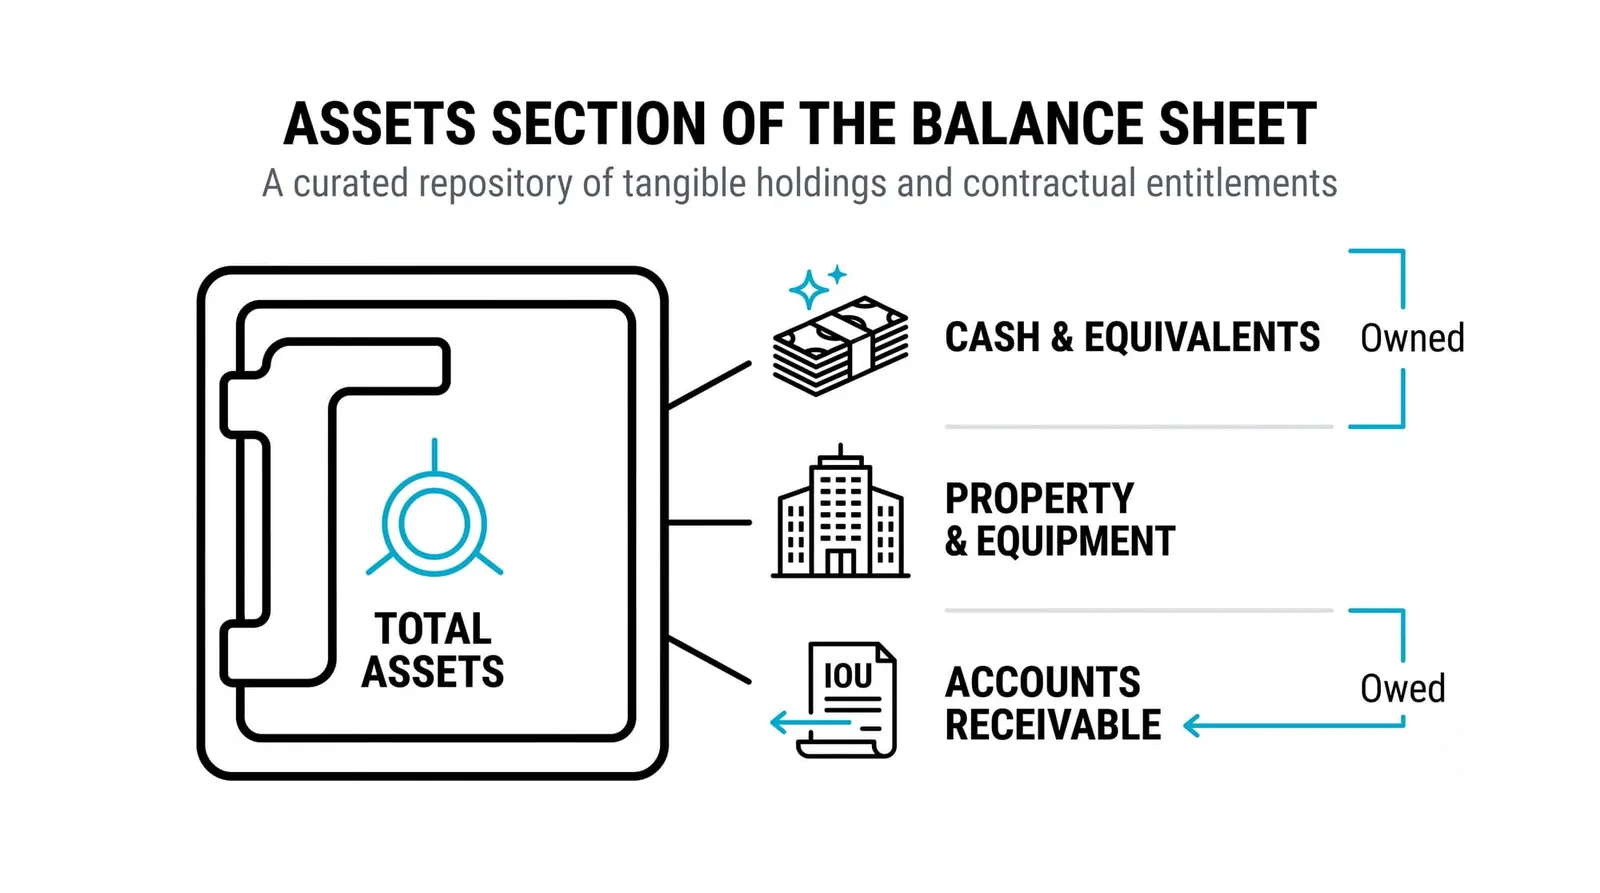
Start at the top of the asset column with cash. It is the simplest line: money in the bank, available now. Everything below it gets progressively less liquid and harder to value.
Inventory comes next for most businesses. This is raw materials, work in progress, and finished goods waiting to be sold. Inventory is an asset because it should become revenue, but it carries risk. Unsold goods can be marked down, and some inventory never sells at all.
Receivables are money customers owe the company for goods already delivered. The sale has happened; the cash has not arrived. A growing receivables balance can mean healthy sales, or it can mean customers are paying slowly. The number alone does not tell you which.
Then come property and equipment: buildings, machinery, vehicles. These are the long-term assets, the things the business uses for years to produce what it sells.
Here is the caveat most beginners miss. Assets are recorded at what was paid for them, minus accumulated wear, not at what they could be sold for today. A building bought decades ago may sit on the books at a fraction of its current market price. A piece of specialized equipment may be recorded at far more than anyone would pay for it secondhand. The asset column is a record of historical cost, not a live price list. Treat it that way.
Liabilities: What the Company Owes
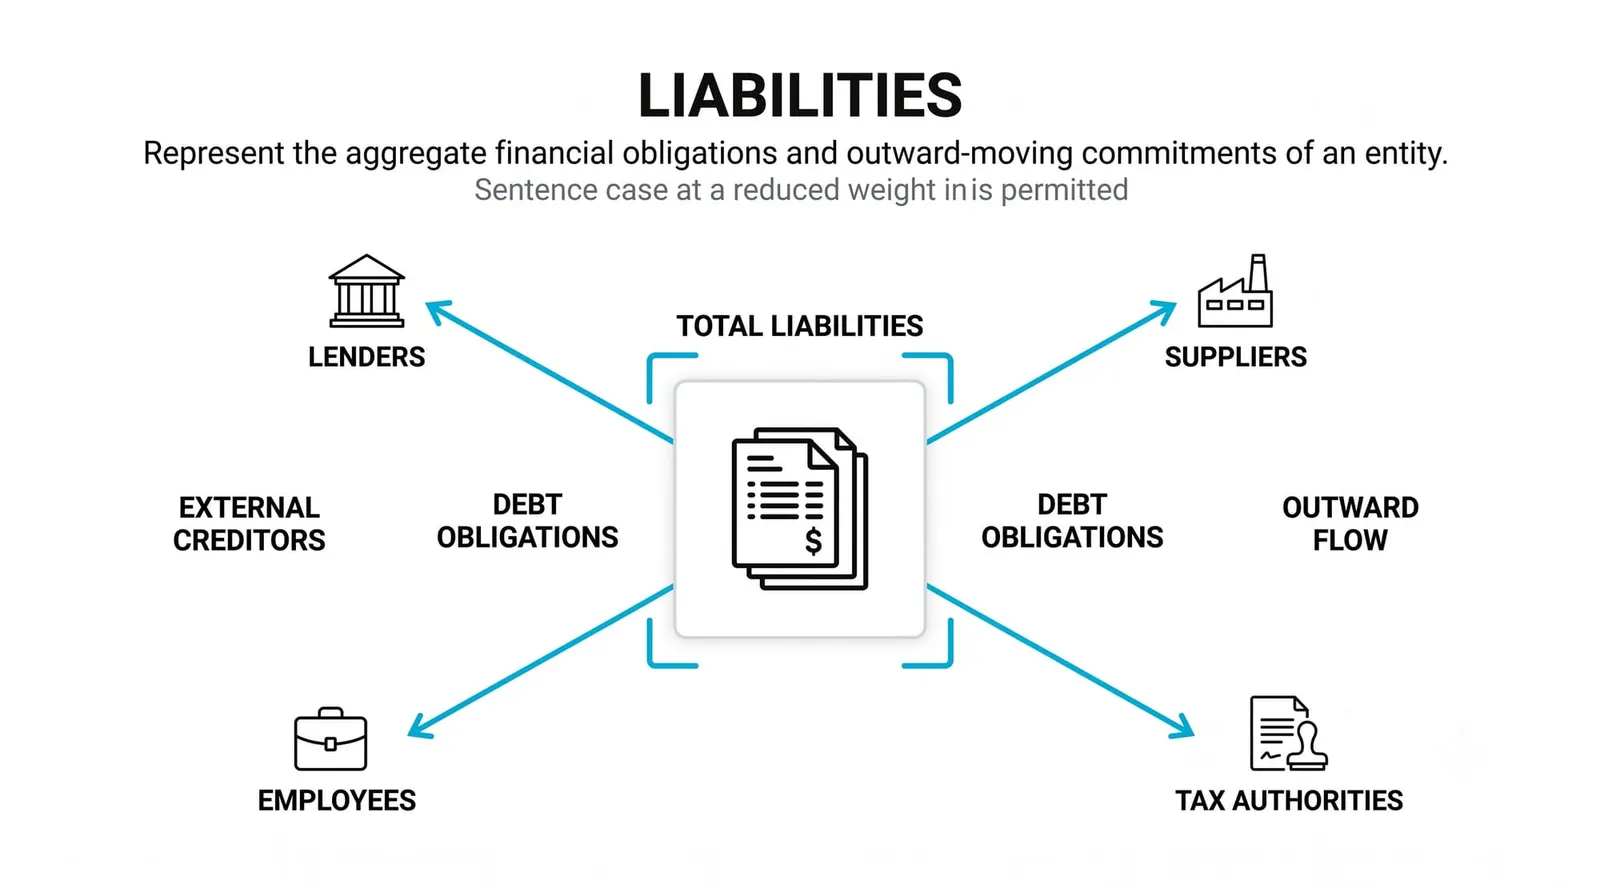
Flip to the other pan of the scales. The lightest liabilities are the everyday ones: unpaid supplier bills, called accounts payable. The company received goods and has not yet paid. Small, routine, and usually due within weeks.
Short-term debt is borrowing that comes due within a year. It demands attention because it must be repaid or refinanced soon, regardless of how the business is doing.
Long-term loans sit further down. These are bonds and bank borrowings due years out. They give the company room to breathe, but they also lock in interest payments that arrive whether profits do or not.
One liability confuses almost everyone the first time: deferred revenue. This is cash the company has already collected for goods or services it has not yet delivered. A customer prepaid, so the company holds the money but owes the work. It is a liability because it is a promise. Until the company delivers, that cash is spoken for. When you see deferred revenue growing, the company is collecting ahead of delivery, which is usually a sign of demand, but the obligation is real either way.
Equity: The Residual Claim
Equity is what is left after liabilities are subtracted from assets. It is the shareholders' slice, and it is a claim on residual value, not a pile of money sitting somewhere. You cannot walk into a company and point at the equity.
The biggest component inside equity is usually retained earnings: the accumulated profits the company has kept in the business rather than paid out as dividends, minus any accumulated losses. Year after year, profitable quarters flow into this line. It is the financial memory of the business.
Equity can be negative. If liabilities exceed assets, the subtraction produces a number below zero. This happens when accumulated losses have eaten through everything the shareholders originally put in, or when a company has borrowed heavily to fund buybacks or dividends. Negative equity means that if the company sold everything at book value and paid every debt, shareholders would get nothing and creditors would still be short. It does not automatically mean the company is doomed, because book values are not market values and future profits can rebuild the position. But it is a serious warning sign, and it tells you the business has been consuming capital rather than building it.
Remember the P/B ratio from earlier in this level. The book value in that ratio is exactly this equity figure, taken straight from this document. Now you know where it comes from and what its limits are.
Weighing One Company
Take a hypothetical company with clean round numbers. Its balance sheet shows total assets of 900,000: cash of 100,000, inventory of 200,000, and equipment of 600,000. On the other side, total liabilities of 400,000: a 300,000 loan and 100,000 in unpaid supplier bills.
Run the equation. Assets of 900,000 minus liabilities of 400,000 leaves equity of 500,000. The scales balance because they must.
Now the company borrows another 100,000 in cash. Watch what happens. Cash rises by 100,000, so total assets become 1,000,000. The loan increases liabilities by 100,000, so total liabilities become 500,000. Equity stays at 500,000. Nothing about the shareholders' residual claim changed, because the company gained an asset and an obligation of exactly equal size.
The scales still balance, but the company is not the same company. Before the borrowing, liabilities were 400,000 against 900,000 of assets. After, liabilities are 500,000 against 1,000,000. More of the asset base is now funded by creditors rather than by the owners. The company has more cash to work with, but it also has a fixed obligation to repay, with interest, on a schedule it does not control. If the business stumbles, the loan payment still arrives.
This is the habit to build: when any balance sheet changes, ask what happened to both pans, never one alone. Borrowed growth looks identical to earned growth on the asset side. The liability side is where you find out who is really funding the expansion. Measuring exactly how much debt a company carries relative to its equity and its earnings is a discipline of its own, and it gets the next lesson.
| Line | What it is | What it tells you |
|---|---|---|
| Assets | Everything the company owns or is owed, recorded mostly at historical cost | The resources the business has to work with, split into current and long-term |
| Liabilities | Everything the company owes, from supplier bills to long-term loans | The obligations that must be met regardless of how the business performs |
| Equity | Assets minus liabilities, including retained earnings | The shareholders' residual claim, and the book value behind the P/B ratio |
| The equation | Assets = liabilities + equity, always | That every asset is funded by someone, either creditors or owners |
The Balance Sheet, Answered
What does a strong balance sheet look like?
A strong balance sheet shows enough cash and current assets to cover short-term obligations comfortably, debt that is modest relative to equity, and retained earnings that have grown over time. Strength is about resilience: the company can absorb a bad year without being forced into desperate moves. No single number proves it, so look at the whole structure rather than one line.
Can shareholders' equity be negative?
Yes. Equity is negative whenever liabilities exceed assets, which usually follows years of accumulated losses or heavy borrowing to fund payouts. It means the residual claim is worth less than nothing at book value. It signals serious financial stress, though companies can and do rebuild equity through sustained profits.
What is the difference between current and long-term?
The dividing line is one year. Current assets are expected to become cash or be used within twelve months, and current liabilities are due within twelve months. Anything beyond that horizon is long-term. The split exists so you can check whether near-term obligations are covered by near-term resources.
How often is the balance sheet published?
Public companies publish a balance sheet every quarter as part of their regular filings, with the year-end version audited. Each one is dated to a single day, so it reflects the position at that moment and nothing after. Comparing several quarters side by side shows you the direction the position is moving, which is far more useful than any single snapshot.
You can now read the document that tells you what a company is made of. Next, put that reading to work: debt levels and leverage ratios, where the liability side of the scales gets measured, compared, and stress-tested.