Debt Levels and Leverage Ratios
Leverage ratios measure how much of a company's operation is funded by borrowed money rather than its own equity: debt relative to assets, debt relative to equity, and profit relative to the interest it must pay. They are how a reader turns the liability side of the balance sheet into a statement about risk.
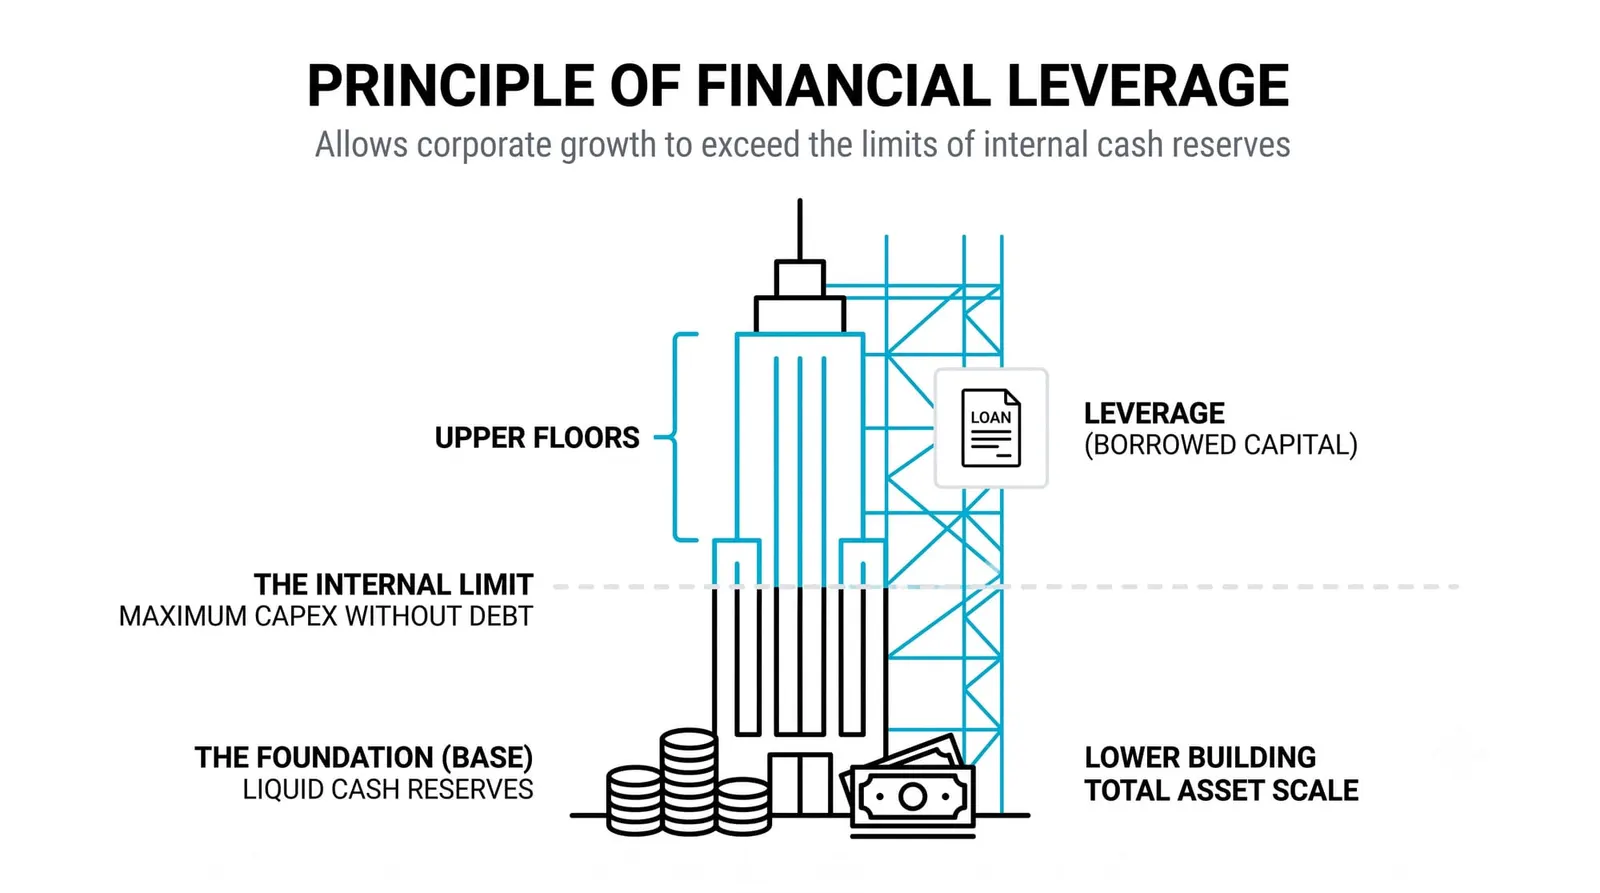
Borrowed money is amplification. When a business earns more on its assets than the interest it owes, the surplus flows to shareholders and returns look bigger than they would have been with equity alone. When the business stumbles, the interest bill stays exactly the same, and the loss lands on shareholders with the same magnification. Debt enlarges both directions.
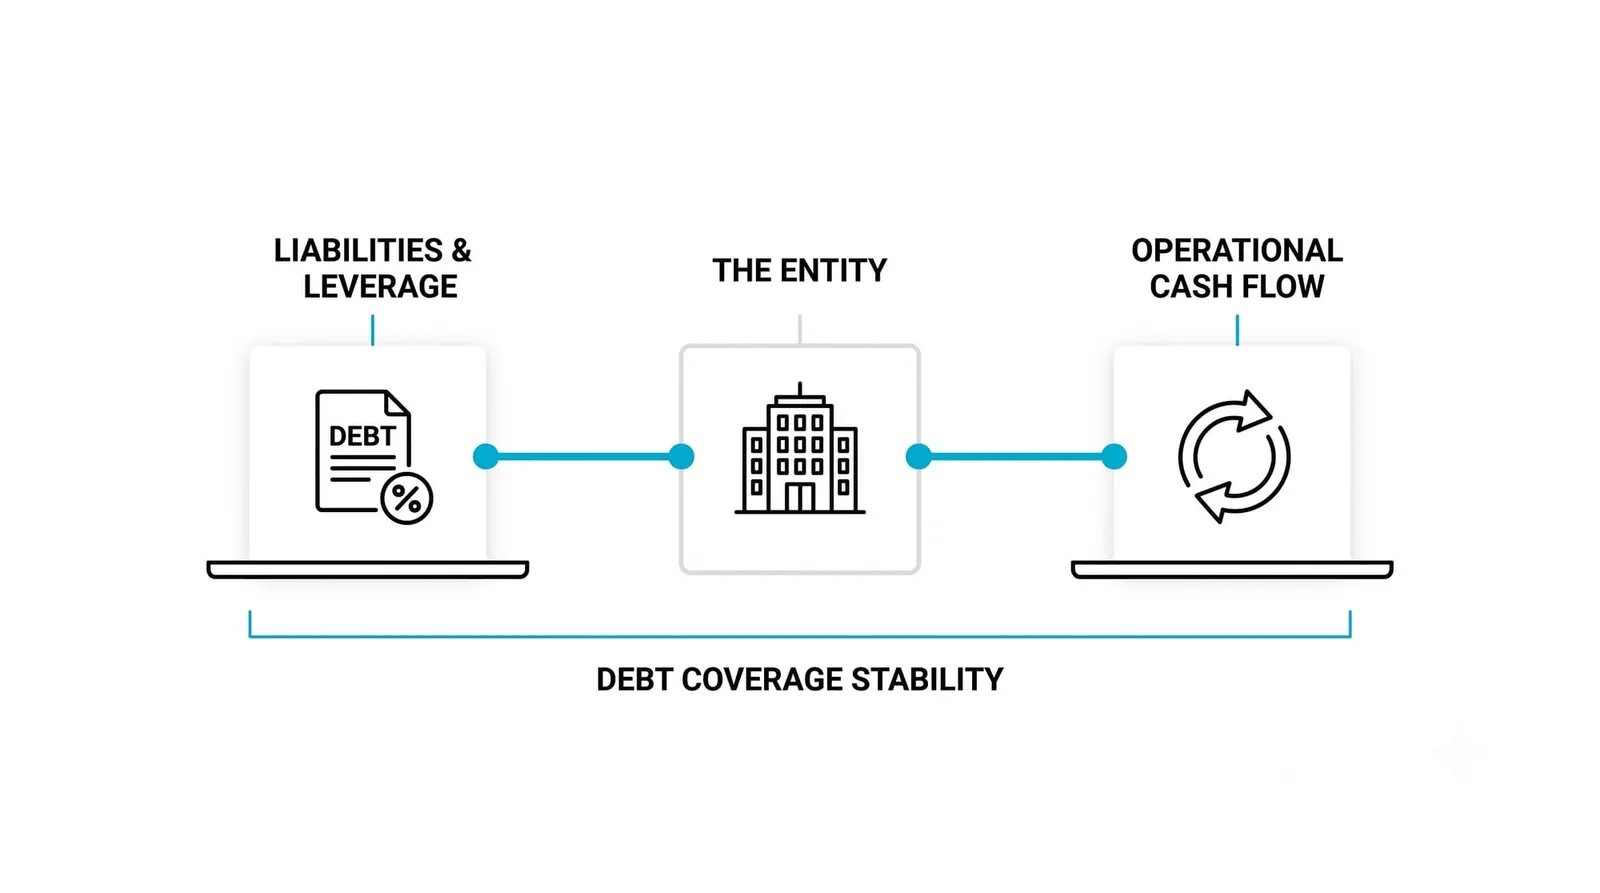
Think of a lender as a silent partner who demands the same payment every quarter whether the year was excellent or terrible. Leverage ratios measure how loud that partner's voice is in the company's affairs. A quiet partner barely matters. A loud one can take the company away from you.
The previous lesson walked through the balance sheet as a whole. This one zooms into its liability side, where the borrowing lives, and asks the question the balance sheet alone cannot answer: how much debt is too much for this particular business?
Why Companies Borrow at All
Debt exists because it is usually cheaper than equity when things go well. A shareholder who funds the business expects a share of all future profits forever. A lender expects a fixed payment and nothing more. If the company earns well above the interest rate, borrowing is the cheaper source of fuel.
There is also a structural subsidy. In many jurisdictions, interest payments are deductible against taxable income, which lowers the effective cost of borrowing compared with paying dividends to shareholders. That tax treatment is one reason debt appears on so many balance sheets even at profitable companies.
The third reason is ownership. Issuing new shares dilutes existing owners, slicing the same pie into more pieces. Borrowing funds growth while leaving the ownership structure untouched. For founders and long-term holders, that matters as much as the cost.
None of this makes debt free. It makes debt attractive precisely when the future looks bright, which is exactly when caution is hardest to apply.
The Ratios That Measure Leverage
Three ratios do most of the work.
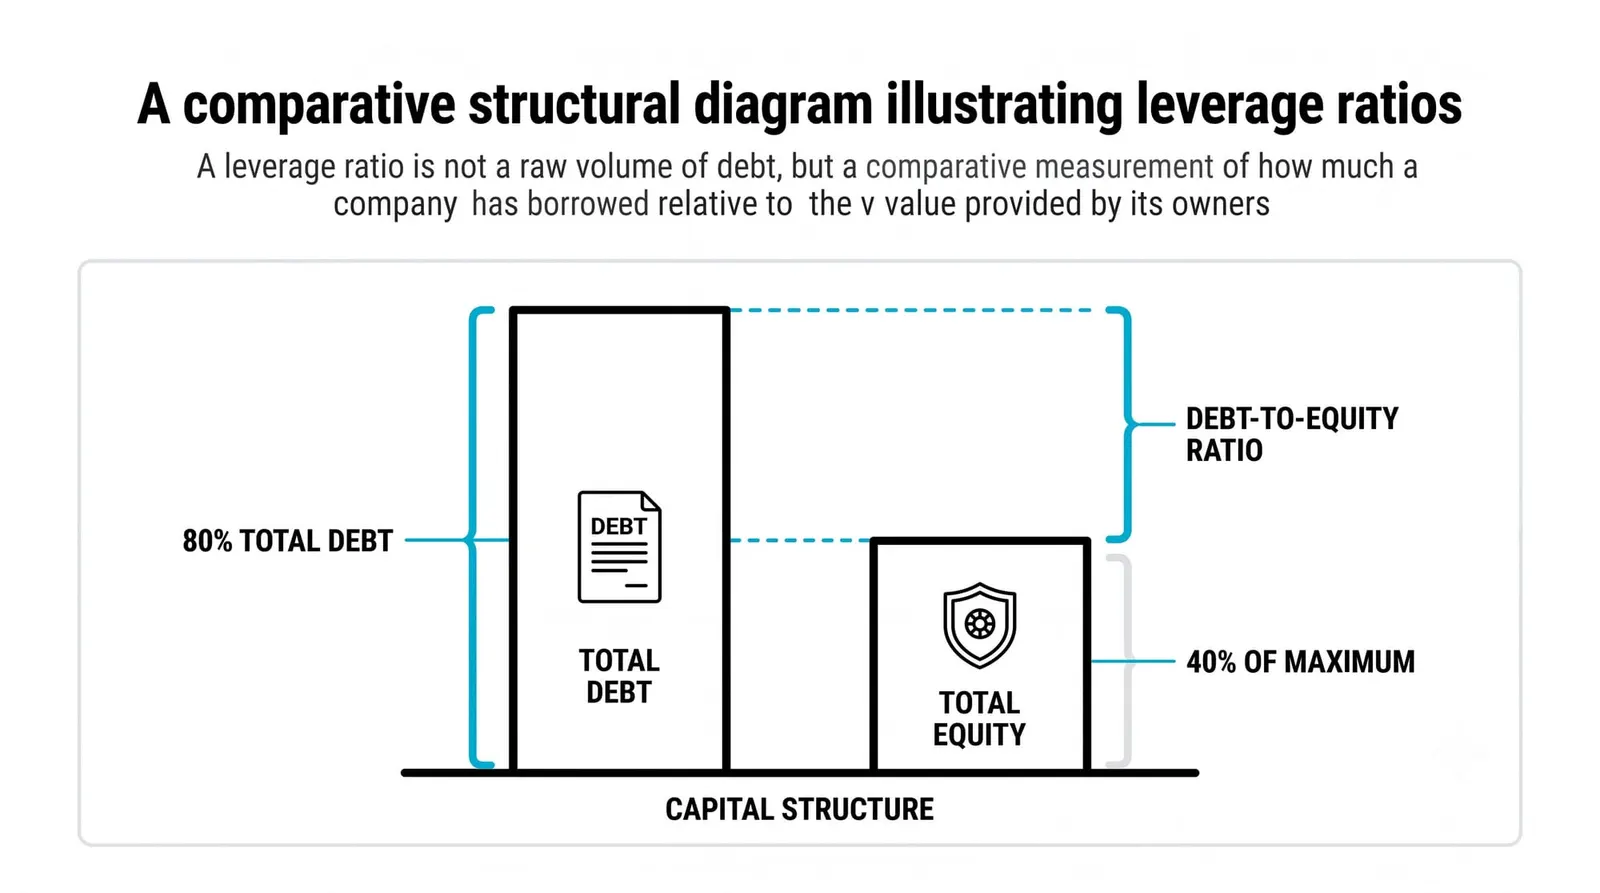
Debt-to-equity divides total debt by shareholders' equity. It answers: for every dollar the owners have put in, how many dollars have creditors put in? A reading of 2.0 means lenders have supplied twice what owners have.
Debt-to-assets divides total debt by total assets. It answers: what fraction of everything the company controls was bought with borrowed money? A reading of 0.6 means creditors funded sixty cents of every dollar of assets.
Interest coverage divides operating profit by the annual interest expense. It answers: how many times over could the business pay its interest bill out of what the operations actually earn? A reading of 5 means the company earns its interest cost five times over each year.
Practitioners often check coverage first. The reason is simple: the other two ratios describe structure, while coverage describes survival. A company can carry a heavy debt-to-equity figure for decades if its profits comfortably service the bill. Coverage is where the rubber meets the road, because interest is paid in cash, on a schedule, with no negotiation at the deadline.
When Debt Becomes a Real Risk
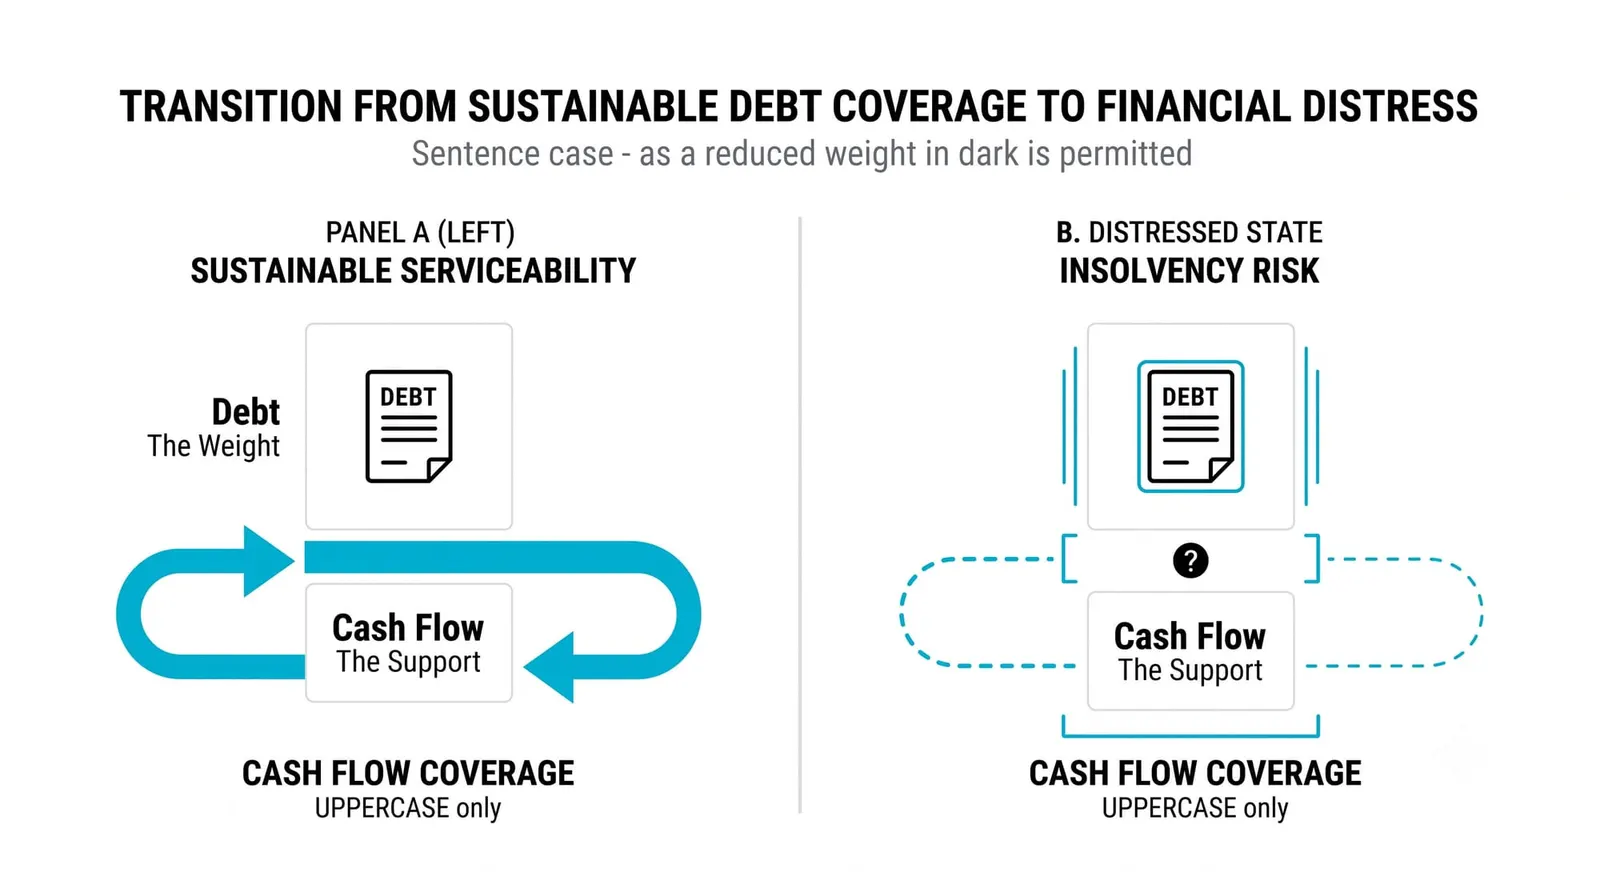
The core tension is fixed obligations against variable profits. Interest does not care about the economy, the product cycle, or a bad quarter. Profits care about all of those things. The wider the gap between the fixed promise and the variable income, the more fragile the structure.
Refinancing risk is the quieter danger. Most debt is not held to a distant maturity; it is rolled over. When a loan comes due, the company must borrow again at whatever terms the market offers at that moment. A business that borrowed cheaply can find itself renewing at painful rates. You learned earlier in this level how interest rates move through the economy: the same loan gets heavier when rates rise, even though the principal never changed.
The classic failure pattern is a coverage collapse in a bad year. A company earning its interest four times over looks safe. Then revenue drops a third, margins compress, operating profit halves, and coverage falls below one. Nothing about the debt changed. Everything about the capacity to carry it did.
This is why the trend matters more than any single reading. A debt-to-equity of 1.5 that has held steady for a decade tells a different story than one that climbed from 0.5 to 1.5 in three years. The level describes position. The direction describes behavior, and behavior is what eventually breaks companies.
Context Is Everything: Industries Differ
Some businesses are built to carry debt. A utility with regulated revenues or a property company with long leases collects cash on a schedule almost as predictable as its interest bill. Heavy borrowing against that kind of cash flow is a design choice, and it can run safely for generations.
Other businesses cannot support it. A software firm whose revenue depends on winning renewals each year has variable income and few hard assets to borrow against. The same debt load that is routine for a utility would be reckless there.
The lesson is that different industries carry structurally different debt loads, so ratios only make sense against sector norms and the company's own history. A debt-to-equity of 2.0 is alarming in one sector and unremarkable in another. Before judging a number, find out what the company's peers carry and what the company itself has carried over time. A ratio without a benchmark is just a number.
Two Businesses, Same Profit, Different Debt
Consider two hypothetical companies, each earning 100,000 in operating profit this year.
Company A has no debt. Its interest bill is zero. Its interest coverage is effectively infinite, because any profit at all exceeds a zero obligation. Its shareholders keep the full 100,000, minus taxes.
Company B borrowed heavily to expand. It pays 60,000 a year in interest. Its interest coverage is 100,000 divided by 60,000, roughly 1.7. In a good year that works: after interest, about 40,000 remains for shareholders, and if the borrowed money earns well, those shareholders enjoy a higher return on their smaller equity stake than Company A's owners do.
Now a bad year arrives and each company's operating profit halves to 50,000.
Company A's shareholders simply earn less. The business is smaller this year, but it owes nothing, so it survives on its own operations and waits for better conditions.
Company B's coverage falls to 50,000 divided by 60,000, about 0.8. Its operations no longer generate enough to pay the interest. The gap must come from cash reserves, asset sales, or new borrowing on worse terms. If none of those are available, the lenders move from silent partners to owners of the problem, and shareholders can lose everything while the business itself still operates. Same profit decline, completely different outcomes. The debt decided which.
| Ratio | What it compares | What a worsening reading suggests |
|---|---|---|
| Debt-to-equity | Borrowed funds against owners' funds | Creditors are financing a growing share of the business relative to owners |
| Debt-to-assets | Borrowed funds against everything the company controls | A rising fraction of the asset base depends on borrowed money |
| Interest coverage | Operating profit against the annual interest bill | Shrinking room for a bad year before operations cannot service the debt |
| Trend across periods | Each ratio against its own history | Management is leaning harder on borrowing over time, whatever the current level |
Leverage and Financial Risk, Answered
How much debt is too much for a company?
There is no universal threshold; the limit depends on how stable the company's cash flows are and what its industry normally carries. The practical test is interest coverage under stress: if a realistic bad year pushes coverage below one, the debt load is too heavy for that business regardless of what the ratios say in good times.
Why do some industries carry more debt than others?
Because debt capacity follows cash-flow predictability. Utilities, pipelines, and property firms collect revenue on steady schedules, so lenders will fund them heavily and they can service large interest bills safely. Businesses with volatile revenue and few tangible assets get offered less debt and can support less.
What happens when a company cannot pay its interest?
Missing an interest payment is a default, and it gives creditors legal rights over the company. Depending on the situation, that leads to renegotiated terms, forced asset sales, or a restructuring in which lenders take ownership and existing shareholders are diluted or wiped out.
Does debt ever make shareholders better off?
Yes, whenever the business earns more on the borrowed money than the interest costs. In that case the surplus accrues entirely to shareholders, raising their return on equity above what an all-equity structure would produce. The same mechanism magnifies losses when the returns fall short, which is why the benefit and the danger are the same property viewed in different years.
Debt and equity meet inside one number that investors quote constantly: the cost of capital. The next lesson builds it piece by piece, showing how a company blends what lenders charge with what shareholders demand into a single hurdle rate every project must clear.