The Cash Flow Statement, Explained
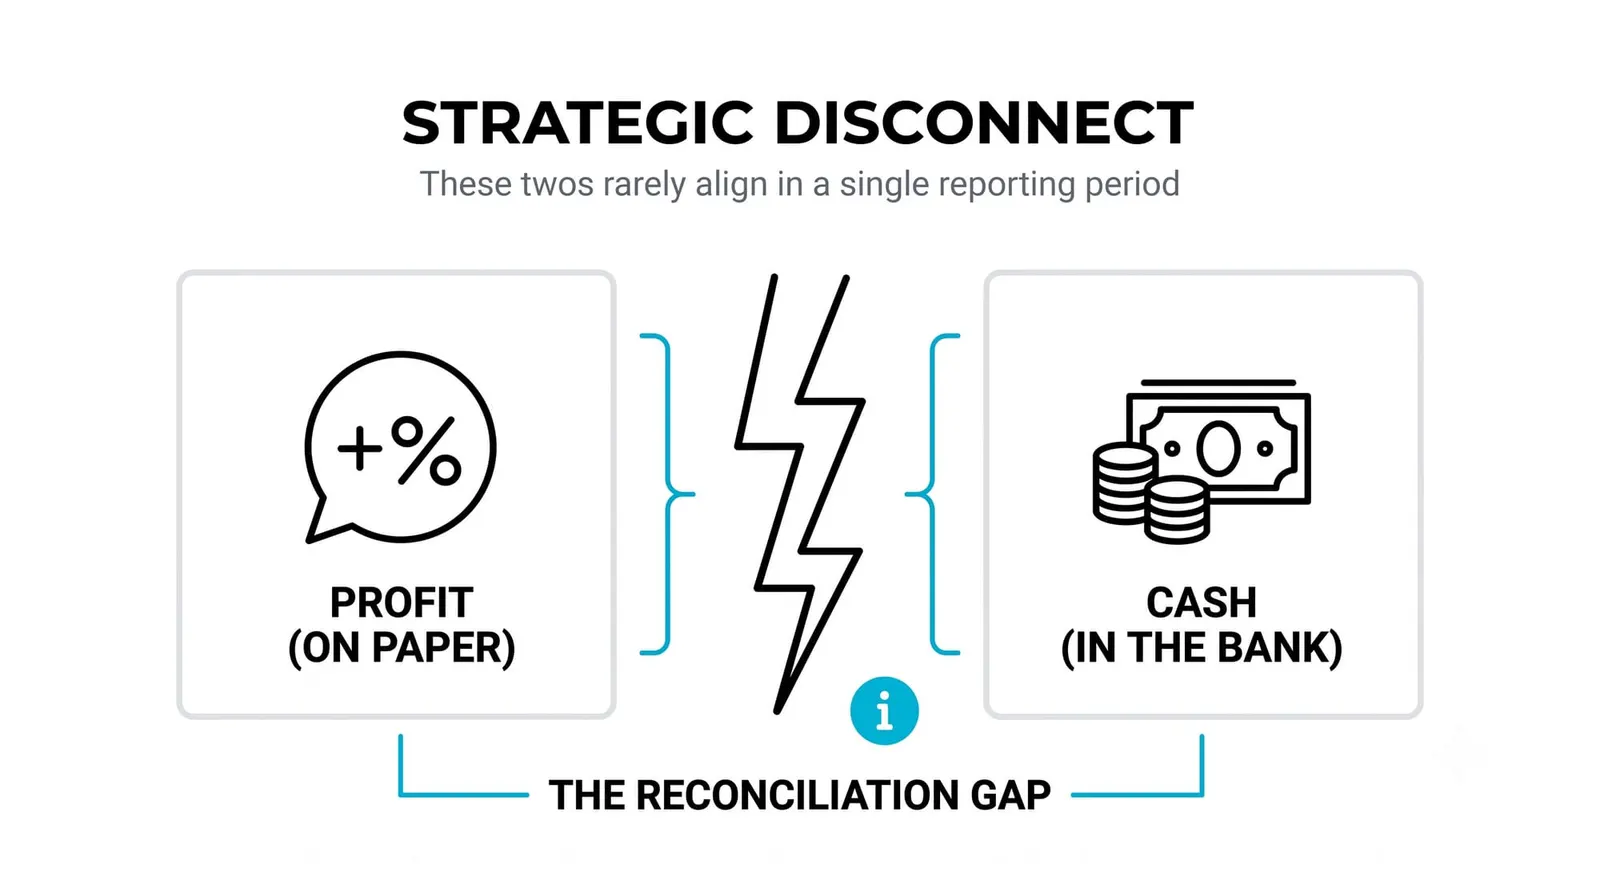
The cash flow statement is the financial statement that tracks actual cash moving in and out of a company across a period, split into operating, investing, and financing activities. It exists because profit and cash are two different things. Profit involves judgment and timing. Cash either cleared the bank or it did not.

The bank account does not care what the invoice says; the cash flow statement reads straight from the account, money that arrived and money that left, sorted by why. Everything after that first sentence is categorization.
In the last lesson you met the balance sheet, which is a snapshot of what a company owns and owes at one moment. The cash flow statement is its moving companion. It explains how the cash line on that snapshot changed between two dates.
Earlier in this level, the revenue-and-margins lesson touched profit quality. This document is where quality gets checked. A company can report rising earnings year after year, and the cash flow statement will tell you whether those earnings ever turned into money.
The Three Sections and What Each Captures
Every cash flow statement splits into three parts, and the split is standardized, so once you learn it you can read any company's version.
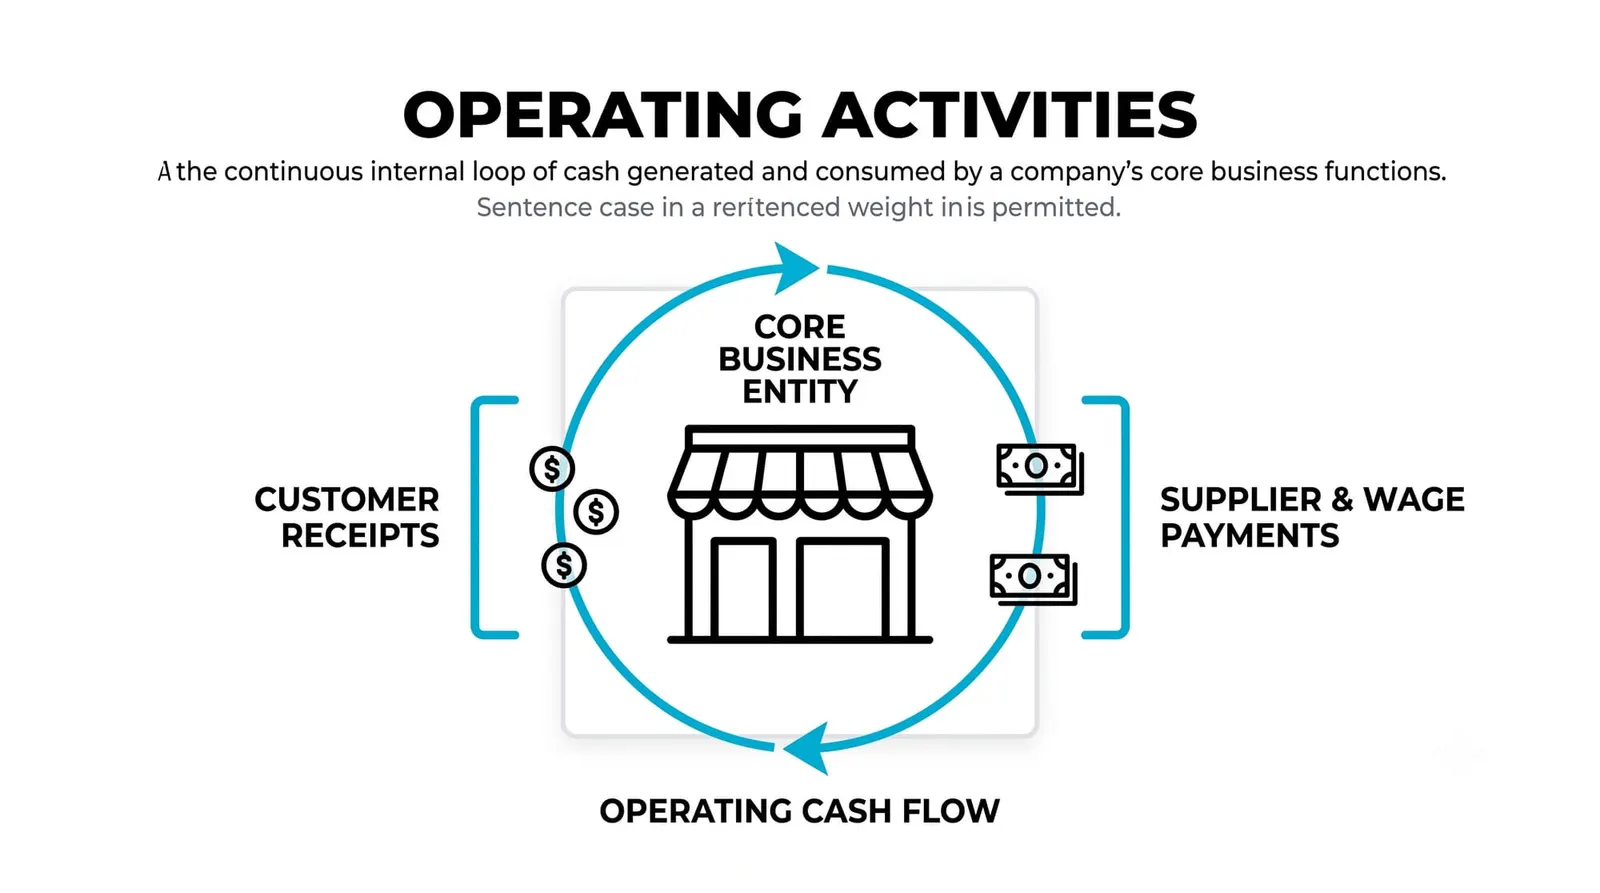
Operating activities come first. This is cash generated by running the business itself: money collected from customers, minus money paid to suppliers, employees, landlords, and tax authorities. For most companies, this is the section that matters most, because it answers the question of whether the core business produces cash or consumes it.
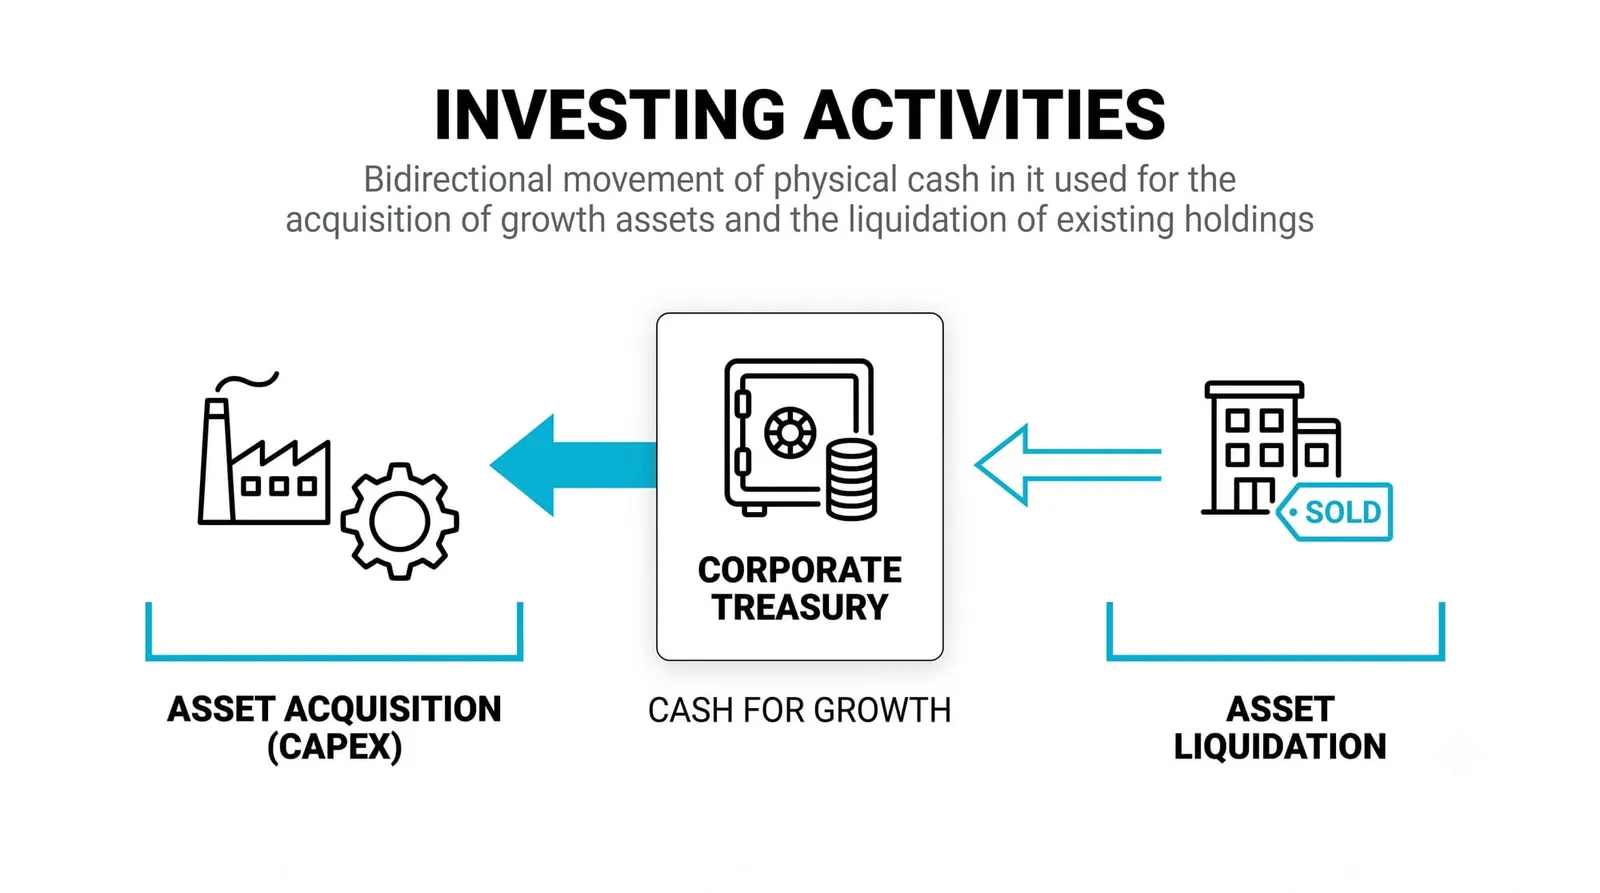
Investing activities come second. This covers buying and selling long-term assets: equipment, buildings, subsidiaries, and financial investments. When a manufacturer buys a new production line, the cash outflow lands here, not in operating. Note the word "investing" here means the company investing in itself, not you investing in the company.
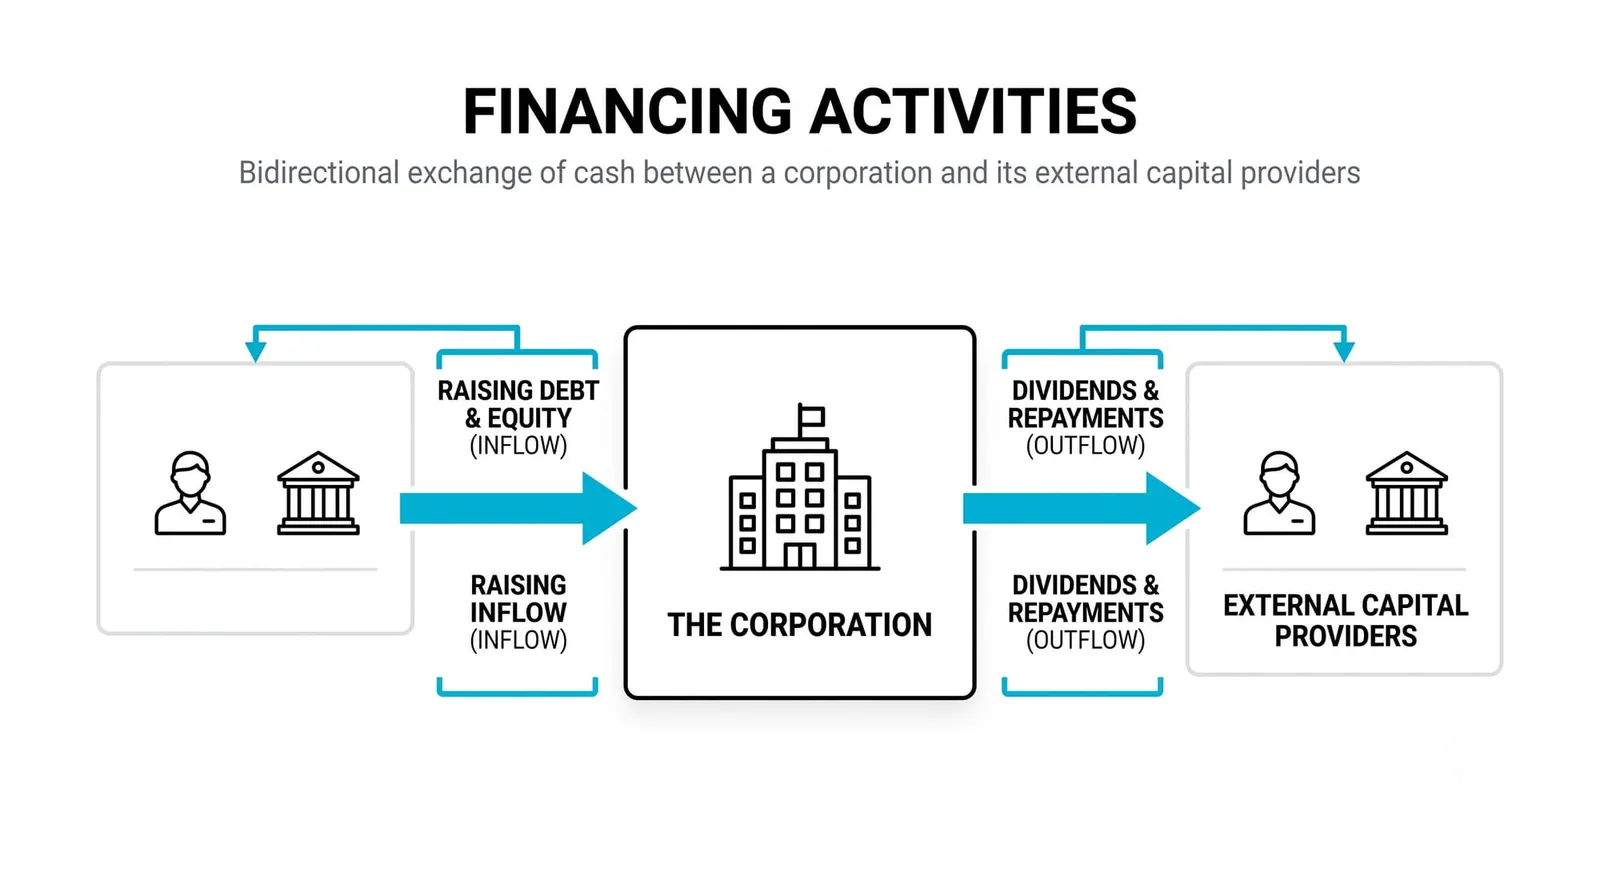
Financing activities come third. This is cash moving between the company and its funders: money raised by borrowing or issuing shares, money paid out to repay debt, distribute dividends, or buy back stock.
The sign conventions are simple. Inflows are positive numbers. Outflows are negative, usually shown in parentheses. Add the three sections together and you get the net change in cash for the period.
A healthy pattern, as a starting template, looks like this: operating is positive, investing is negative (the company is spending on its future), and financing is modest in either direction. Deviations from that template are not automatically bad. They are questions to answer.
Why Profit and Cash Diverge
Start with the income statement's basic habit: it records revenue when it is earned, not when it is collected. A company that sells goods on 60-day credit terms books the revenue today and waits two months for the money. Until the customer pays, that sale lives on the balance sheet as a receivable. Profit went up. Cash did not move.
The same logic runs in reverse for expenses. A company can owe wages, rent, or supplier bills at period end. The expense hits the income statement, but the cash leaves later, when the bill is actually paid. These unpaid amounts sit as payables.
Then there is depreciation, the quietest source of divergence. When a company buys a machine, the cash leaves immediately through investing activities. But the income statement spreads the cost over the machine's useful life, deducting a slice each year as depreciation. That slice reduces reported profit every year while touching no cash at all. This is why the operating section of the cash flow statement typically starts with net profit and adds depreciation back.
Most of the gap between profit and cash is timing, not trickery. Credit sales eventually get collected. Bills eventually get paid. Depreciation eventually runs out. But timing gaps can stretch for years, and a company has to survive the gap. That is why the cash flow statement exists as a separate document rather than a footnote.
Reading Cash Flow for Quality
One comparison does most of the work here: put operating cash flow next to net profit, over several periods, and ask whether they travel together.
Operating cash flow persistently below net profit is the classic warning sign. It means reported earnings are not converting into money. Sometimes the explanation is innocent, like a fast-growing company extending credit to win customers. Sometimes it means revenue is being booked aggressively. The statement alone will not tell you which. It will tell you to keep digging.
The sharper version of the pattern is growing profit alongside shrinking operating cash flow. Earnings up, cash down, year after year. That combination deserves real skepticism, because over a long enough window, genuine profits show up as cash. Accounting profit is an opinion repeated annually. Operating cash flow is a count.
One more line is worth learning by name. Free cash flow is operating cash flow minus capital spending, the money a company must put into equipment and facilities to keep running and growing. It measures the cash left over after the business has paid to maintain itself, which is the pool available for dividends, buybacks, debt reduction, or expansion. A company can have positive operating cash flow and negative free cash flow if its capital needs are heavy, and that distinction changes how you judge it.
What a Healthy Cash Flow Pattern Looks Like
Read the three sections as a short story rather than three isolated numbers.
For a mature, healthy company, the story usually reads: operating strongly positive, investing negative at a level that roughly matches sensible reinvestment, and financing modestly negative as the company pays dividends or reduces debt. The business funds itself, maintains its assets, and returns the surplus. Nothing in that story requires outside rescue.
A young growth company tells a different but still coherent story. Operating cash flow may be small or even negative. Investing is heavily negative because the company is building capacity. Financing is strongly positive because the gap is funded by borrowing or issuing shares. That pattern is sustainable only while funders believe in the future operating cash flow. The risk is visible right there in the numbers.
A shrinking company shows the mirror image. Operating cash flow fades or turns negative. Investing may turn positive, which sounds good until you realize the company is selling assets to raise money. Financing turns negative as lenders get repaid or credit lines shrink. Each line alone looks explainable. Together they describe a business liquidating itself.
The lesson across all three cases is the same. No single section carries the verdict. The pattern across the three, repeated over several periods, is what you are actually reading.
Profitable on Paper, Thin at the Bank
Consider a hypothetical furniture maker with invented round numbers, purely as an illustration.
The company reports a profit of 50,000 for the quarter. Sales were strong, costs were controlled, and the income statement looks healthy.
Now look at the cash side. The company sells to retailers on 60-day payment terms, and sales grew fast this quarter, so receivables rose by 40,000. That is 40,000 of revenue already counted in profit that has not arrived as cash.
The walk from profit to operating cash flow, simplified, goes like this:
- Start with net profit: 50,000
- Subtract the increase in receivables (revenue booked but not collected): minus 40,000
- Assume no other major timing differences for simplicity
- Operating cash flow: 10,000
Now the problem. Payroll of 25,000 is due this month, and employees do not accept receivables as payment. The company earned 50,000 on paper and has 10,000 of operating cash against a 25,000 obligation.
The company has options: draw on a credit line, delay supplier payments, or push customers to pay faster. Each is financing or negotiation, not profit. If none of them work, a profitable company misses payroll.
This is how profitable companies fail. They do not run out of earnings. They run out of cash at a moment when a bill comes due. The income statement said the business worked. The cash flow statement said the timing did not. Both statements were accurate, and only one of them paid the wages.
Section by Section, at a Glance
| Section | What It Captures | What It Signals |
|---|---|---|
| Operating activities | Cash from customers minus cash paid to run the business | Whether the core business generates cash; the quality check on reported profit |
| Investing activities | Buying and selling equipment, property, and other long-term assets | How much the company reinvests; heavy outflows suggest building, inflows may suggest selling assets |
| Financing activities | Borrowing, repaying debt, issuing shares, dividends, buybacks | How the company is funded and whether it depends on outside money or returns cash to funders |
| Net change in cash | The sum of the three sections | Whether the cash balance grew or shrank over the period, and which section drove it |
The Cash Flow Statement, Answered
How can a company be profitable but run out of cash?
Because profit is recorded when revenue is earned and expenses are incurred, while cash moves when money actually changes hands. A company booking sales on long credit terms can show strong profit while its bank balance stays thin, and if a large obligation falls due before customers pay, the company can fail despite healthy earnings.
What is free cash flow?
Free cash flow is operating cash flow minus capital spending. It measures the cash left after the company has paid to maintain and expand its assets, which is the pool available for dividends, buybacks, debt repayment, or new projects.
Which section of the cash flow statement matters most?
Operating activities matters most for most companies, because it shows whether the core business generates cash on its own. Investing and financing can be heavily positive or negative for perfectly good reasons, but a business that cannot produce operating cash over time has a fundamental problem.
Is positive cash flow always a good sign?
No. Total cash flow can be positive because the company borrowed heavily or sold assets, both of which are finite sources of money. The section-by-section pattern tells you where the cash came from, and the source matters as much as the total.
You can now read the third core document. The next step is putting all three together, income statement, balance sheet, and cash flow statement, into a single picture of a company's financial health, which is where the analysis starts to resemble what professionals actually do.