The Income Statement: Revenue to Profit
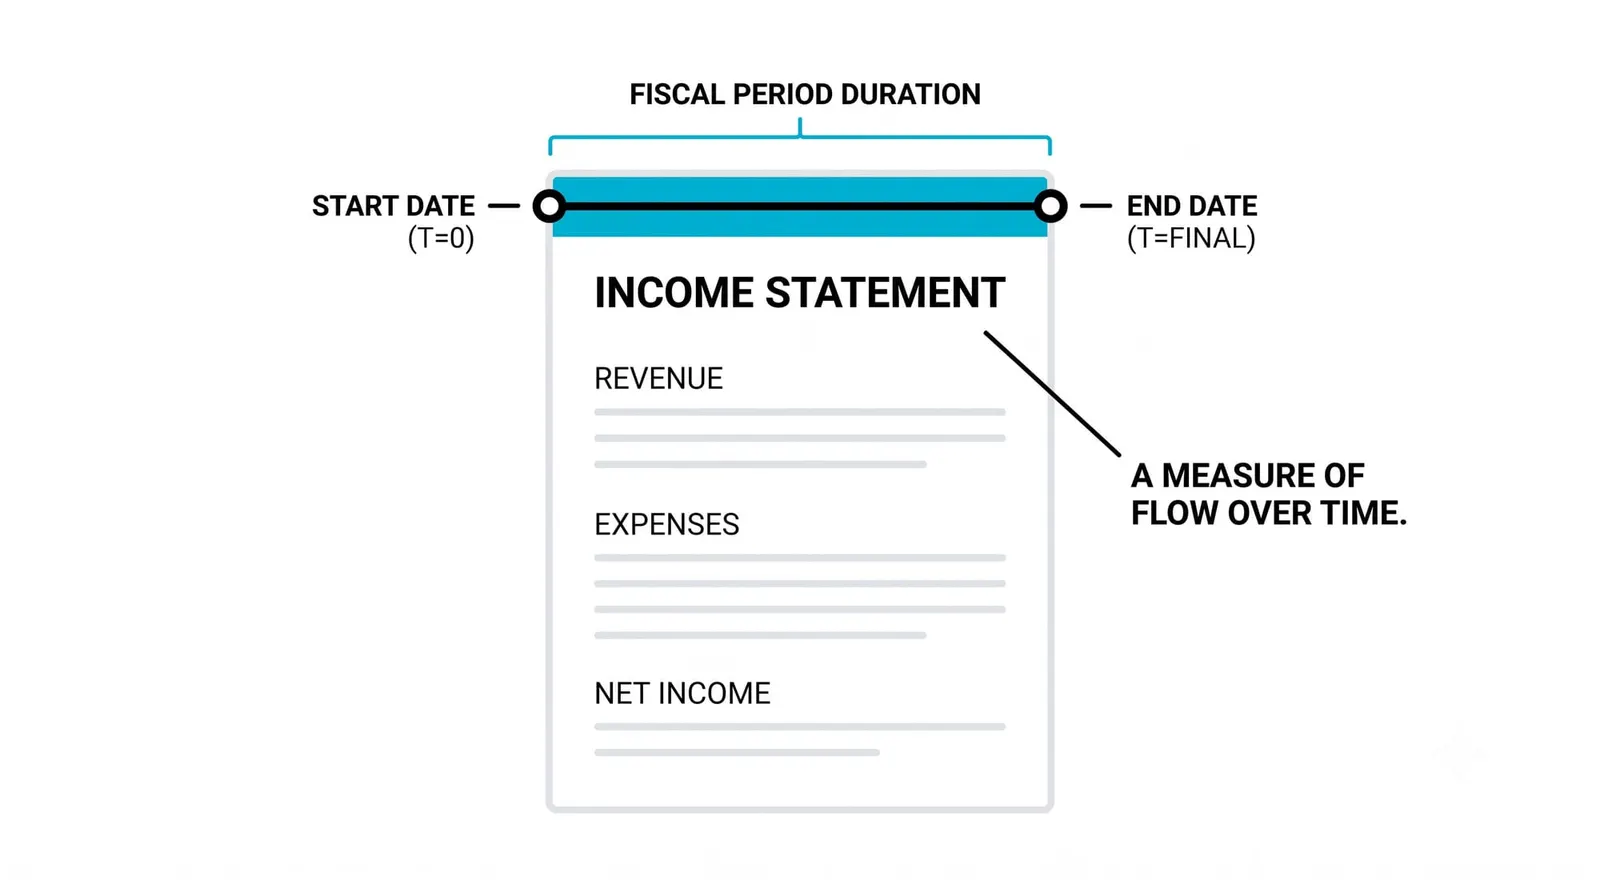
The income statement is the financial statement that reports a company's performance over a period: revenue at the top, expenses deducted line by line, profit at the bottom. Reading it well means following each subtraction in order rather than jumping to the final number.

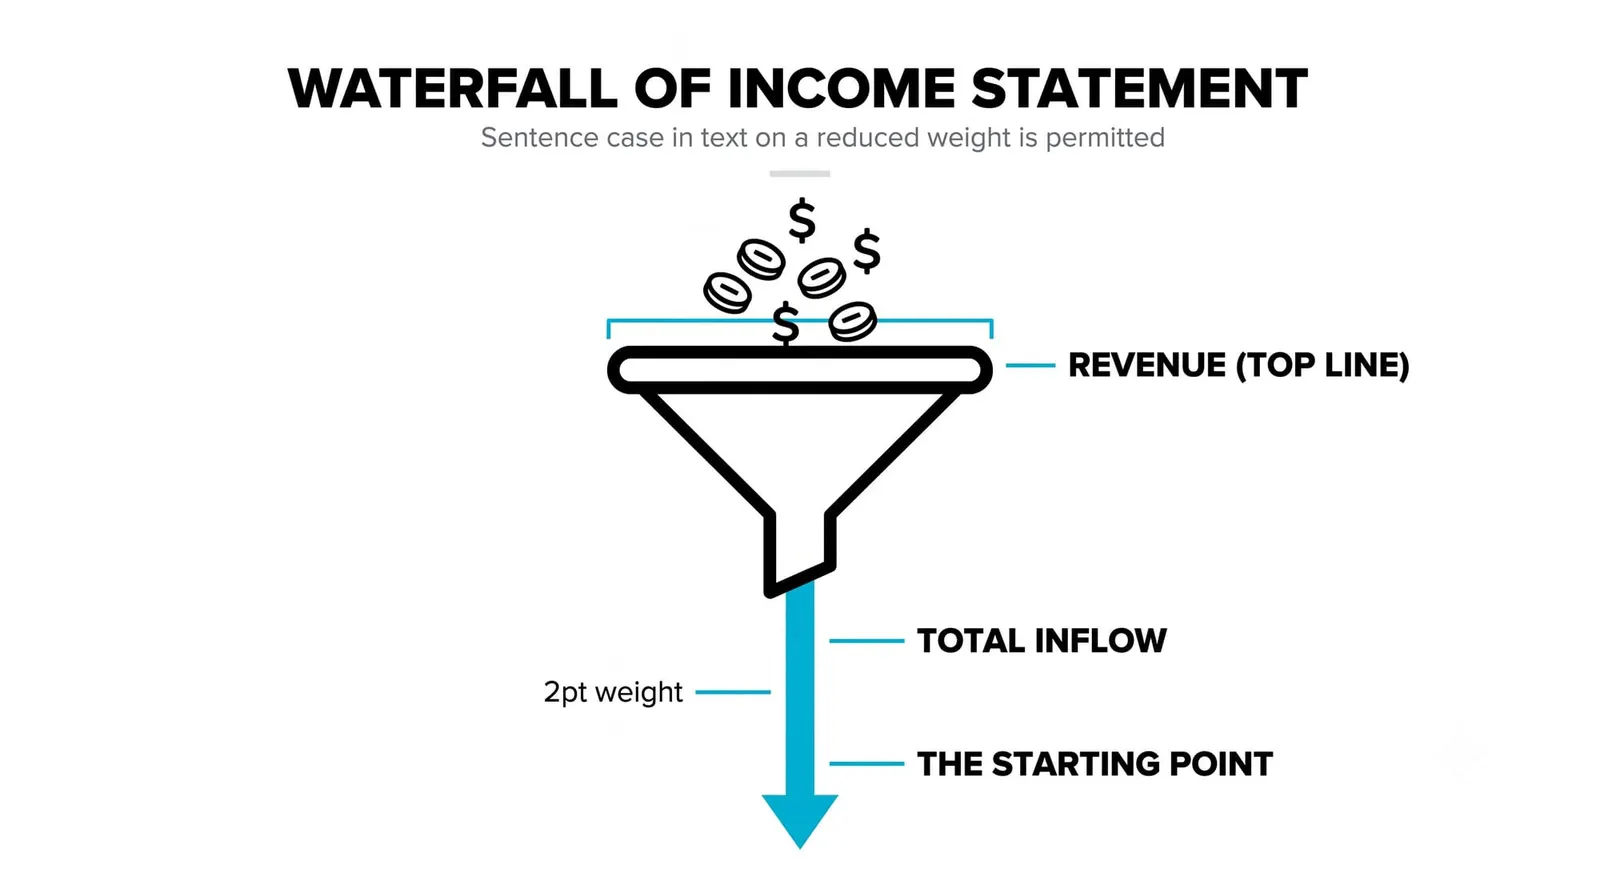
Think of it as a waterfall of subtractions: revenue pours in at the top, and each level lets a different category of cost escape before profit pools at the bottom. You met the three core documents in the previous lesson; this one goes deep on the first of them, and the balance sheet gets its own lesson next.
The Shape of an Income Statement
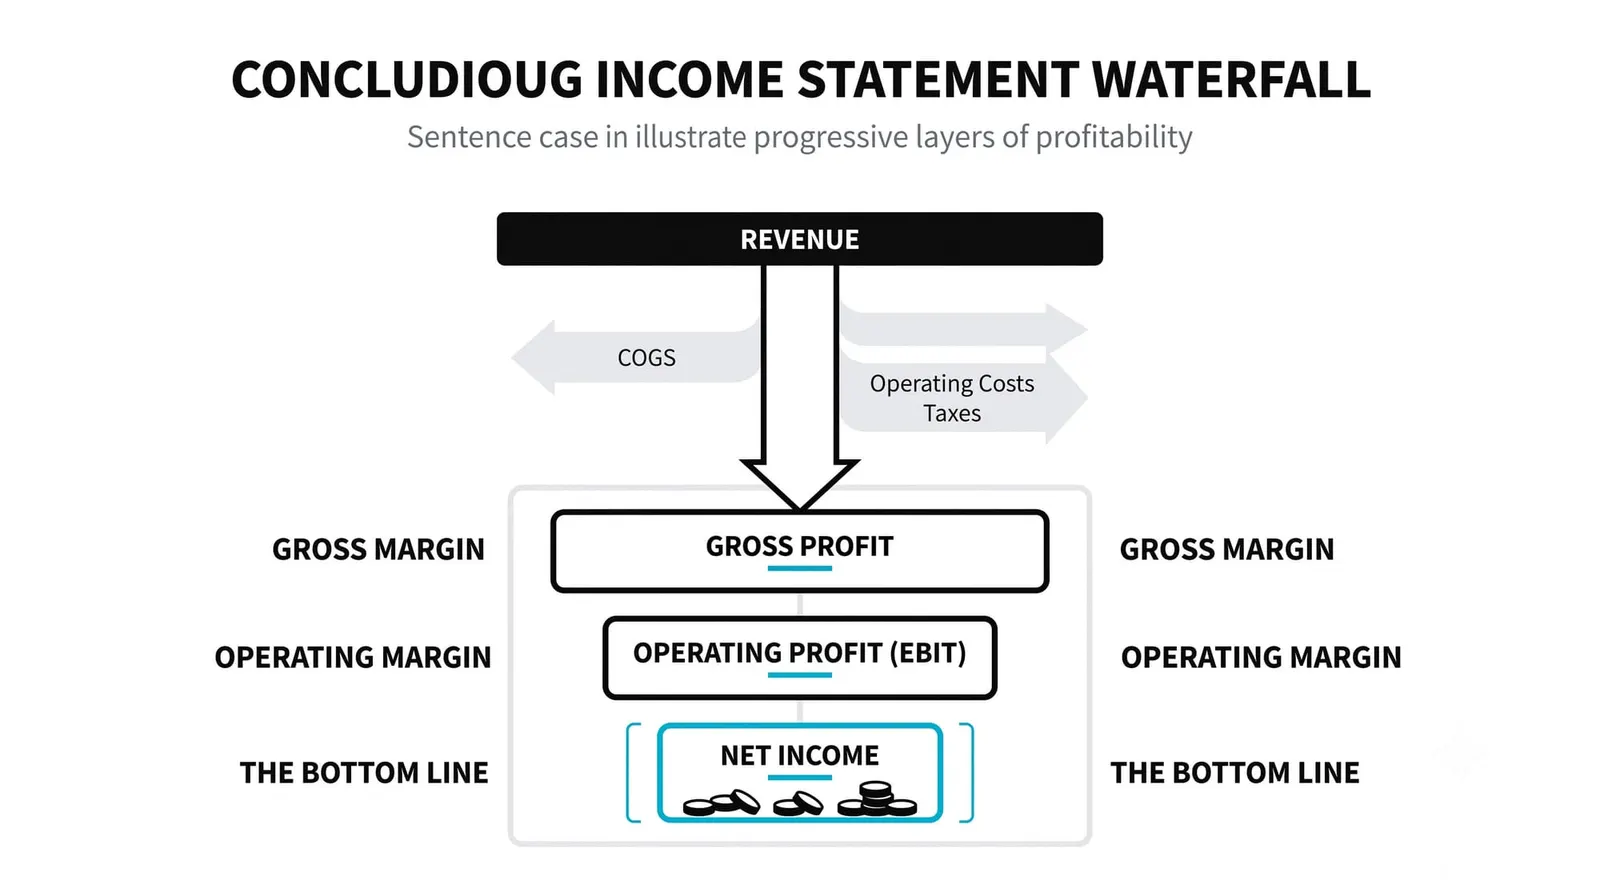
Every income statement follows the same skeleton. Revenue sits at the top. Cost of goods sold comes off first, leaving gross profit. Operating expenses come off next, leaving operating profit. Then interest and taxes come off, leaving net profit at the bottom.
Each line answers a different question. Gross profit asks whether the product itself earns money before any overhead. Operating profit asks whether the whole business runs profitably. Net profit asks what survives after lenders and tax authorities take their share.
The layout is standardized enough that you can compare companies across industries and across years. Two firms in the same sector will label lines slightly differently, but the order of subtractions stays the same. That consistency is what makes the document useful to an outsider.
Learn the skeleton once and every income statement you ever open will feel familiar within seconds.
Revenue: The Top Line and Its Fine Print
Revenue is the value of goods and services the company delivered during the period. It is recognized when the company has done its part of the deal, which is not always when the invoice is sent or when money arrives.
A company that ships product in December and gets paid in February books the revenue in December. That gap between earning and collecting is normal, and it means revenue is an accounting measure, not a cash count. The cash flow statement handles the cash side; keep the two separate in your head.
Watch for how a company defines its top line. Some report gross billings, others report net of returns and discounts. A footnote on revenue recognition policy is dull reading, but it tells you exactly what the biggest number on the page actually represents.
The Cost Layers: Gross, Operating, Net
Each subtraction reveals a different kind of strength. Gross margin, gross profit as a percentage of revenue, reflects pricing power and production cost. A company that keeps 60 percent of every revenue unit after making its product has room that a company keeping 20 percent does not.
Operating margin measures running efficiency. It strips in salaries, rent, marketing, research, and everything else required to keep the doors open. A firm can have a wonderful product and still bleed here if its overhead is bloated.
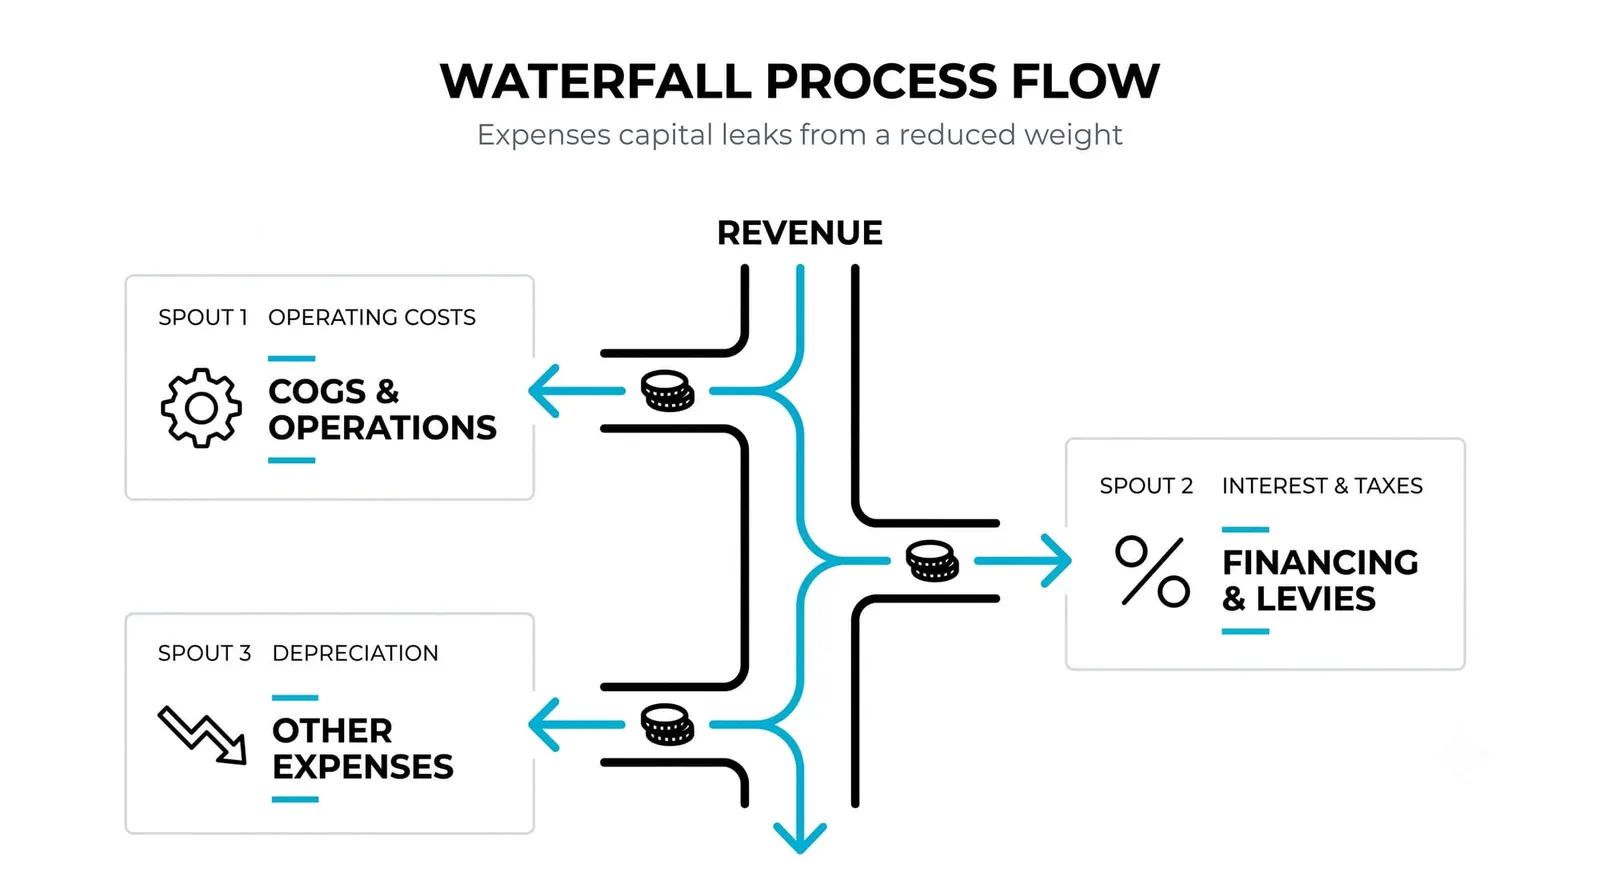
Net margin is what survives everything: production, overhead, interest on debt, and tax. It is the bottom line, and it is the number that EPS divides across the share count, as you saw in the valuation cluster earlier this level.
Then there are one-off items. A legal settlement, a restructuring charge, a gain from selling a building. These hit a single period and tell you little about the recurring business. A careful reader separates them from recurring costs and asks what the company earns in a normal year. Management often highlights adjusted figures that exclude these items; that can be legitimate, but always check what was excluded and whether "one-off" charges show up every single year.
Reading the Income Statement Like a Practitioner
Start with the trend, not the quarter. A single period is a snapshot; five or eight periods in a row show direction. Revenue growing steadily while margins hold is a very different picture from revenue growing while margins shrink.
Next, compare each line's growth against revenue's growth. If revenue rises 10 percent but operating expenses rise 18 percent, something inside the business is getting more expensive to run. That divergence often matters more than the headline profit number.
Beware the bottom line in isolation. Net profit can be inflated by a one-time gain, trimmed by a tax credit, or distorted by falling interest costs that have nothing to do with operations. Traders who react to the final number alone are reacting to the least informative line on the page.
The professionals work downward from the top, asking at each level whether the subtraction behaved the way the business model says it should.
From Revenue to Net Profit
Here is a fully hypothetical company with round numbers, built only to show the mechanics. Imagine a firm that reports revenue of 1,000,000 for the year.
- Cost of goods sold of 400,000 comes off first. Gross profit is 600,000, a gross margin of 60 percent.
- Operating expenses of 350,000 come off next. Operating profit is 250,000, an operating margin of 25 percent.
- Interest of 30,000 and tax of 55,000 come off last. Net profit is 165,000, a net margin of 16.5 percent.
Now suppose next quarter net profit falls. Where do you look first? You walk the waterfall in order. If gross margin dropped from 60 percent to 50 percent, the problem is product cost or pricing. If gross margin held but operating margin compressed, overhead grew. If both held but net profit fell, the cause sits below the operating line: more interest, more tax, or a one-off charge. The structure tells you where the leak is before you read a single word of commentary.
| Line | What It Is | What It Tells You |
|---|---|---|
| Revenue | Value of goods and services delivered in the period | Whether demand for the product is growing |
| Gross Profit | Revenue minus cost of goods sold | Pricing power and production efficiency |
| Operating Profit | Gross profit minus operating expenses | How efficiently the whole business runs |
| Net Profit | What remains after interest and tax | What shareholders actually keep, and the input to EPS |
The Income Statement, Answered
What is the difference between revenue and profit?
Revenue is the total value of what the company sold during the period; profit is what remains after costs are subtracted from it. A company can have enormous revenue and zero profit if its costs are equally enormous.
What are one-off items on an income statement?
One-off items are gains or charges that belong to a single event rather than to normal operations, such as a legal settlement, a restructuring cost, or the sale of an asset. Separate them mentally from recurring costs so you can judge what the business earns in a typical period.
Why is it called the profit and loss statement?
Because the same document shows both outcomes: if revenue exceeds all costs, the bottom line is a profit; if costs exceed revenue, it is a loss. "Profit and loss statement," "P&L," and "income statement" are three names for one document.
Which profit line matters most?
Operating profit is the cleanest read on the underlying business, because it excludes financing choices, tax quirks, and one-off items. Net profit matters for valuation since it feeds EPS, but operating profit tells you whether the engine itself is healthy.
Next, the balance sheet: the document that freezes one moment in time and shows what a company owns against what it owes.