Chart Patterns
Chart patterns are recurring shapes a price chart forms, like triangles, flags, and double tops, and they matter because crowds under pressure tend to behave in similar ways at similar spots. If you can read support and resistance, you already have most of the raw material. Patterns are just those same ideas arranged into shapes that show up again and again.

Think of patterns as the chart's accents: the same melody of hope, doubt, and surrender showing up in different markets. Learn to hear the melody, and the accent stops mattering so much.
Where Patterns Come From
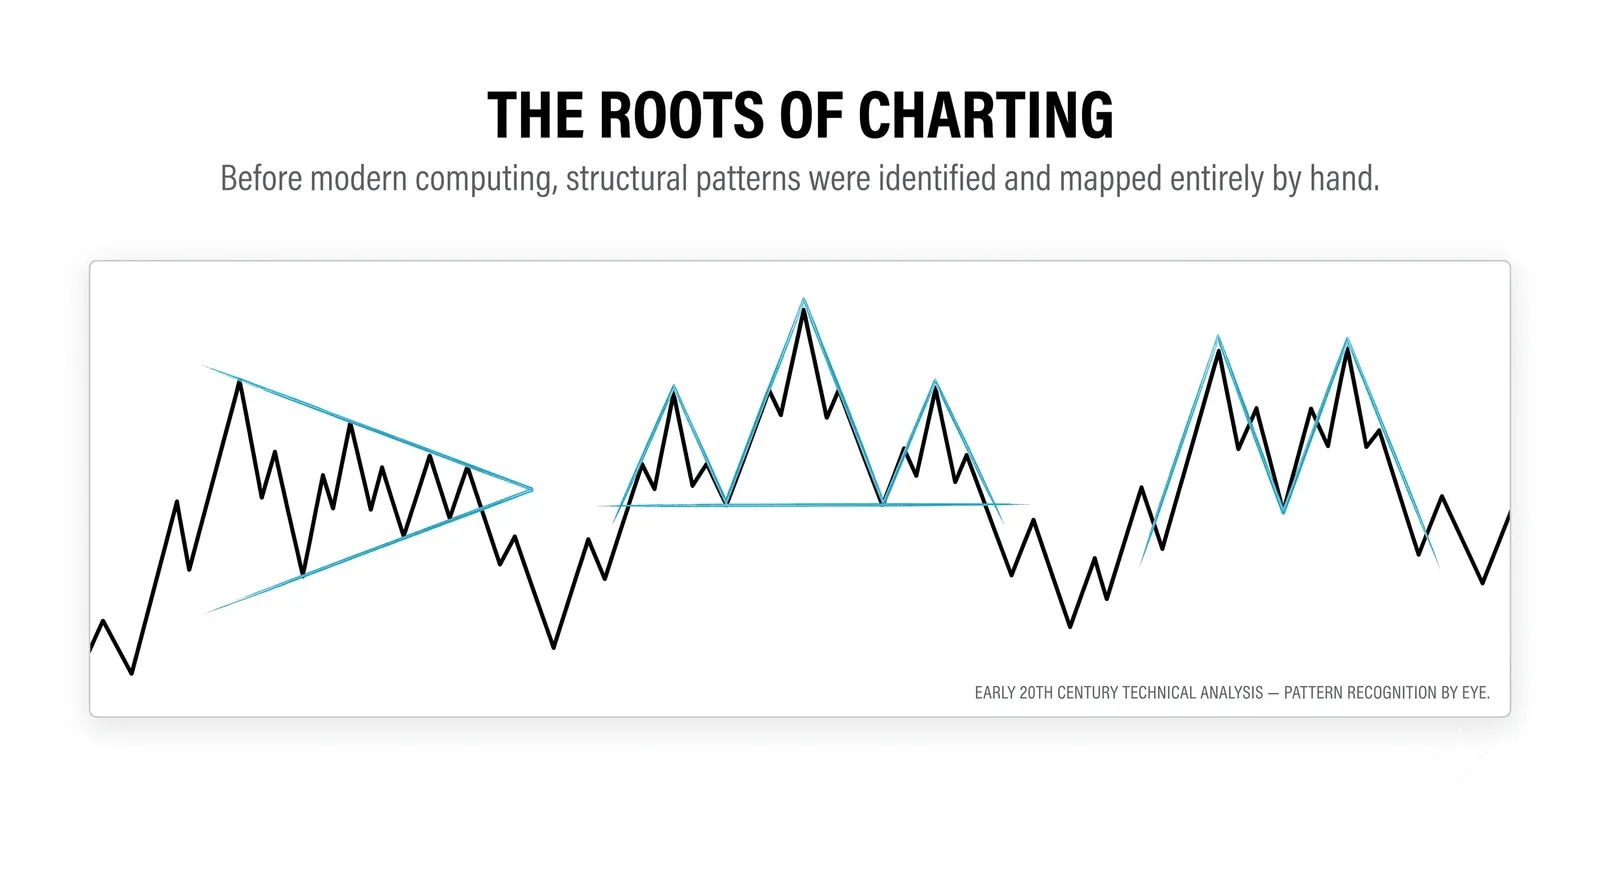
Nobody invented chart patterns the way someone invented the moving average. Traders watched charts for decades, noticed the same shapes appearing before similar moves, and gave them names. A double top is just a label someone attached to a behavior that kept repeating.
This origin matters. A pattern is a description, not a law. There is no rule of physics forcing price to fall after two touches of the same high. The shape is a summary of what happened, not a promise of what comes next.
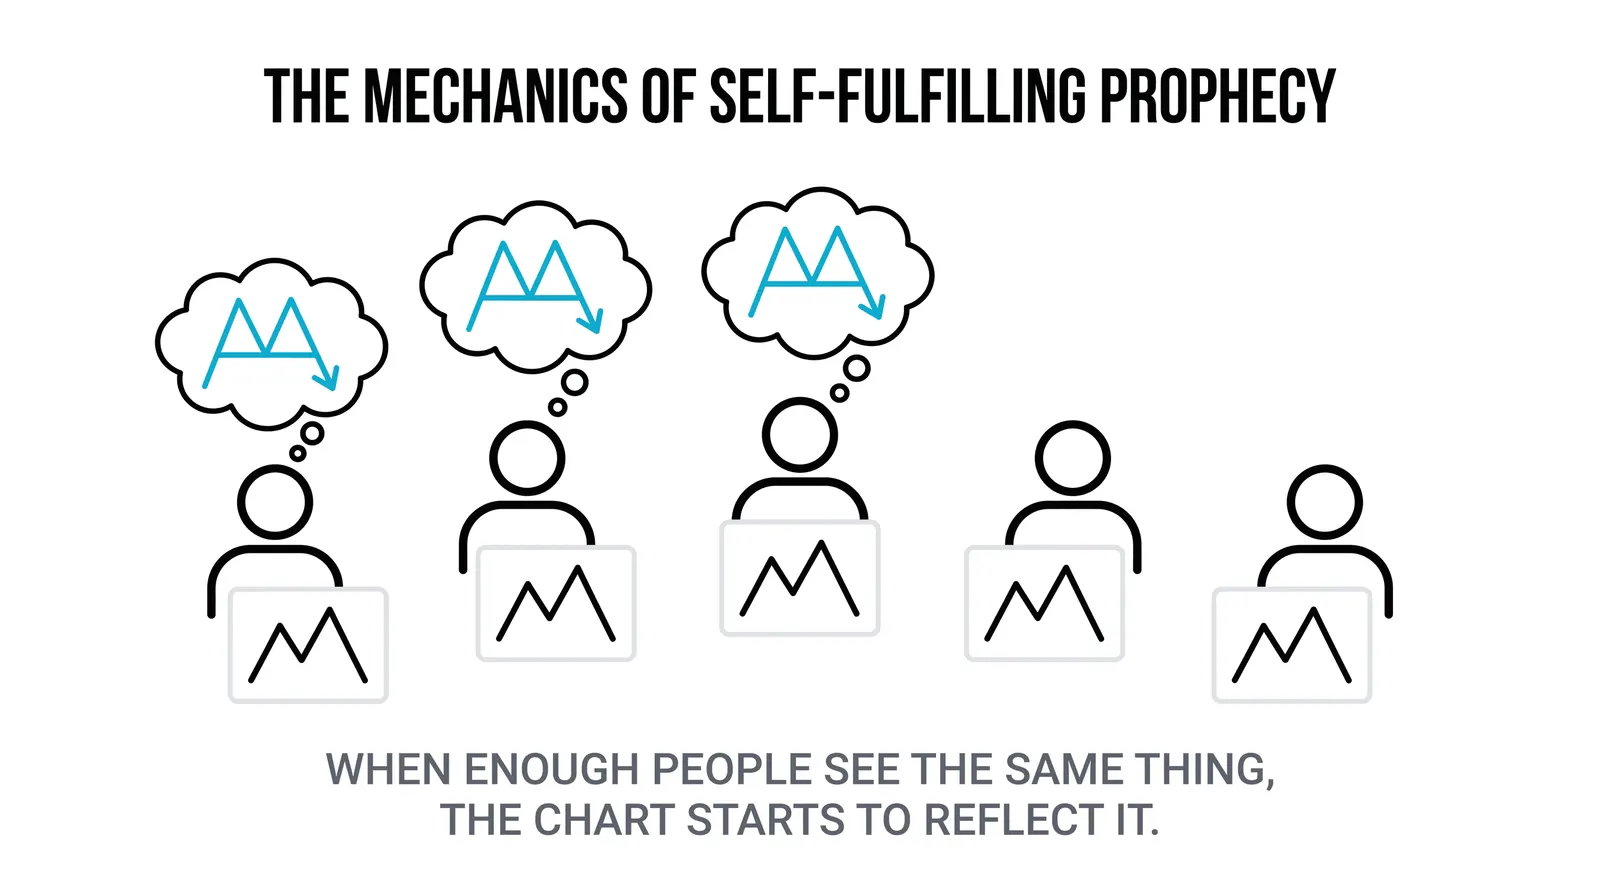
Here is the twist, though. Enough traders now watch these shapes that the watching itself influences behavior. When thousands of people see the same neckline at the same price, their orders cluster there. The pattern becomes partly self-fulfilling, which is the closest thing to magic this field has.
The Two Big Families
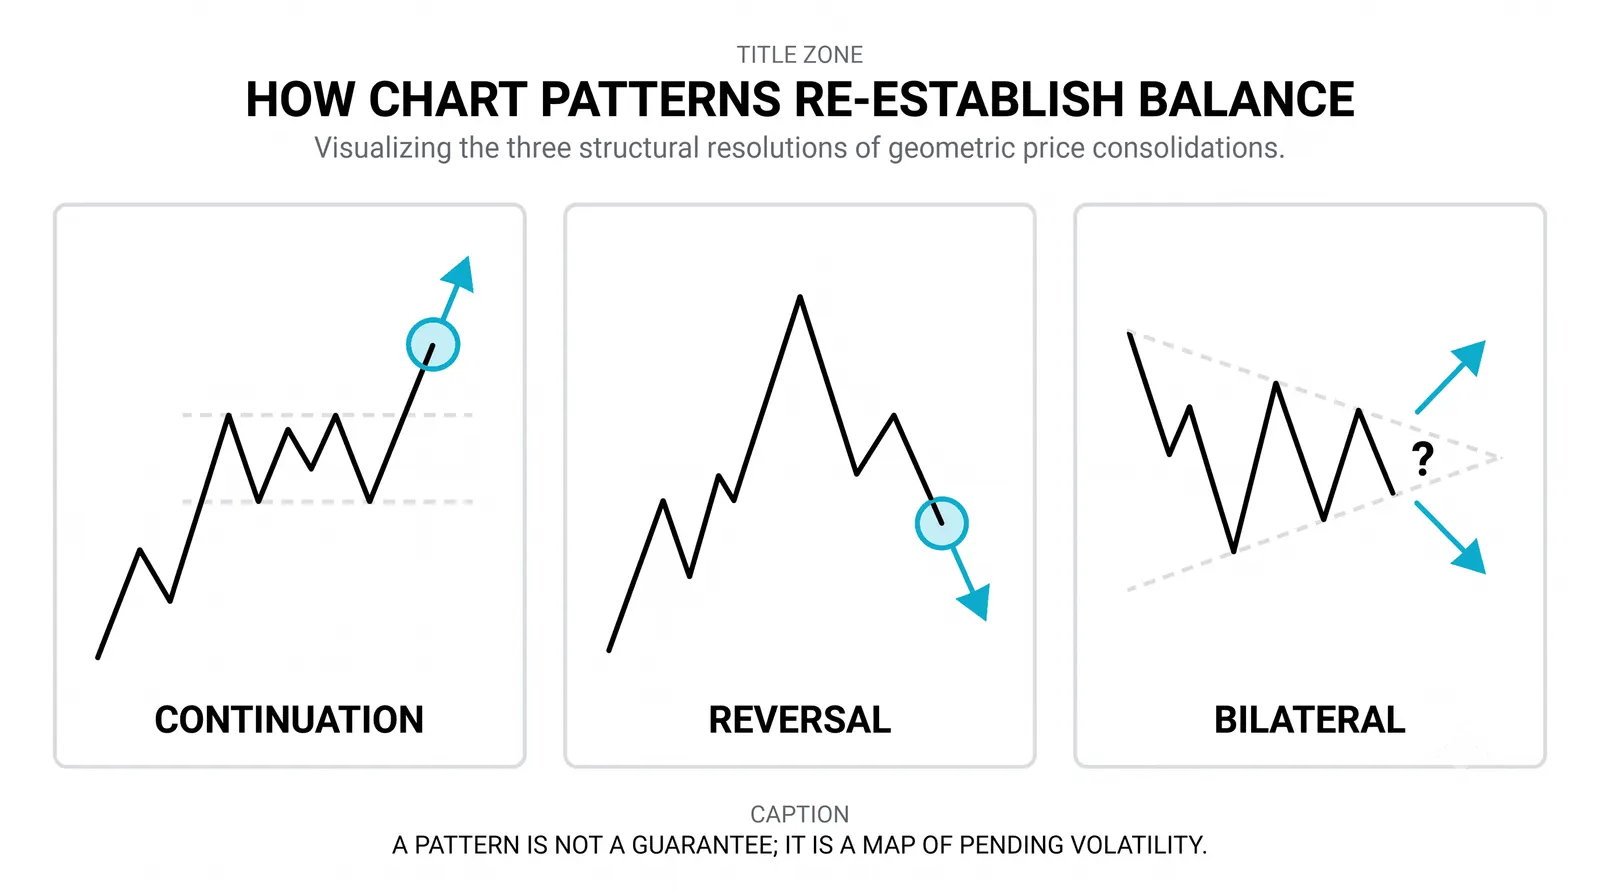
Every classic pattern belongs to one of two families. Reversal patterns hint that the current move is exhausting itself. Continuation patterns hint that the market is pausing before the old direction resumes.
The reversal family includes head and shoulders, double tops and bottoms, and some wedge forms. These show a market pushing in one direction, failing to push further, and rolling over. The continuation family includes flags, pennants, and most triangles. These show a strong move, a tight pause, and then a resumption.
You do not need to memorize each one right now. You need the family logic. Ask one question of any shape: is this market running out of energy, or catching its breath? That question sorts almost every pattern you will ever meet.
Why They Ever Work at All
Patterns work, when they work, because they are built from shared reference points. A double top is two tests of the same resistance. A triangle is support and resistance converging. The shapes are stories told in the language of levels you already know.
The typical story has three acts. First, buildup: price compresses or stalls as buyers and sellers fight to a standstill. Second, breakout: one side wins and price leaves the zone. Third, sometimes, a return test: price revisits the breakout level to see if the losers have truly given up.
That third act is where patient traders get paid. The breakout tells you the story changed. The retest tells you the change is sticking. A pattern without that structure is just a doodle.
A Worked Example With Round Numbers
Imagine a hypothetical stock that rallies from 40 to 60 over several weeks. At 60, sellers appear and price dips to 55. Buyers try again, price climbs back to 60, and sellers appear again. Two tops at the same level, with a dip between them: a double top.
Right now, nothing is decided. The stock could break above 60 and never look back. The pattern only becomes a signal when price breaks under 55, the low between the two tops. That break turns the story from pause to reversal, because the buyers who defended 55 have been overrun.
Now suppose price breaks to 52, then rallies back to 55 and stalls there. That failed retest is confirmation. The old floor has become a ceiling. A trader using the pattern might enter short near 55 on the retest, with a stop above 60 and a first target near 50, the height of the pattern projected downward. Notice what made this tradable: not the name "double top," but the level at 55 and the market's response to it.
What the Evidence Actually Says
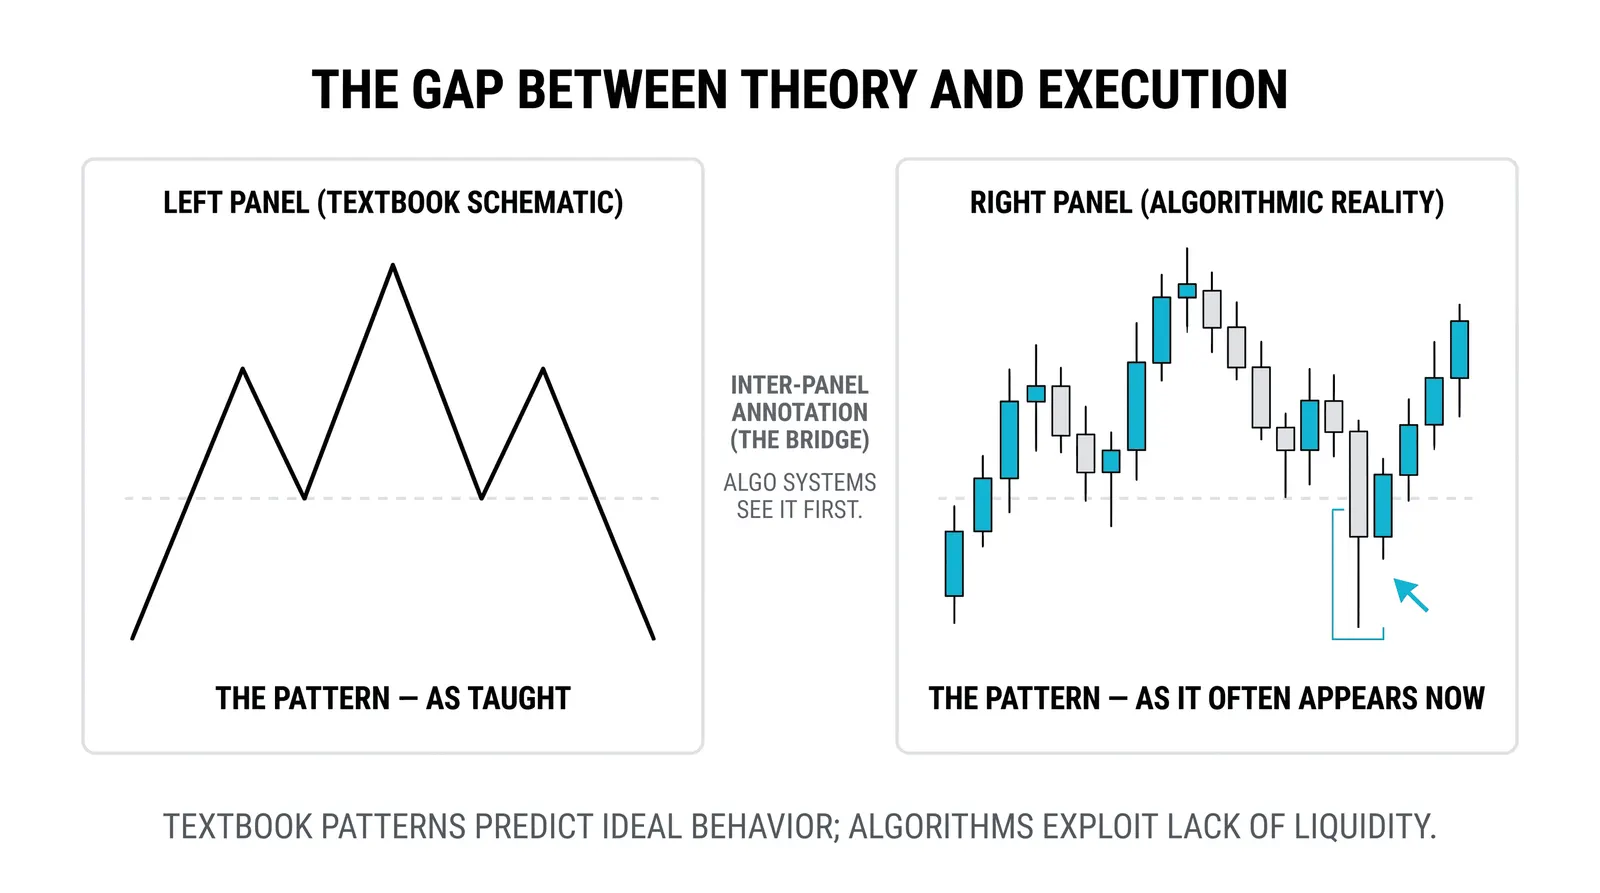
Patterns are real, but their edge is modest. Studies of classic formations find they resolve in the expected direction more often than chance, yet they fail often enough to hurt anyone who bets big on every shape. Treat any single pattern as a slight tilt, not a verdict.
Context improves the odds. Patterns that form at major support or resistance, after extended moves, and with volume expanding on the breakout tend to perform better than the same shapes floating in the middle of nowhere. A head and shoulders at a random spot on the chart is mostly noise.
Here is the blunt truth: a pattern without a plan is a coin flip with better branding. The traders who lose with patterns usually lose the same way. They see the shape, skip the confirmation, size too big, and have no exit when the shape fails.
Holding Patterns Loosely
Use patterns to structure a decision, never to replace one. The shape gives you three useful things: a level that defines the idea, a point where the idea is proven wrong, and a rough sense of how far the move might travel. That is a framework for risk, and it is the real gift.
The name of the pattern matters least of all. Two traders can look at the same chart, one calling it a wedge and the other a triangle, and both can trade it well if they agree on the level and the response. Arguing about labels is how beginners avoid the harder work of managing risk.
- Mark the level first, name the pattern second.
- Wait for the break, and respect the retest.
- Define where you are wrong before you enter.
- Check volume and location before trusting the shape.
Start with one or two patterns on one market and one timeframe. Watch them form, fail, and succeed for a few months before you trade them. Familiarity with failure is what separates a pattern trader from a pattern collector.
Reversal vs Continuation at a Glance
| Reversal Patterns | Continuation Patterns | |
|---|---|---|
| What it hints | The current move is exhausting | A pause before the old direction resumes |
| Classic examples | Head and shoulders, double top and bottom | Flags, pennants, most triangles |
| What confirms it | Break of the neckline or middle low, ideally with a failed retest | Breakout in the prior direction, ideally on rising volume |
| What breaks it | Price reclaiming the pattern's extreme | Price breaking out against the prior trend |
Questions About Chart Patterns
Do chart patterns really work?
Yes, but modestly. They tilt the odds rather than guarantee outcomes, and they perform best when combined with volume, location on the chart, and a clear exit plan. Traded blindly, they are little better than guessing.
How many patterns should a beginner learn?
Two or three is plenty to start. One reversal pattern and one continuation pattern, studied deeply on real charts, will teach you more than a shallow tour of twenty shapes. Depth beats coverage here.
Do patterns work on all timeframes?
Yes, the same shapes appear on five-minute charts and weekly charts, because crowd behavior repeats at every scale. Higher timeframes tend to produce more reliable signals simply because each bar represents more decisions and more money.
What turns a pattern into a trade?
A level, a trigger, and an exit. You need the price that confirms the pattern, the price that proves you wrong, and a target that makes the risk worthwhile. Without all three, you have an observation, not a trade.
Once these shapes feel familiar, the natural next step is learning how volume behaves around breakouts and retests. That is where patterns stop being pictures and start being evidence.