Stochastic %K and %D Lines, Explained
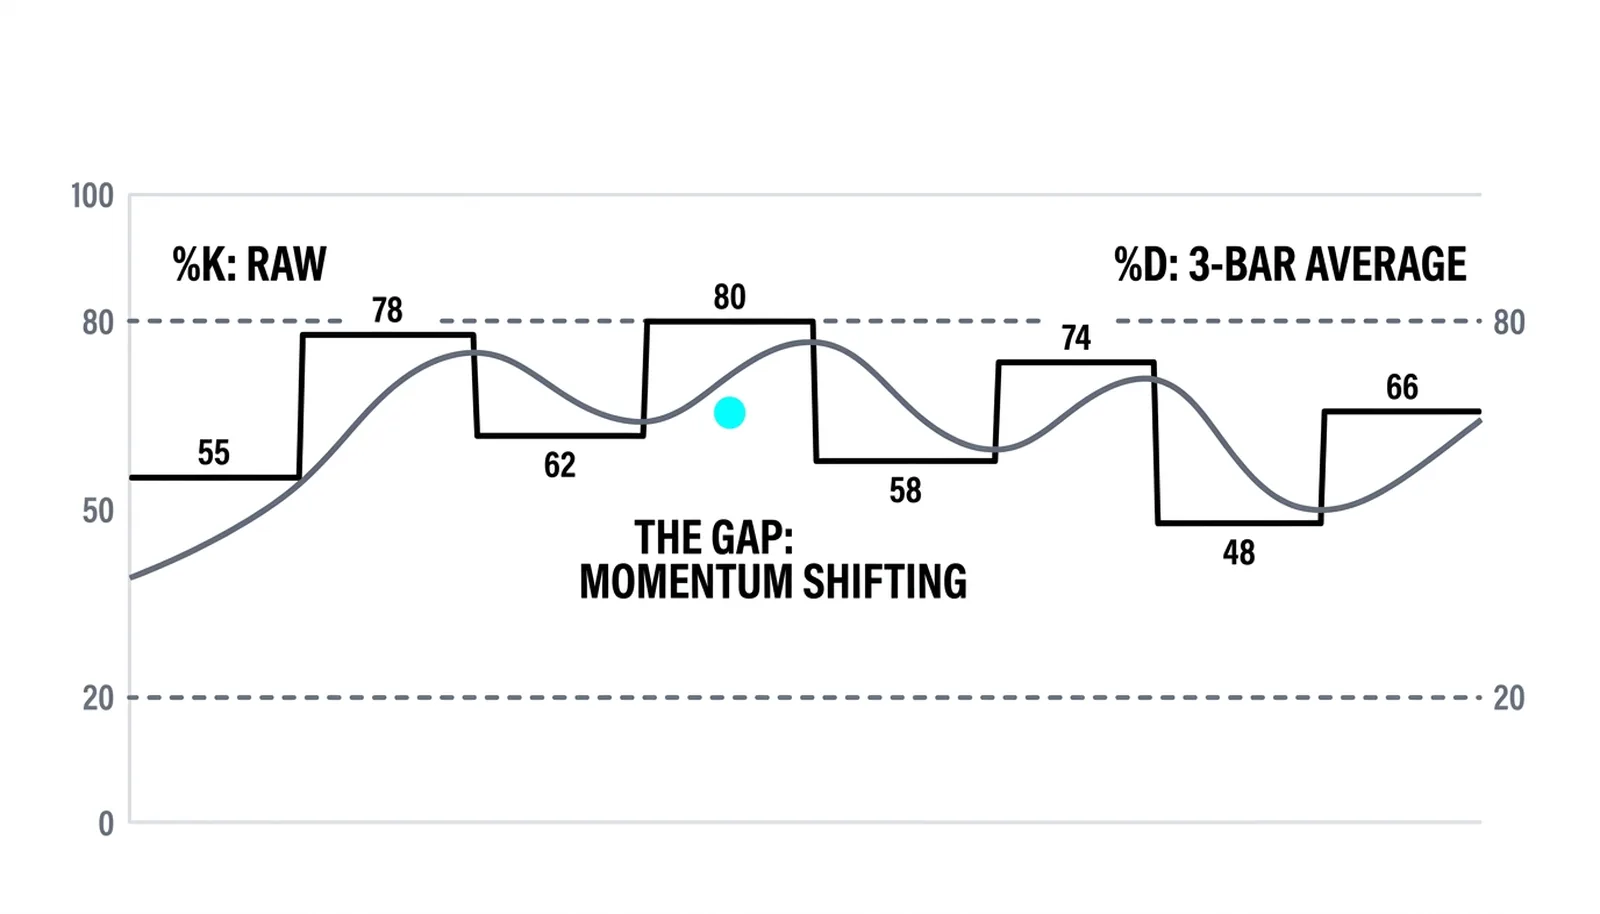
The Stochastic oscillator produces two lines, and the difference between them is the point of the tool. %K is the raw reading: it plots where the latest close sits inside the recent high-low range, updated every bar. %D is a three-period simple moving average of %K, so it trails behind and smooths out the jumps. One line reacts, the other confirms, and the crossovers between them are the stochastic's timing mechanism.

Think of %K as a thermometer reading taken every hour and %D as the three-day trend of those readings. The single reading jumps around; the trend tells you whether the situation is building or easing. The intro lesson in this batch already covered the formula and the 80/20 zones, so this lesson stays on the relationship between the two lines.
%D: The Three-Bar Average of %K
%D is nothing more exotic than the average of the last three %K values. If %K printed 70, 74, and 78 over the last three bars, %D sits at 74. Every new bar drops the oldest %K reading and pulls the newest one in.
Raw %K is twitchy. A single strong close can yank it from the middle of the range to the extreme in one bar, and a single weak close can drag it straight back. Trading every wiggle of that line means trading noise.
The three-bar average fixes most of that. A one-bar spike in %K moves %D by only a third as much, so %D traces the direction of the readings instead of chasing each one. False turns drop sharply.
The cost is lag, and it is real. By the time %D has clearly turned, %K has usually been turning for a bar or two, and price has often moved a little further. You trade a bit of promptness for a lot of reliability.
If this structure sounds familiar, it should. %D does for %K exactly what the signal line does for the MACD line: it converts a fast, jumpy series into a slower companion whose crossovers become tradeable events. The MACD lessons in this level walk through that pairing in detail, and everything said there about signal-line discipline applies here too.
The Crossover, and Its Context Problem
The classic stochastic signal is simple: %K crosses up through %D while both lines sit in the lower zone, below 20, and a buy-side turn is underway. The mirror image, %K crossing down through %D above 80, marks a sell-side turn. The fast line breaking away from the slow line tells you the most recent closes have shifted hard enough to drag the raw reading across its own average.
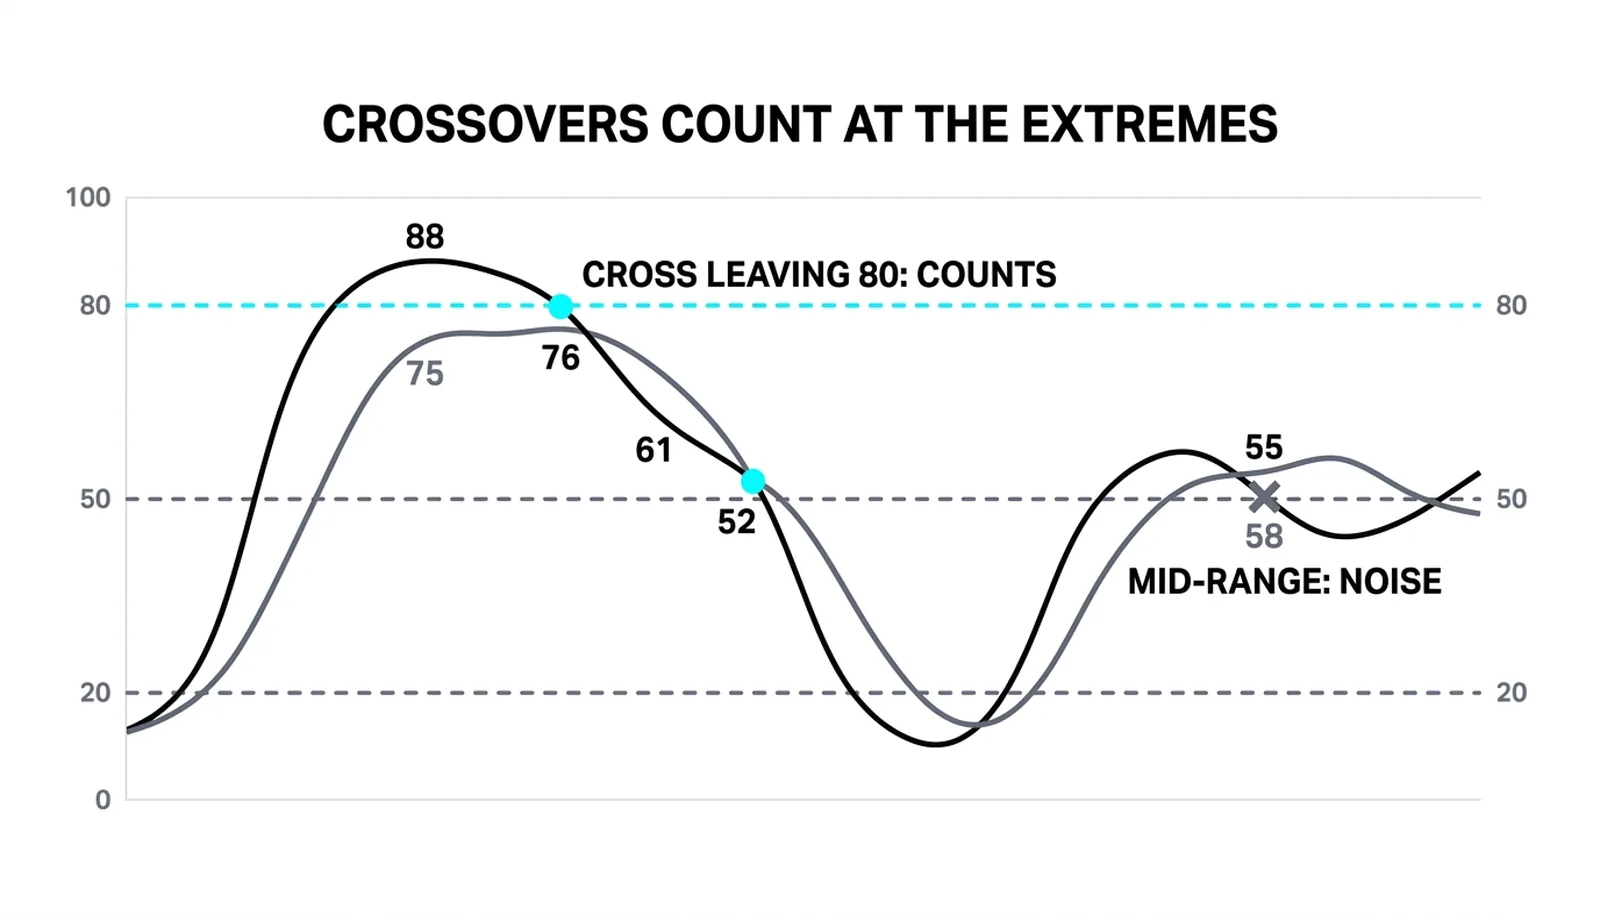
Here is the problem. %K and %D cross constantly. On a choppy chart they can cross a dozen times in a week, and most of those crosses happen in the middle of the range where they mean almost nothing.
A crossover at 50 says the close moved from the lower half of the recent range to the upper half, or the reverse. That happens all the time in sideways trade. It carries no information about exhaustion, because neither line is anywhere near an extreme.
So the working rule is blunt: crossovers count at the extremes. Below 20, an upward cross deserves attention. Above 80, a downward cross deserves attention. Between those zones, treat the cross as background static unless something else on the chart gives it weight.
Some traders add a second filter: they want both lines to actually exit the zone after the cross before acting. That waits for confirmation and sacrifices a little more of the move, but it strips out crosses that poke into the extreme and immediately fail.
Fast, Slow, and Full
Open the stochastic settings on most platforms and you will see two or three versions of the same indicator, and the naming trips up almost everyone the first time.
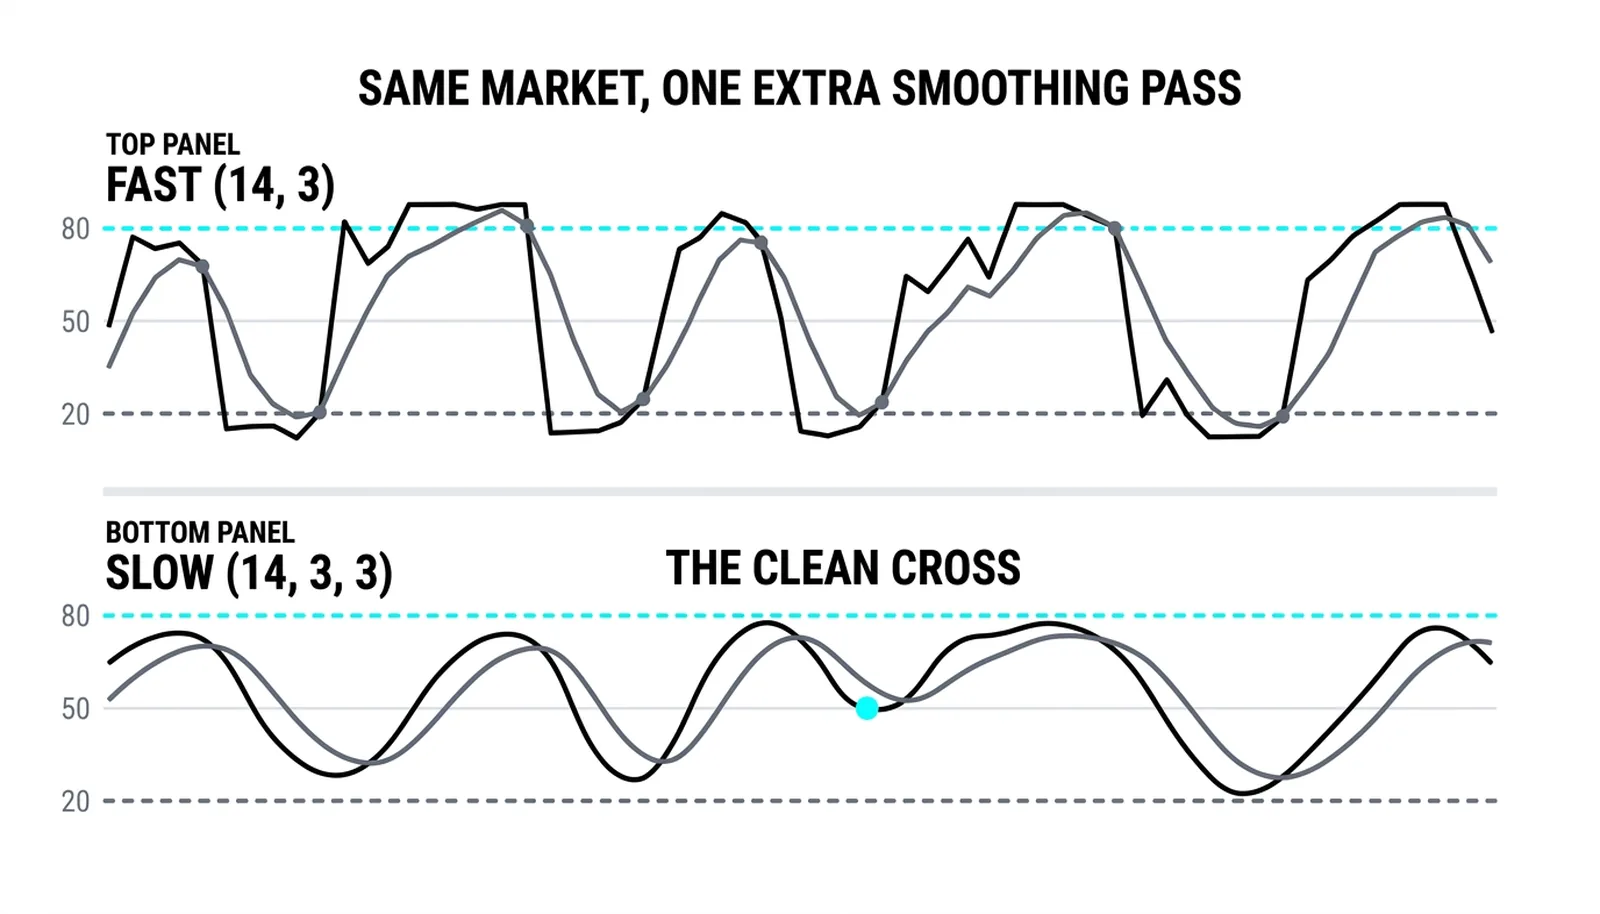
The fast stochastic is the original pair: raw %K, plus %D as its three-bar average. It reacts quickly and whipsaws often.
The slow stochastic adds one more round of smoothing. The fast %D becomes the slow %K, and a new three-bar average of that becomes the slow %D. Every line you see has now been averaged at least once, so the pair moves more deliberately and crosses less often.
The full stochastic simply exposes both smoothing parameters so you can set them yourself, usually written as three numbers: the lookback period, the %K smoothing, and the %D period.
- Fast (14, 3): raw %K over 14 periods, %D as its 3-bar average. Most responsive, most false signals.
- Slow (14, 3, 3): the extra smoothing pass. Fewer, cleaner crosses. This is the default on most charting platforms.
- Full (custom): the same machinery with adjustable smoothing, for traders who want something between or beyond the two presets.
Most traders should start on the slow version and only reach for the fast one if they have a specific reason to want earlier, noisier signals.
What the Pair Still Cannot Do
Both lines are computed from the same input: where the close sits inside the recent range. %D is %K, averaged. A crossover is therefore one data series crossing its own smoothed echo, not two independent pieces of evidence agreeing.
That means a crossover confirms a turn in position, not a turn in trend. Price can print a beautiful %K-below-%D cross above 80, dip for two bars, and then rip to new highs because the larger trend never broke. The oscillator measured a pause and called it a reversal.
This is why the regime filter from the intro lesson still does the heavy lifting. In a strong uptrend, the crosses below 20 are the ones worth acting on, and the crosses above 80 are often just the market catching its breath. In a downtrend, flip that. Range-bound markets are the one place where both directions of extreme-zone crosses carry roughly equal weight.
The pair also says nothing about magnitude. A cross tells you the close shifted within the range; it does not tell you whether the resulting move will travel two percent or twenty. Targets and stops come from structure, not from the oscillator.
Three Days, One Crossover
A hypothetical illustration with round numbers. A stock trades near 103 after a steady rally, and the rally begins to stall. The slow stochastic's %K prints 88, then 76, then 61 across three sessions as each close lands lower inside its recent range.
%D trails behind, as it should. While %K falls from 88 to 61, %D sits near 75, still digesting the earlier strength. The gap between the two lines is the visual signature of momentum fading faster than the smoothed average can follow.
On the next session, %K prints 52 while %D stands at 68. %K has crossed below %D, and both lines are leaving the 80 zone. That is the textbook top-side timing signal: the raw reading has broken away from its average at an extreme, suggesting the rally's internal position has rolled over. A trader acting on it is not predicting a crash; they are acting on a shift in where closes land, confirmed by the smoothed line being left behind.
Now the counter-case. Same stock family, different week: %K at 55 crosses below %D at 58, with both lines hovering near 50. Structurally the cross looks identical, but it means little. Neither line is near an extreme, the close is sitting mid-range, and crosses in this territory reverse constantly. Acting on it is trading noise, and the next bar often crosses the lines right back.
| Item | What it is | When it matters |
|---|---|---|
| Fast stochastic (14, 3) | Raw %K with a 3-bar %D | When you want the earliest possible signal and accept frequent whipsaws |
| Slow stochastic (14, 3, 3) | %K smoothed once more, %D re-averaged | The default choice; cleaner crosses for most swing trading |
| %K crossing above %D below 20 | Buy-side timing signal at the lower extreme | Best in uptrends and ranges; weakest against a strong downtrend |
| %K crossing below %D above 80 | Sell-side timing signal at the upper extreme | Best in downtrends and ranges; often just a pause in strong uptrends |
%K and %D, Answered
What is the difference between %K and %D?
%K is the raw reading of where the latest close sits inside the recent high-low range, and %D is a three-period simple average of %K. %K reacts first, %D confirms, and the space between them shows how fast the reading is shifting.
Should I use the fast or slow stochastic?
Start with the slow version, the 14, 3, 3 default on most platforms. Its extra smoothing removes a large share of false crosses. The fast version suits traders who deliberately want earlier signals and accept more whipsaws as the price of getting them.
What does a %K crossover of %D mean?
It means the raw reading has moved sharply enough to cross its own three-bar average, so recent closes are shifting position within the range. Whether that shift is tradeable depends entirely on where it happens: at the 80 or 20 extremes it is a timing signal, and mid-range it is mostly noise.
Why do stochastic crossovers fail mid-range?
Because mid-range crosses reflect ordinary fluctuation, not exhaustion. When both lines sit near 50, the close is simply oscillating around the middle of its range, and small moves push %K back and forth across %D repeatedly. Without an extreme reading or a trend filter behind it, the cross carries no edge.
Once the two lines and their crossovers are second nature, the next lesson in this batch takes the same machinery further: stochastic divergence, where the lines disagree with price itself and often give the earliest warning this indicator family can offer.