MACD Signal Line Crossovers
The signal line is a 9-period exponential moving average computed on the MACD line itself, and the crossovers between the two lines are MACD's built-in signal events. Nothing new enters the calculation. The signal line takes the MACD line's own recent values and smooths them a second time, producing a slower shadow that trails the faster original.

Think of a skier crossing their own earlier tracks on the way down a slope. The live MACD line is the fresh descent; the signal line is the smoothed record of where that descent has been. When the live line crosses its own smoothed copy, momentum has shifted enough to overtake its own recent average. That moment is the crossover, and it is the event most traders mean when they say "MACD gave a signal."
The previous two lessons built the pieces. First came the MACD line itself, the gap between a fast and a slow EMA. Then came the histogram, which plots the distance between the MACD line and the signal line. This lesson completes the toolkit by focusing on the signal line and the crossovers it creates.
What the Signal Line Actually Is
The signal line is a 9-period EMA of the MACD line's values. Each period, the MACD line prints a number. Collect the last nine of those numbers, apply the exponential weighting you already know from the moving average lessons, and you get one smoothed value. That value is the signal line for the current bar.
Every input still comes from EMAs. The MACD line is a fast EMA minus a slow EMA. The signal line is an EMA of that difference. Three layers of exponential smoothing, nothing else. There is no volume input, no volatility adjustment, no separate data feed.
Why smooth the line at all? Because a raw line needs a baseline before "fast" and "slow" mean anything. The MACD line on its own tells you momentum exists. The signal line gives you the recent norm of that momentum, so you can ask a sharper question: is momentum accelerating or fading relative to its own recent behavior? The smoothed copy is the yardstick the live line gets measured against.
Because it averages nine past values, the signal line always lags the MACD line. That lag is not a flaw. It is the entire mechanism. A fast line crossing a slow line is only meaningful because the slow line moves late.
What a Crossover Between the Two Marks
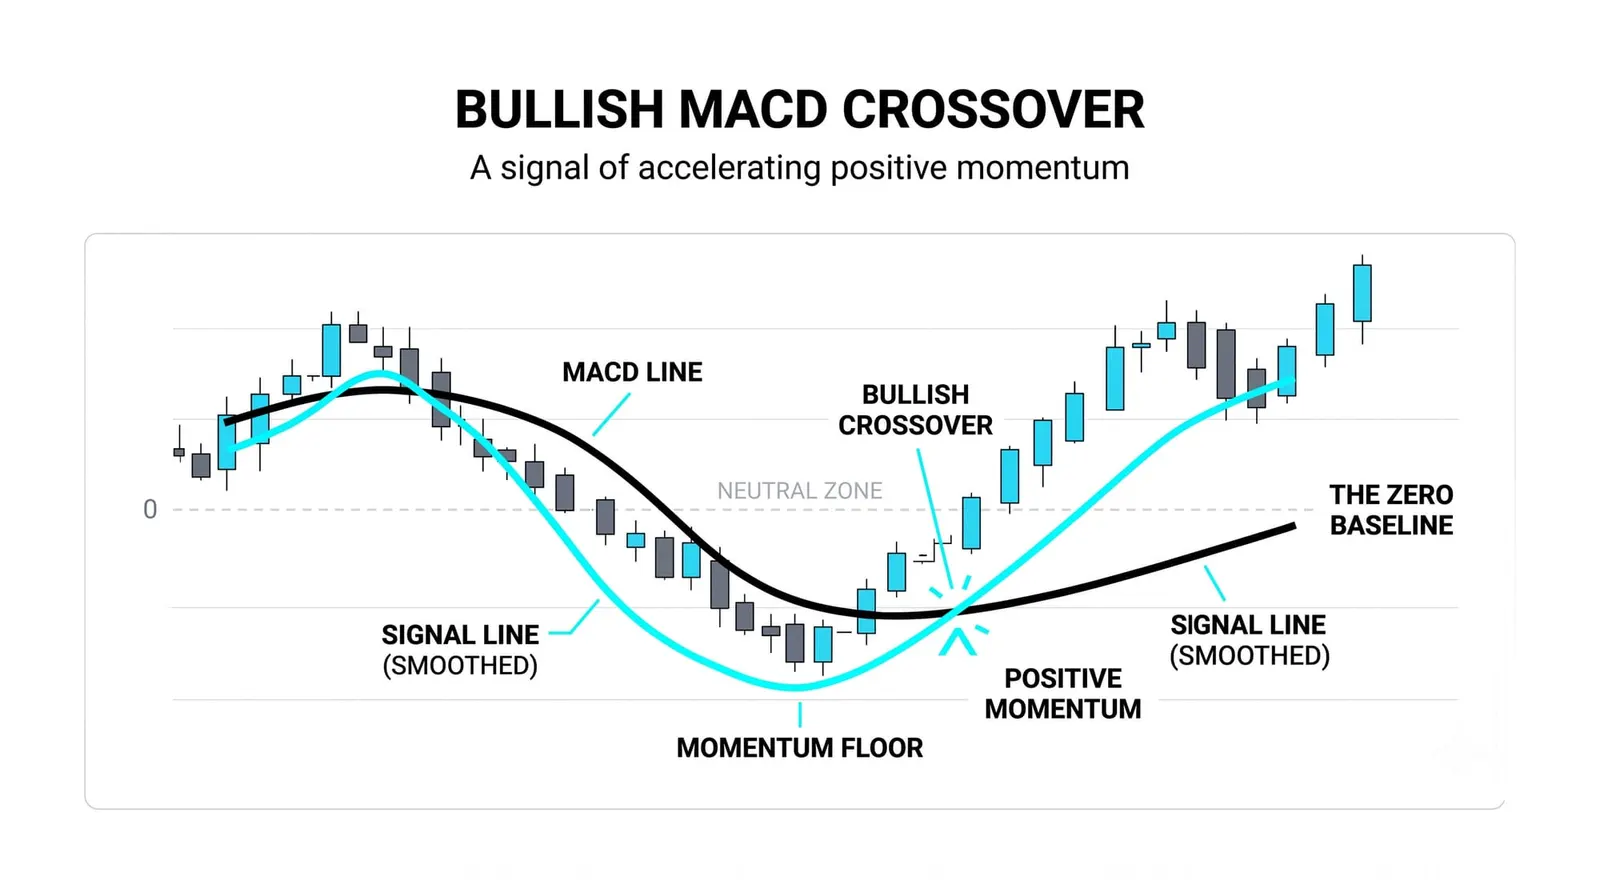
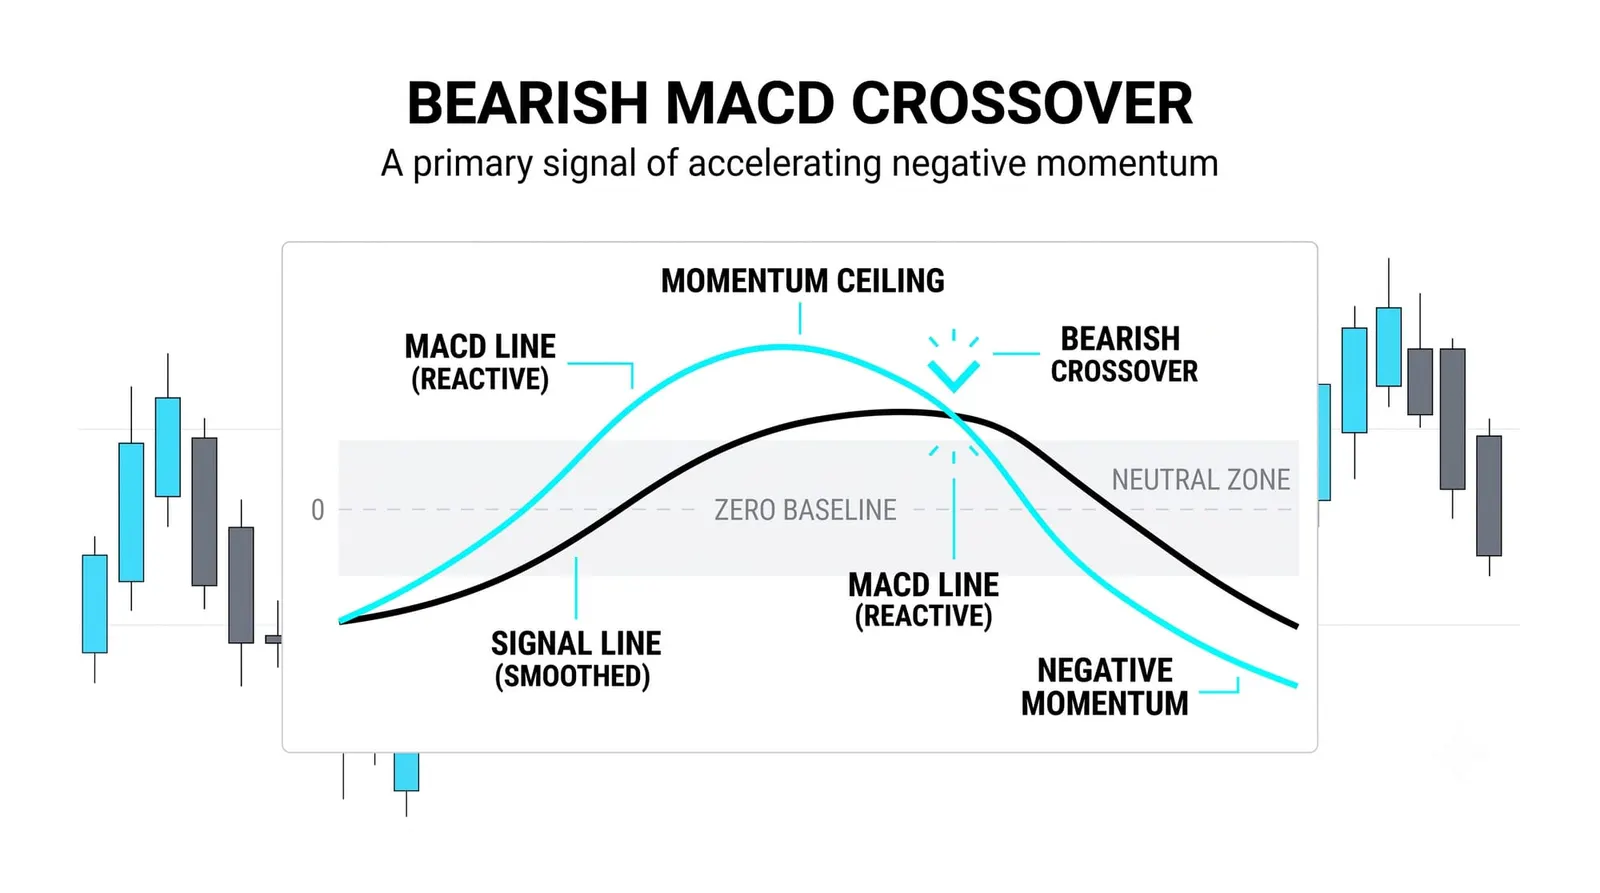
A crossover marks the moment momentum overtakes its own recent average. When the MACD line crosses above the signal line, momentum is accelerating relative to its recent norm. When it crosses below, momentum is fading relative to that same norm. The cross is the line catching up with, or falling behind, its own shadow.
A cross above does not require price to be rising at that second. It requires the 12-26 EMA gap to be widening faster than its nine-period average. Most of the time that coincides with price pushing up, but the event itself is about the relationship between two averages.
The cross is a confirmed event, and confirmation costs time. By the moment the two lines intersect, the histogram has usually been shrinking for several bars. The crossover is always late relative to the histogram because the cross is what the histogram was counting down toward. Traders who treat the cross as the earliest warning have the sequence backwards. It is the last event in a chain, not the first.
Why the Histogram Crosses First
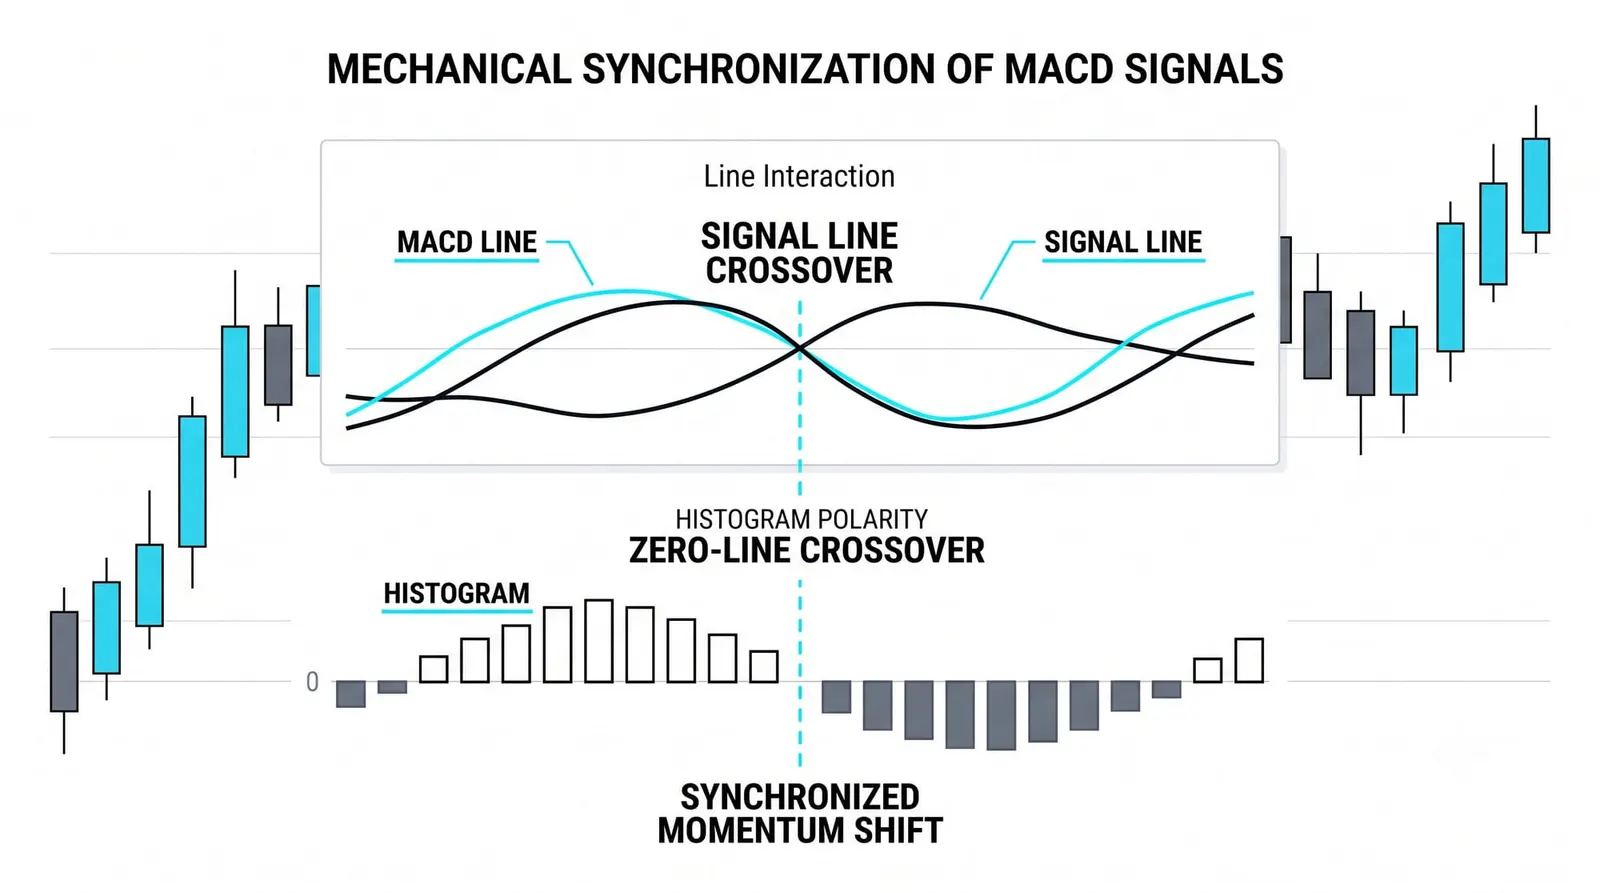
The histogram is exactly the gap between the MACD line and the signal line, plotted bar by bar. A crossover is the moment that gap passes through zero. So the histogram does not predict the cross in any mysterious way. It displays the arithmetic of the cross in progress.
Watch what happens in order. The MACD line bends toward the signal line. The gap narrows, so the histogram bars shrink. The bars keep shrinking as the lines converge. Then the gap hits zero and flips sign: the cross prints. Shrinking bars always precede the cross, because a difference must shrink before it can change sign.
This creates a real choice. The trader who waits for the cross buys confirmation. The event has happened, the lines have intersected, and the signal is unambiguous. The trader who acts on shrinking bars buys earliness and accepts more noise. Bars can shrink and then re-expand without any cross at all. Neither choice is wrong. They are different points on the same trade-off between speed and certainty.
False Crosses and Filters
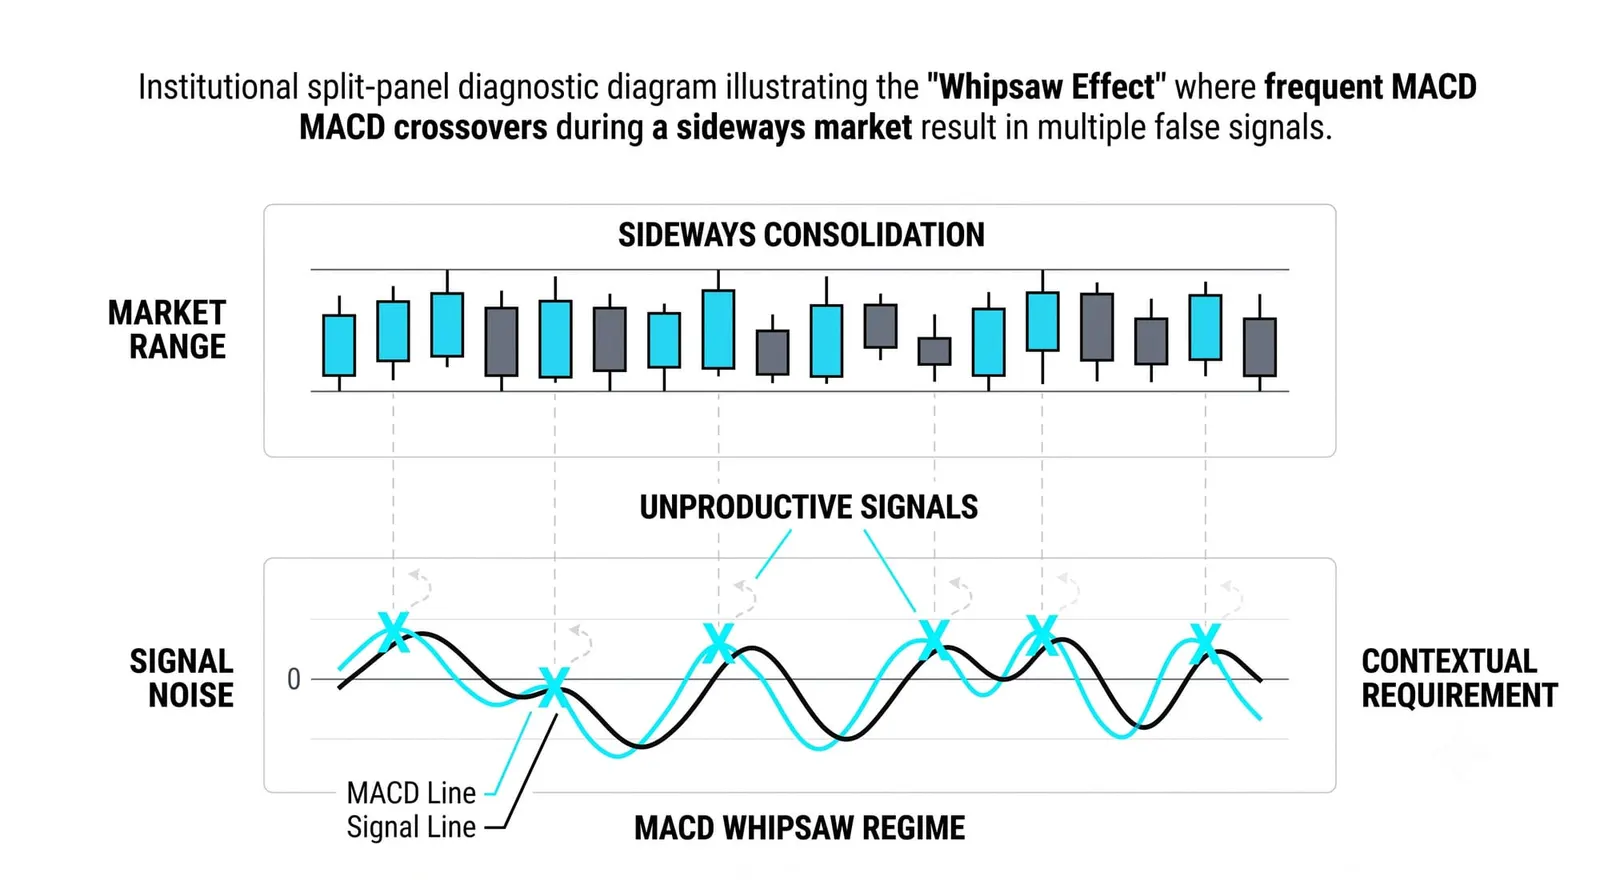
In a sideways range, the two lines braid together. Price chops around a flat mean, the EMA gap oscillates around zero, and the MACD line crosses the signal line repeatedly in both directions. Each cross is technically real and practically worthless. Ranges are where crossover signals go to die.
The first filter is the zero-line regime from the MACD lesson. A bullish cross above the zero line happens while both EMAs sit in positive territory, meaning the prevailing drift already points up. That cross confirms the regime. A bullish cross deep below the zero line is a countertrend event, a bounce attempt inside a downtrend, and it fails far more often. Same shape, different context, different reliability.
The second filter is price itself. Trend direction on the chart is the second vote. A bullish cross that arrives at a rising structure of higher lows, above a rising moving average, has two independent tools agreeing. A bullish cross that arrives under a falling structure, into overhead supply, has the indicator voting against the chart. When the votes disagree, the chart usually wins.
Filters do not make crossovers reliable. They make them less frequent and less random. That is the honest ceiling of what filtering can do.
One Cross, Bar by Bar
Hypothetical numbers, invented for illustration. A stock climbs from 100 to 112 over several weeks, then stalls. On the day it stalls, the MACD line sits at 4.5 and the signal line trails at 3.8. The gap, and therefore the histogram, reads 0.7.
Bar one: the histogram prints 0.7. Momentum is still comfortably above its recent norm. Nothing to act on.
Bar two: the stock drifts sideways, and the histogram prints 0.5. The MACD line has started bending down toward the signal line. The gap is shrinking. This is the earliest information available: momentum is fading relative to its own average. No cross has happened. A trader acting here is acting on a shrinking bar, which can still reverse.
Bar three: the histogram prints 0.2. The lines are nearly touching. The shrink has continued for two consecutive bars, so the probability of a cross has risen, but the event still has not occurred.
Bar four: the MACD line dips below the signal line, and the histogram prints minus 0.1. The crossover is confirmed. Momentum has officially faded through its recent norm.
Now count the cost of confirmation. Between bar two's 0.5 reading and bar four's cross, the stock drifted from about 112 down toward 109.8, roughly two percent of movement. The trader who acted on the first shrink captured that drift. The trader who waited for the cross traded two percent of price for certainty that the event was real. Both paid something. One paid in noise, the other paid in price.
Reading the Four Crossover Types
| Cross type | Regime context | Usual read |
|---|---|---|
| Cross above, positive territory | Both lines above zero; uptrend regime | Trend-aligned signal; momentum re-accelerating within an existing rise |
| Cross above, negative territory | Both lines below zero; downtrend regime | Countertrend bounce attempt; weaker and more failure-prone |
| Cross below, positive territory | Both lines above zero; uptrend regime | Pullback warning inside a rise; often temporary |
| Cross below, negative territory | Both lines below zero; downtrend regime | Trend-aligned signal; downside momentum re-accelerating |
Notice the pattern in the table. The zero line splits every cross into two versions, and the version aligned with the regime carries more weight. The crossover tells you what momentum just did. The regime tells you how much to trust it.
Signal Line Crossovers, Answered
Is a signal line crossover a buy signal?
No, not by itself. A crossover is a statement about momentum relative to its own recent average, and nothing more. It becomes a usable input only when the regime filter, the price structure, and your own risk rules agree with it. Traders who buy every bullish cross in a range donate money to the chop.
Why does the signal line lag the MACD line?
Because it is an average of the MACD line's last nine values, and any average moves slower than the data it averages. The lag is deliberate. Without a slower line to cross, there is no crossover event at all.
Can the 9-period setting be changed?
Yes, the setting is a parameter like any other. A shorter period makes the signal line hug the MACD line, producing more crosses and more false ones. A longer period produces fewer, slower crosses. The 9-period default is the most widely watched, which is itself a reason many traders leave it alone.
Can crossovers be used without the histogram?
Yes, but you lose the early warning. The histogram is the gap between the two lines made visible, so watching only the lines means the first sign of a coming cross is the lines converging, which is harder to judge by eye. Most traders keep the histogram on precisely because it shows the cross approaching before it happens.
The signal line completes the MACD toolkit: the line, its shadow, the gap between them, and the crosses that gap produces. The next lesson steps back from MACD entirely and asks the bigger question: where indicators sit on the leading-versus-lagging spectrum, and what that means for every tool you will meet after this one.