Single-Candle Patterns: the Big Four
Single-candle patterns are one-candle shapes that summarize who won a session and how convincingly, and the four worth learning first are the doji, the hammer, the shooting star, and the spinning top. Each one compresses a full session of buying and selling into a single readable shape. You already know how to read a candle's body and wicks, so this lesson is about what those shapes argue.

A single candle works like a car's turn signal: it announces intent, and it does not guarantee the turn gets completed. Treat every pattern in this lesson that way. The candle proposes. The next few sessions dispose.
One more rule before the four patterns. Context decides everything. The same shape means something different at the bottom of a two-week decline than it does in the middle of a quiet range, and you will see that point repeated because it is the core skill.
The Doji: A Session That Went Nowhere
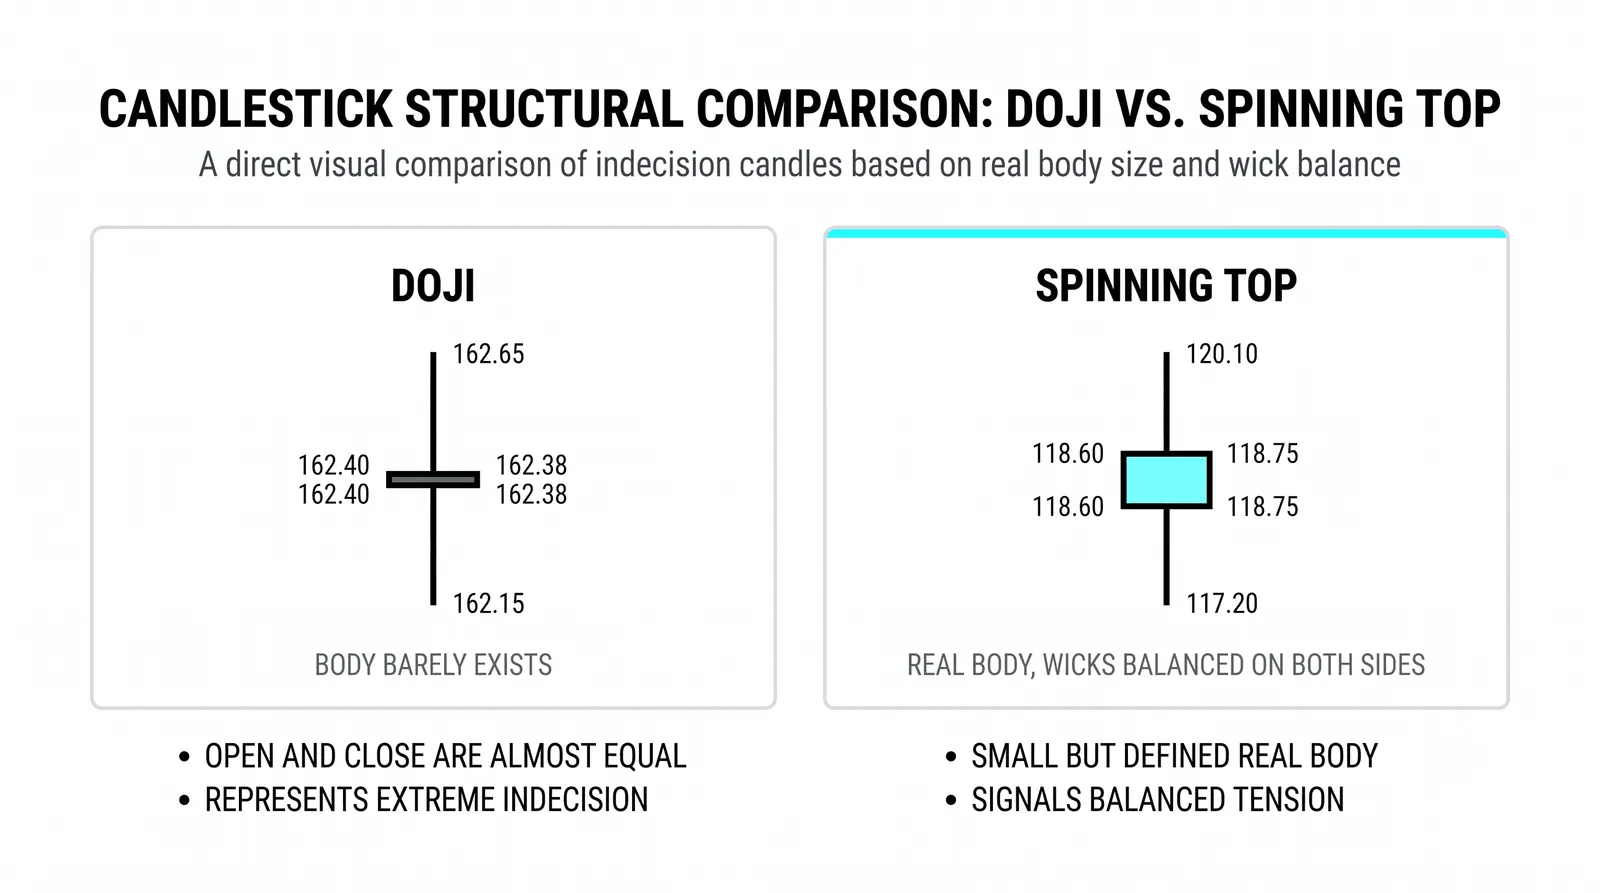
A doji forms when the open and close land at nearly the same price. Buyers pushed, sellers pushed, and the session ended in a standstill. The wicks can be long or short; what defines the candle is that almost nothing was settled.
Read it as hesitation. After a long trend, a doji tells you the side that was winning has stopped winning, at least for one session. That is new information. A trend that has printed confident candles for two weeks and suddenly prints a doji is a trend whose followers just lost their nerve.
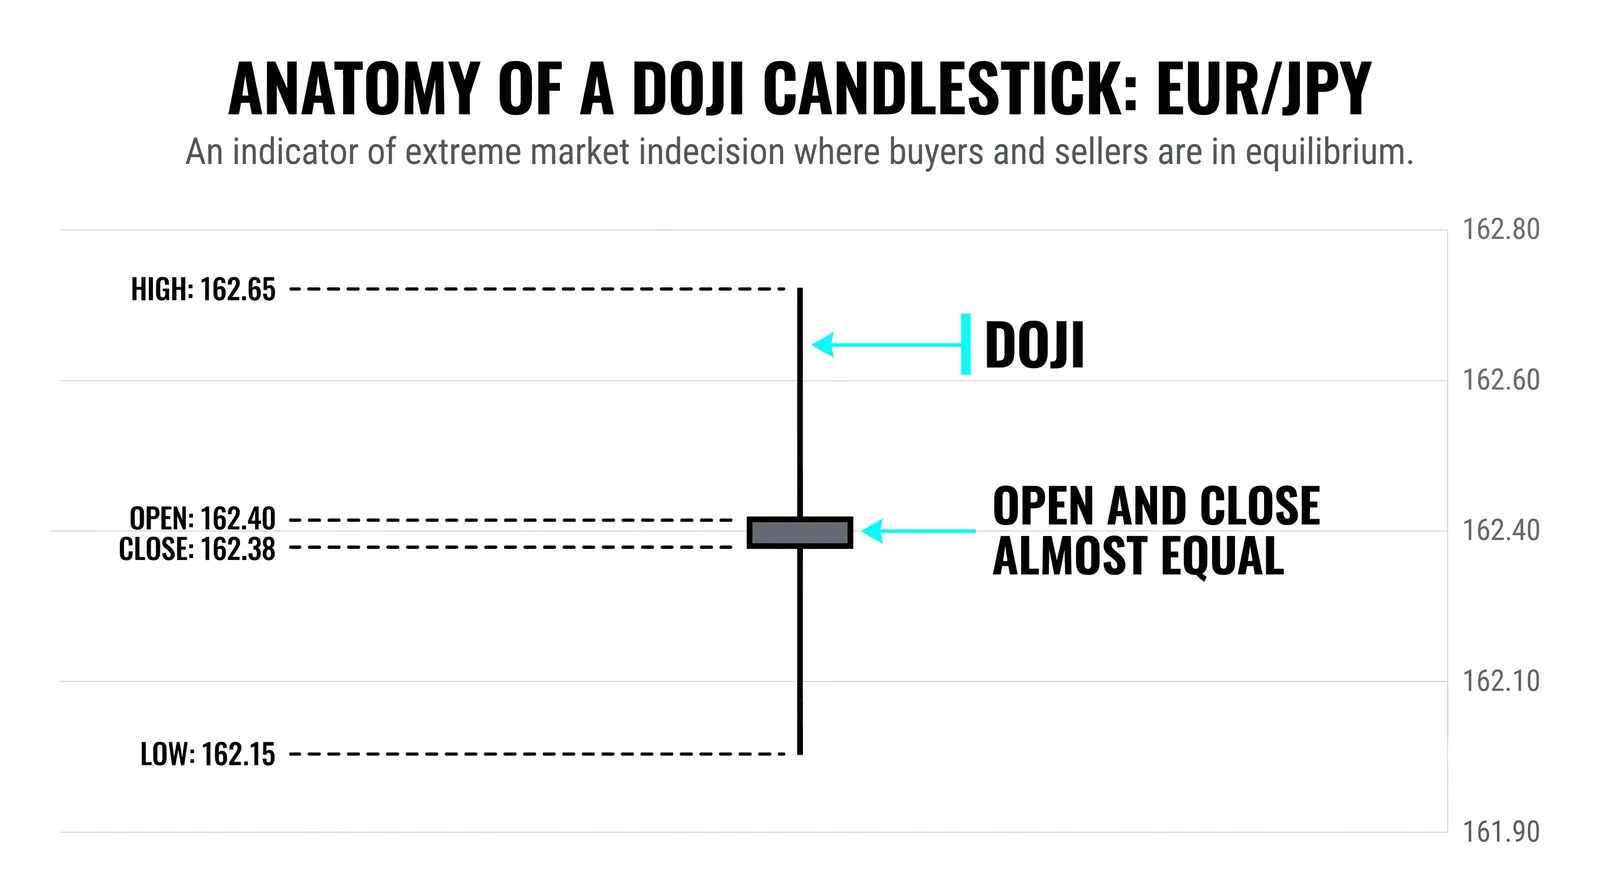
Mid-range, the same candle says almost nothing. Prices drifting sideways produce dojis constantly, because neither side has a reason to commit. A doji in a chop zone is background noise, not news.
So the doji's meaning scales with what came before it. After a strong directional move, it marks a possible exhaustion point worth watching. Inside a range, it is noise. By itself, in any location, it signals hesitation and nothing more.
The Hammer: Sellers Dug In and Got Pushed Out
A hammer has a small body near the top of the candle and a long lower wick beneath it. The story inside that shape is specific. Price dove during the session, sellers looked in control, and then buyers reclaimed nearly all of the loss before the close.
That recovery is the message. After a decline, a hammer shows that lower prices attracted real buying, more than a pause in selling. Someone with size decided the dip was worth buying, and they bought it hard enough to close the session near its high.
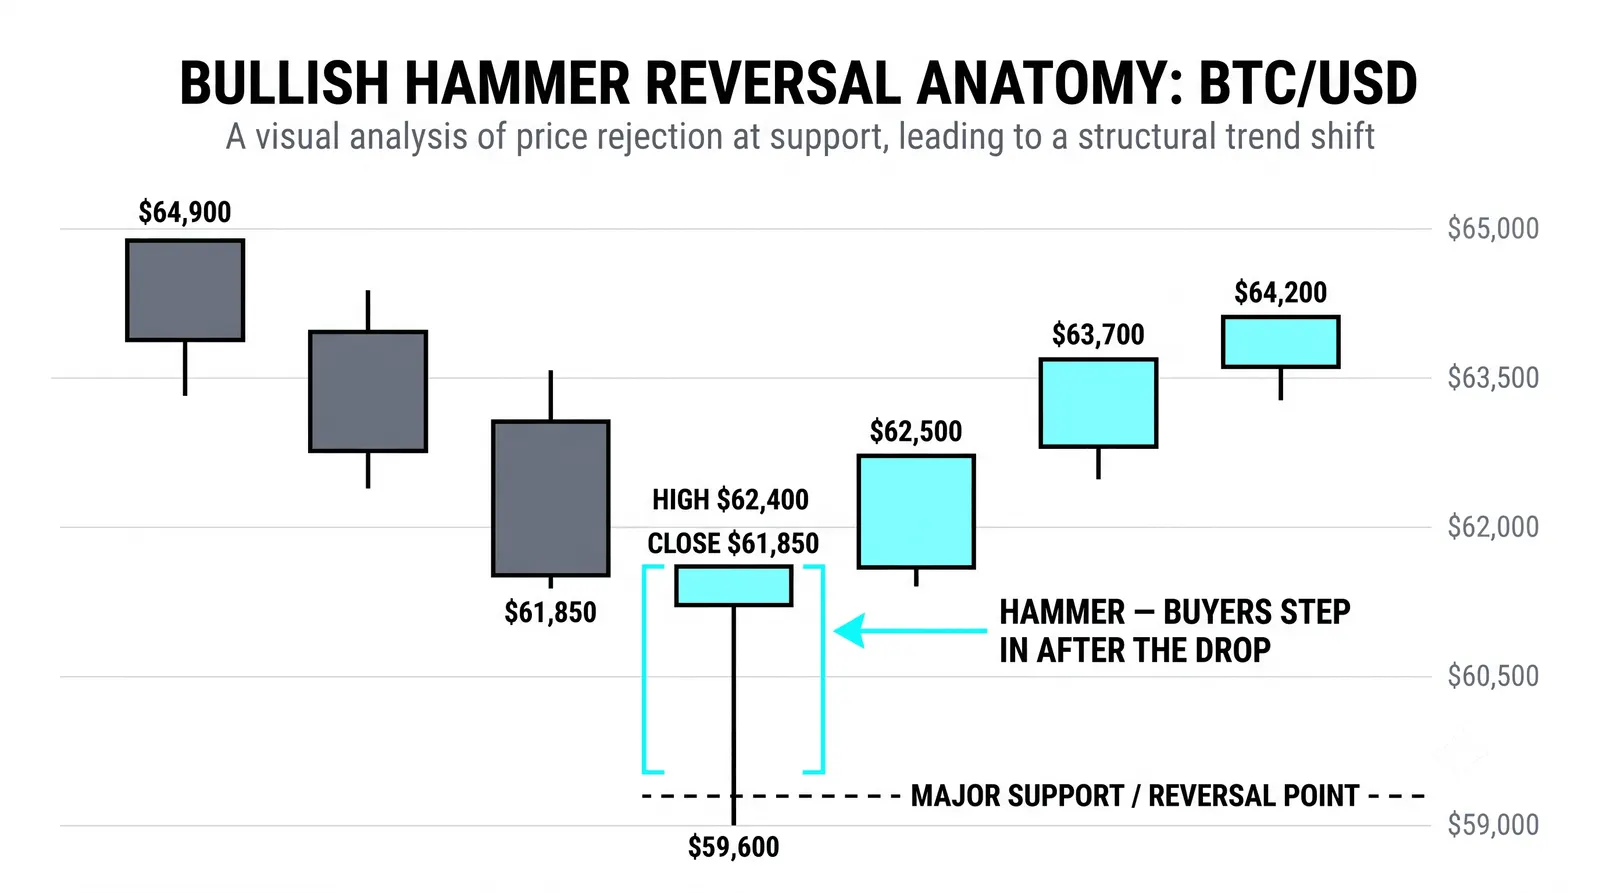
Location still governs. A hammer after a sustained drop, especially near a known support level, deserves your attention. A hammer in the middle of nowhere is just a session with a wick.
One caution: the hammer is a claim, not proof. The buyers won that session. Whether they can hold the ground is a question only the following candles answer.
The Shooting Star: The Rally That Got Rejected
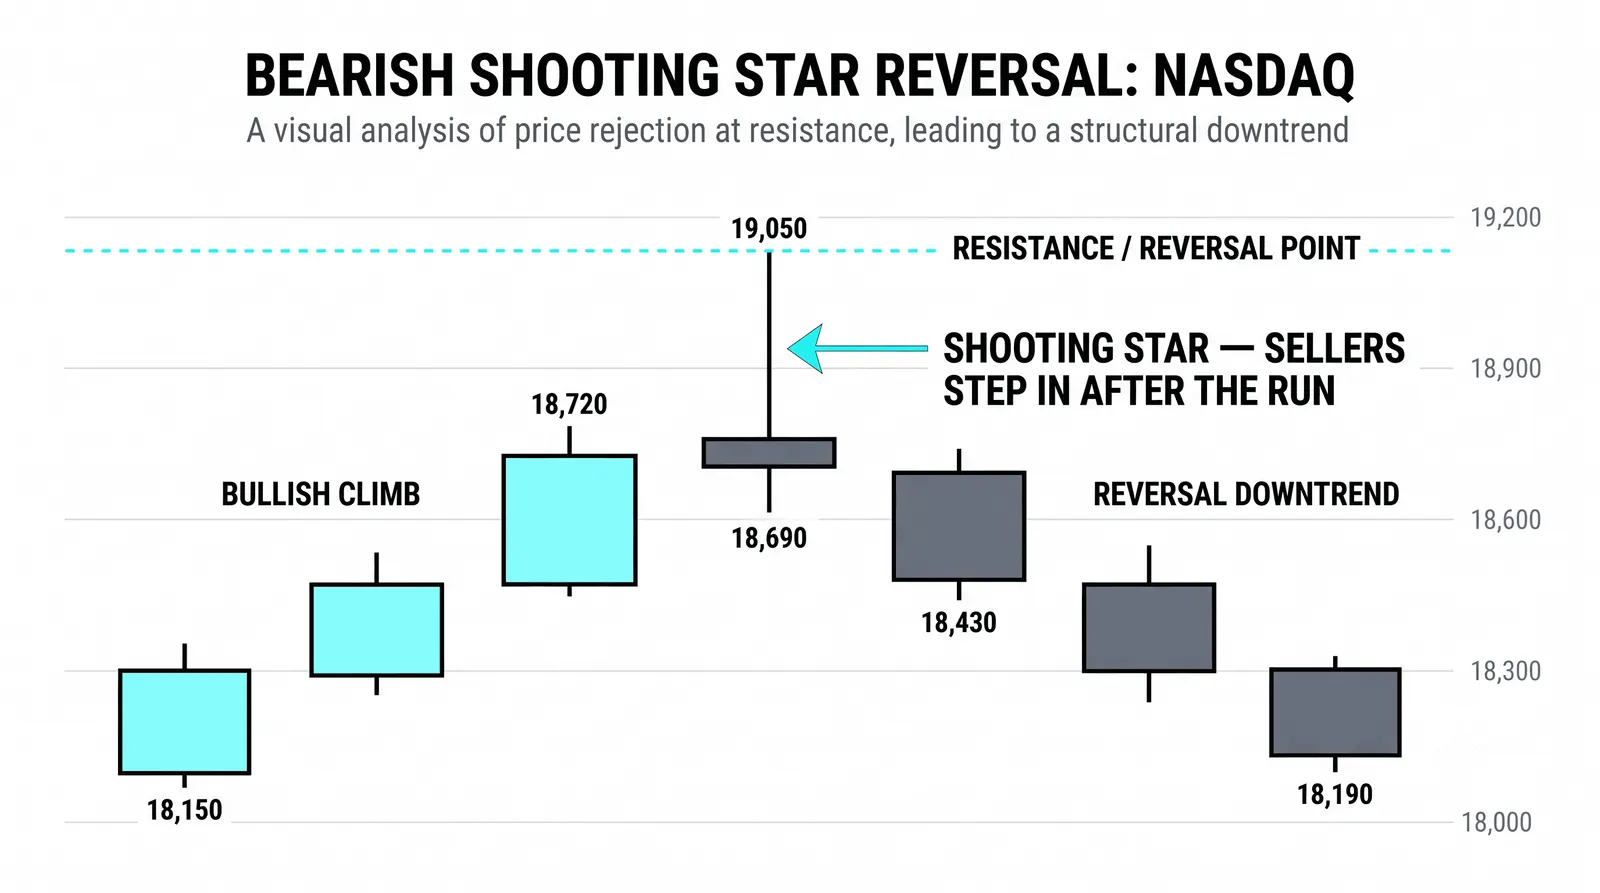
Flip the hammer upside down and you get the shooting star. A small body sits near the bottom of the candle, with a long upper wick above it. Price rallied hard during the session, and sellers drove it back down before the close.
After an advance, that rejection matters. Buyers pushed to a new high and could not hold it for even one session. Sellers were waiting up there, and they were aggressive enough to erase the entire intraday gain.
Now the part traders get wrong. The identical shape in a downtrend is meaningless. In a decline, a session that pops and fades is ordinary behavior, because rallies within downtrends fail all the time. The shooting star only carries information when it interrupts something, and in a downtrend it interrupts nothing.
Same shape, different setting, different message. That sentence applies to every pattern in this lesson.
The Spinning Top: A Weak Argument
A spinning top has a small body with wicks on both sides. Both buyers and sellers had moments of control, and neither kept it. It reads as mild disagreement.
Be honest about how weak this signal is. A doji is a clean standstill, which at least is a clear statement. A spinning top is a muddled one. It appears constantly, in trends, in ranges, everywhere, and most of the time it predicts nothing.
Traders overread it because it looks like it should mean something. It has wicks, it has a small body, it feels informative. Most of the time it is just an undecided session in an undecided stretch of price. If you find yourself building a trade idea around a spinning top, stop and look for better evidence.
The Four at a Glance
| Pattern | What the shape says | When it deserves attention |
|---|---|---|
| Doji | Open and close nearly equal; a standstill between buyers and sellers | After a long trend, where it marks possible exhaustion |
| Hammer | Price dove intraday and buyers reclaimed it before the close | After a decline, especially near support |
| Shooting star | Price rallied and sellers rejected the high before the close | After an advance, near resistance or prior highs |
| Spinning top | Mild disagreement; neither side held control | Rarely; treat it as background unless other evidence stacks up |
The Doji That Mattered
Here is a hypothetical with round numbers. A stock declines from 70 to 62 over two weeks, a steady slide with sellers in control the whole way. Then it prints a session with an open of 62.30, a high of 62.40, a low of 61.20, and a close of 62.35.
That is a near-perfect doji, and it printed at the low of the move. Sellers pushed price down to 61.20 during the session, a fresh low, and could not keep it there. The close came back to within five cents of the open. After two weeks of losing every argument, buyers finally fought one to a draw.
The next session closes at 63.80. That is the confirmation. The doji proposed that selling was exhausted, and the follow-through session proved buyers could move price, and not only defend it. A trader who waited for that second close had evidence. A trader who bought the doji itself had a guess.
Now the contrast. Two weeks earlier, the same stock printed an almost identical doji near 66, in the middle of its range. That one led nowhere, and price simply drifted through it. The shapes matched. The locations did not. At 66, the doji sat in undecided territory where standstills are routine. At 62, it arrived after a two-week decline, at the low, where a standstill is a genuine change in behavior.
Write that distinction down somewhere. Pattern plus location plus confirmation is a setup. Pattern alone is a shape.
Single Candlestick Patterns, Answered
Does a doji always mean a reversal?
No. A doji means the session ended in a standstill, and a standstill can precede a reversal, a continuation, or more drifting. After a long trend it raises the odds of a turn, but the trend can also resume after one indecisive session. Wait for the next candle to confirm direction before acting on one.
How big should a hammer's wick be?
A common working rule is a lower wick at least twice the length of the body, with little or no upper wick. The longer the lower wick relative to the body, the more dramatic the intraday rejection of lower prices, and the more weight the signal carries. A hammer with a wick barely longer than its body is a weak version of the idea.
Can a shooting star appear at a low?
The shape can print anywhere, but at a low it is not a shooting star in any useful sense. The pattern's meaning comes from sellers rejecting a rally after an advance. At the bottom of a decline there is no rally to reject, so the same candle is just noise. Name patterns by their context, not their silhouette.
Which single candle is the strongest signal?
None of them is strong in isolation, and any honest answer starts there. If forced to rank them, a hammer or shooting star at a well-defined level, after a clear move, tends to carry more information than a doji, because it shows an actual intraday fight with a winner. The spinning top sits at the bottom of the list. But the strongest version of any of these is the one the next session confirms.
Single candles are the smallest unit of market storytelling. Next, the natural step is two- and three-candle patterns, where one candle's proposal gets answered by its neighbors and the signals start carrying real weight.