The VIX: Reading Market Fear
The VIX is an index that measures the volatility traders are pricing into the S&P 500 over the coming month, derived from option prices. Because it spikes when markets are afraid, it has earned the nickname the fear index. That is the idea in one sentence, and it is enough to start reading it.

Think of the VIX as a seismograph: it records how hard the ground is shaking, never which direction the ground will move. High readings mean traders expect big swings. Low readings mean they expect quiet. Neither tells you up or down. Keep that split in mind through everything that follows, because most beginners get it wrong exactly once, expensively.
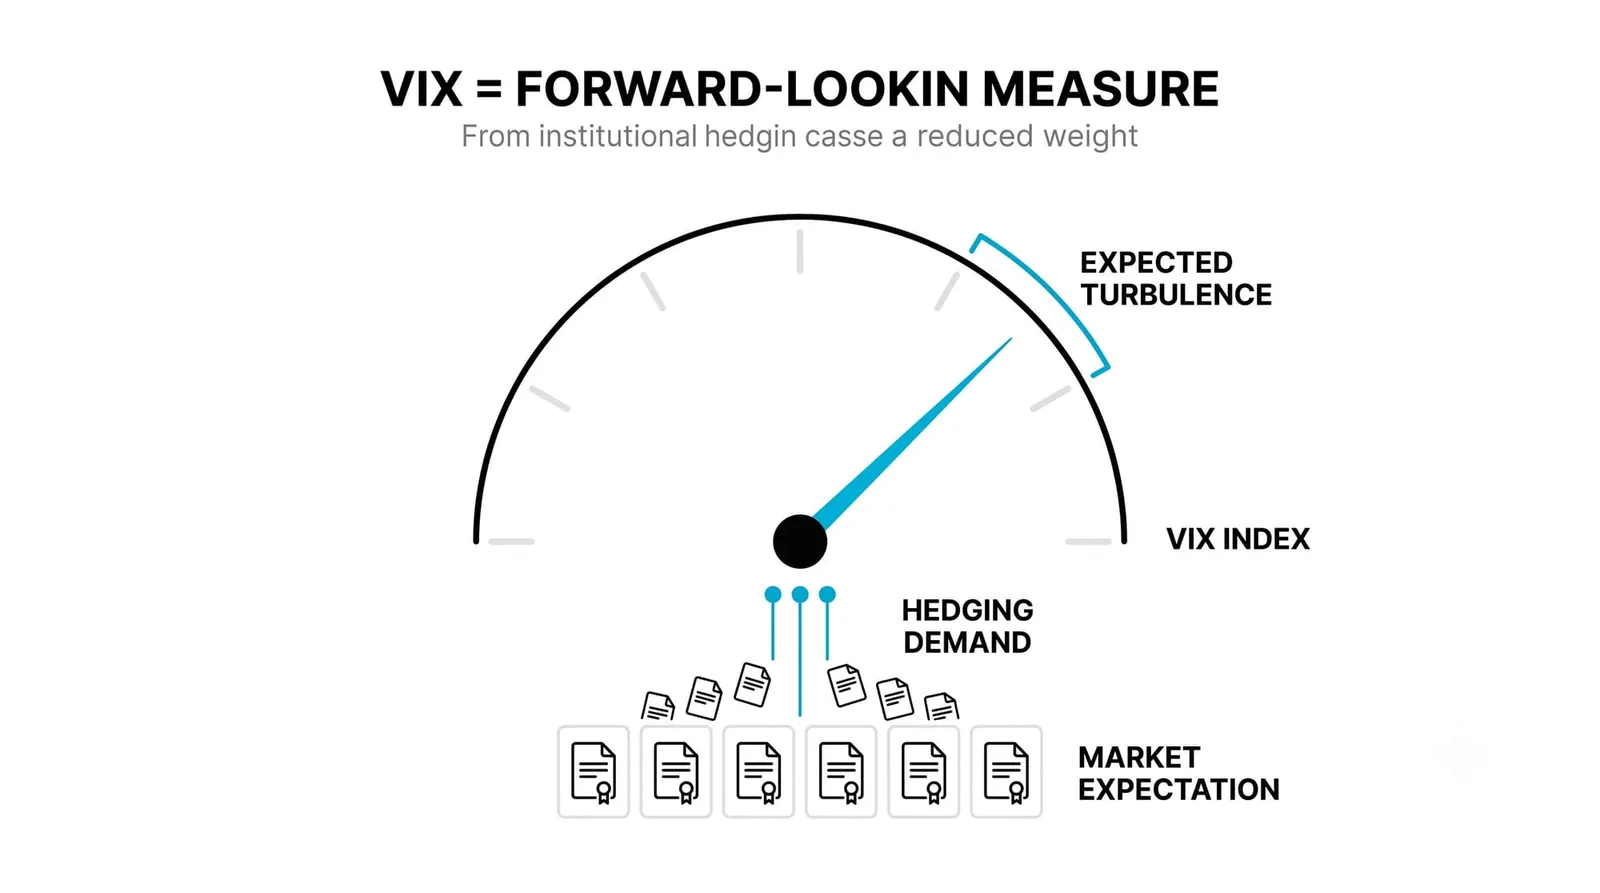
What the VIX Actually Measures
The VIX is built from the prices of S&P 500 options. Options are insurance contracts on the index, and their prices contain an implied forecast of volatility. The calculation extracts that forecast and expresses it as an annualized percentage.
So when you see a VIX reading of 20, the market is pricing roughly 20 percent annualized volatility. Divide by the square root of twelve and you get a monthly expectation of about 5.8 percent. Divide annualized by the square root of 252 trading days and you get a daily expectation. These conversions are how professionals translate the number into something usable.
The mechanics of what pushes it around are simple supply and demand. When traders rush to buy protective puts, option sellers raise prices to compensate for the risk they are absorbing. Higher option prices mean higher implied volatility, and the VIX rises. When fear fades, demand for protection dries up, option prices fall, and the VIX drifts lower.
The previous lesson covered the COT report, which reads sentiment from futures positioning. The VIX reads sentiment from a different source entirely: what options traders are paying for protection right now. Two gauges, two windows into the same crowd.
Why It Is Called the Fear Index
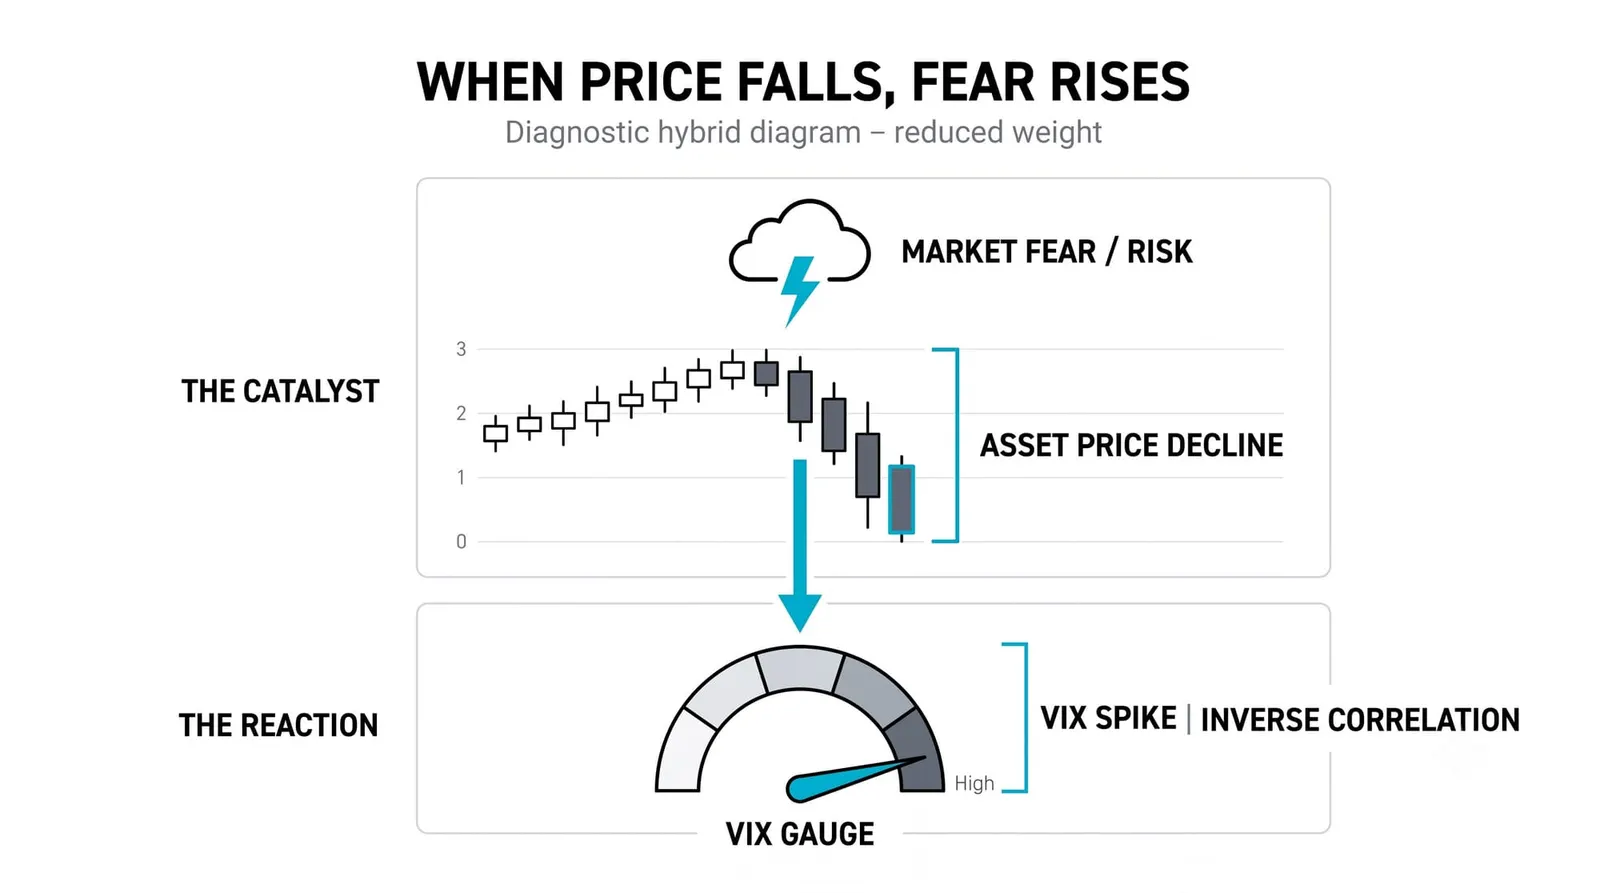
Stocks and the VIX usually move in opposite directions, and the relationship is strong enough to be one of the most reliable patterns in market data. When the S&P 500 falls sharply, the VIX almost always jumps. When stocks grind higher calmly, the VIX usually sinks.
The reason is behavioral. Falling markets trigger demand for protection. Portfolio managers who were comfortable last week suddenly want puts, and they want them now. That urgency shows up in option prices within minutes.
Rising markets produce the opposite psychology. Nobody panics into insurance when their portfolio is making money. Complacency is cheap, and cheap protection means a low VIX.
This is why VIX spikes cluster around shocks. A surprise rate decision, a bank failure, a geopolitical escalation: each one triggers the same scramble for puts, and the index lurches upward. The spike is the market's stress response made visible.
The asymmetry matters. Fear arrives fast and leaves slowly. The VIX can double in a day and take weeks to settle back down.
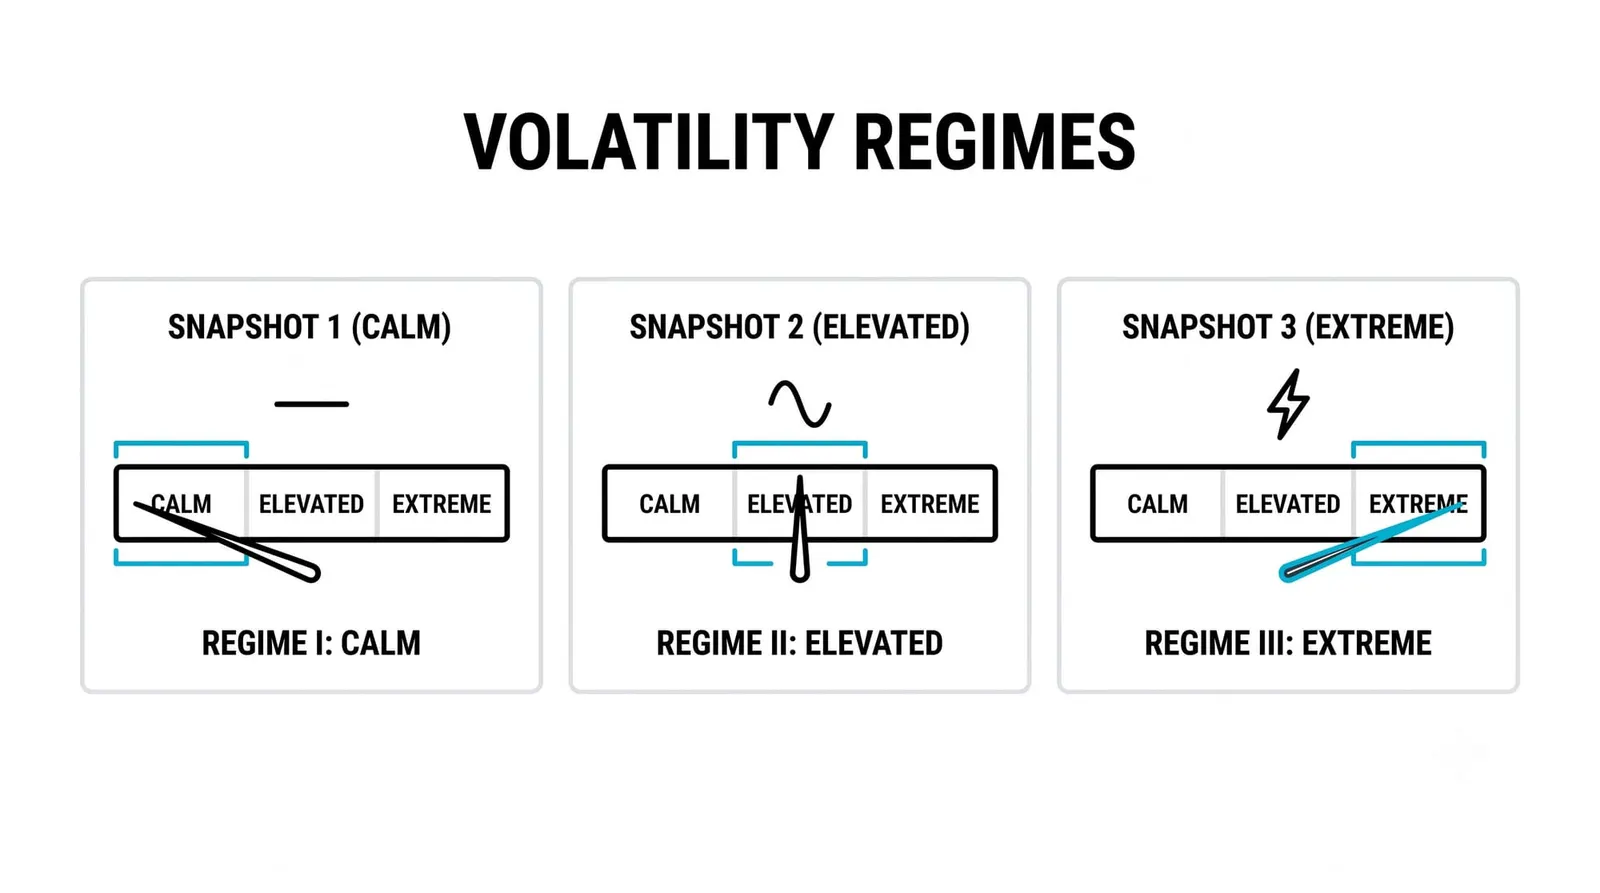
Reading VIX Levels: Calm, Elevated, Extreme
Traders use rough zones to interpret readings. These are conventions, not laws.
Readings in the low teens generally signal calm. Options are cheap, the market expects small moves, and trends tend to be orderly. Long stretches of low-teens readings usually accompany steady uptrends.
Readings from the mid-teens through the twenties signal elevated uncertainty. Something has the market's attention. This zone often appears around known events: major central bank decisions, elections, earnings seasons for heavyweight companies.
Readings above thirty signal extreme stress. Historically, sustained readings at that level accompany sharp selloffs, forced selling, and genuine panic pricing. They are rare, and they tend to mark emotionally charged moments rather than quiet ones.
Two warnings apply. First, every level is relative to history. A reading of 25 after years of readings near 12 means something different than 25 after a year near 30. Second, there are no magic thresholds. The VIX does not owe you a bounce at 30 or a selloff at 12. Treat the zones as context, not triggers.
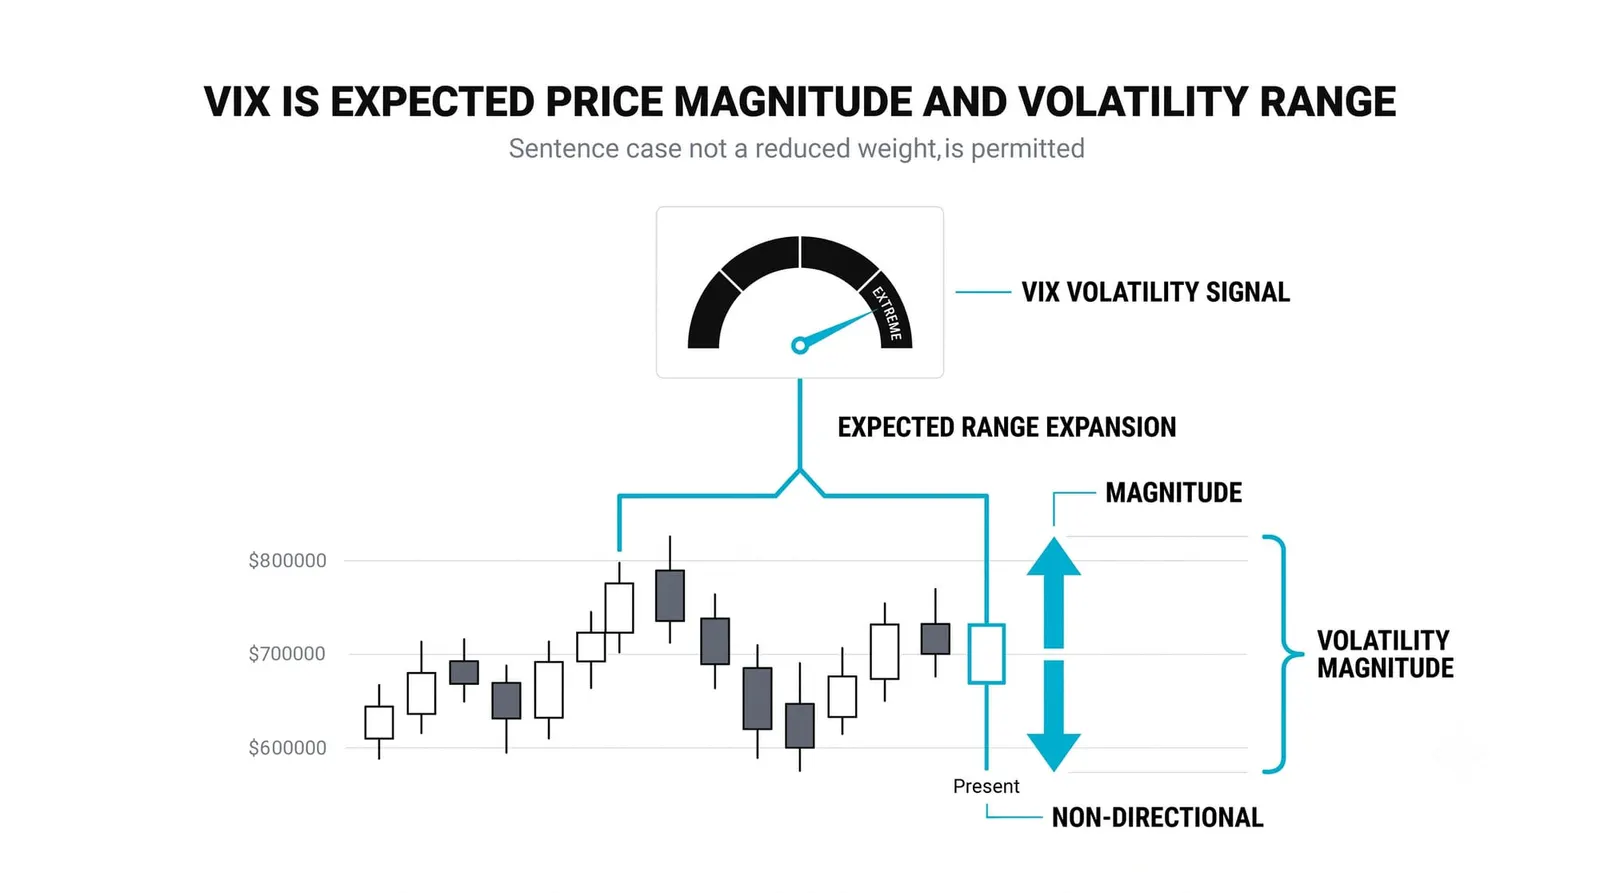
What the VIX Does and Does Not Tell You About Direction
The VIX prices the expected size of movement. It says nothing about which way that movement will go.
A VIX of 35 means traders expect large daily swings. Those swings could be violent rallies off a low just as easily as continued selling. Some of the biggest single-day gains in index history happened while the VIX sat at extreme levels.
That last point surprises people. The VIX can stay elevated through an entire recovery. Volatility is two-sided, and the index does not care which side delivers it.
So never read a high VIX as a sell signal or a low VIX as a buy signal. Read it as a regime indicator: how wide should my stops be, how big should my positions be, how much noise should I expect between my entry and my thesis playing out.
One Index, Two Regimes
Here is a purely hypothetical illustration with round numbers.
Regime one: a stock index drifts upward, gaining a few tenths of a percent most weeks. The VIX sits at 13. Convert that to a daily expectation: 13 divided by the square root of 252, which is about 15.9, gives roughly 0.8 percent. The market expects typical daily moves well under one percent.
In this regime, a stop placed 1 percent away from entry sits just outside normal daily noise. Position sizing can be relatively generous because adverse moves are small and slow.
Regime two: a banking headline hits. The index drops 3 percent over a few sessions, and the VIX reaches 28. Now the daily expectation is 28 divided by 15.9, roughly 1.8 percent. Daily swings have more than doubled.
Everything about risk management changes. That same 1 percent stop is now inside normal daily noise and will get hit by random fluctuation alone. A stop that made sense in regime one needs to roughly double in width to survive regime two. If you keep the same position size with wider stops, your dollar risk doubles. So the disciplined response is to cut position size roughly in half, keeping risk constant while giving trades room to breathe.
Same trader, same strategy, same risk budget. The VIX told you the environment changed before your P&L did.
| VIX Reading | What It Signals | What It Changes for a Trader |
|---|---|---|
| Below 15 | Calm; market expects small daily moves | Tighter stops are viable; normal position sizing; watch for complacency |
| Teens to twenties | Elevated uncertainty; an event or worry is being priced | Widen stops modestly; check the calendar for what is being priced |
| Above 30 | Extreme stress; large daily swings expected | Cut size sharply or stand aside; expect violent moves in both directions |
| The spike itself | A shock just hit; fear is being repriced in real time | Wait for the spike to crest before trusting any level; widen every risk assumption |
The VIX, Answered
Can you trade the VIX directly?
No, not the index itself. The VIX is a calculated number, not a tradable asset. Traders access it through VIX futures and products built on those futures, which behave very differently from the spot reading because they price where volatility is expected to be at the future's expiry. Those products carry structural quirks, including persistent decay in calm markets, that punish buy-and-hold thinking.
What does a VIX of 20 actually mean?
It means options prices imply roughly 20 percent annualized volatility for the S&P 500. In practical terms, that works out to an expected monthly move of about 5.8 percent and a typical daily move near 1.3 percent, in either direction.
Does the VIX predict crashes?
No. The VIX reflects what traders currently expect, and expectations follow events more often than they precede them. A low VIX before a crash tells you only that nobody saw it coming, which is usually the case. It measures present fear, not future facts.
Why do stocks and the VIX usually move in opposite directions?
Because falling markets trigger urgent buying of protective puts, which drives option prices and implied volatility higher. Rising markets do the reverse: protection demand fades and the VIX sinks. The link is behavioral, not mechanical, which is why it is strong but not perfect.
Next lesson goes deep on news events themselves: how scheduled and unscheduled headlines move markets. The VIX is where the market pre-prices how hard upcoming news might shake things, so keep one eye on it as you learn to read the calendar.