Bollinger Bands: The Full Breakdown
Bollinger Bands give price something a raw chart never offers: a relative definition of high and low. A close near the upper band is high for this market, right now, measured against its own recent behavior. A close near the lower band is low by the same standard. John Bollinger built the tool in the 1980s around exactly that idea, and the framing matters more than any single signal the bands produce.

Picture a river after a storm. The banks spread wide, churned up and far apart. Weeks into a dry spell the same river runs narrow and quiet between tight banks. The banks respond to the recent weather; they do not predict the next storm. Bollinger Bands behave the same way with volatility, widening after turbulent bars and pinching tight through calm ones, always describing what the market has just done.
Volatility itself got its own treatment in the volatility lesson; here the subject is the indicator built from it, one of the most widely plotted tools in the volatility category of the four indicator families.
The Construction: Middle, Upper, Lower
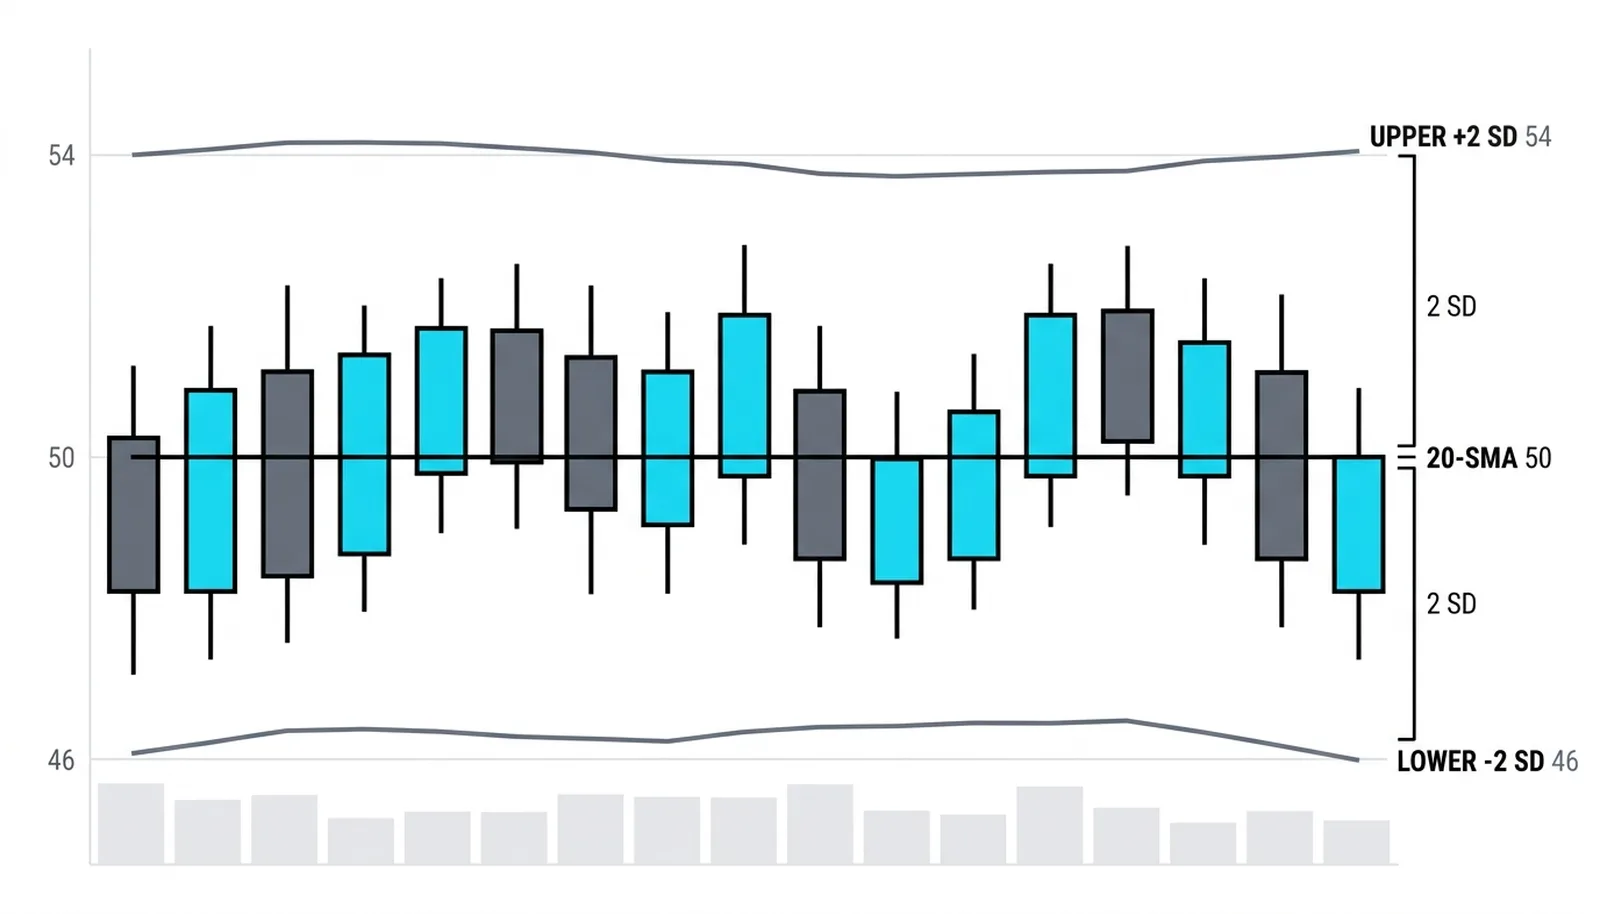
The middle band is a 20-period simple moving average, the same average covered in the SMA lesson. Around it, the tool measures how far price has been scattered from that average over the same 20 bars. That scatter is the standard deviation.
The upper band sits two standard deviations above the middle. The lower band sits two standard deviations below it. With the defaults of 20 and 2, the band pair expands and contracts purely as a function of recent price dispersion, nothing else. Most platforms ship with those defaults, and they remain the reference point in almost everything written about the tool.
One mechanical detail matters if you customize: if you swap the simple average for an exponential or weighted one, the change must apply to both the middle band and the deviation calculation. Mixing an exponential middle with deviations from the simple average produces a band pair nobody designed.
What the Width Tells You
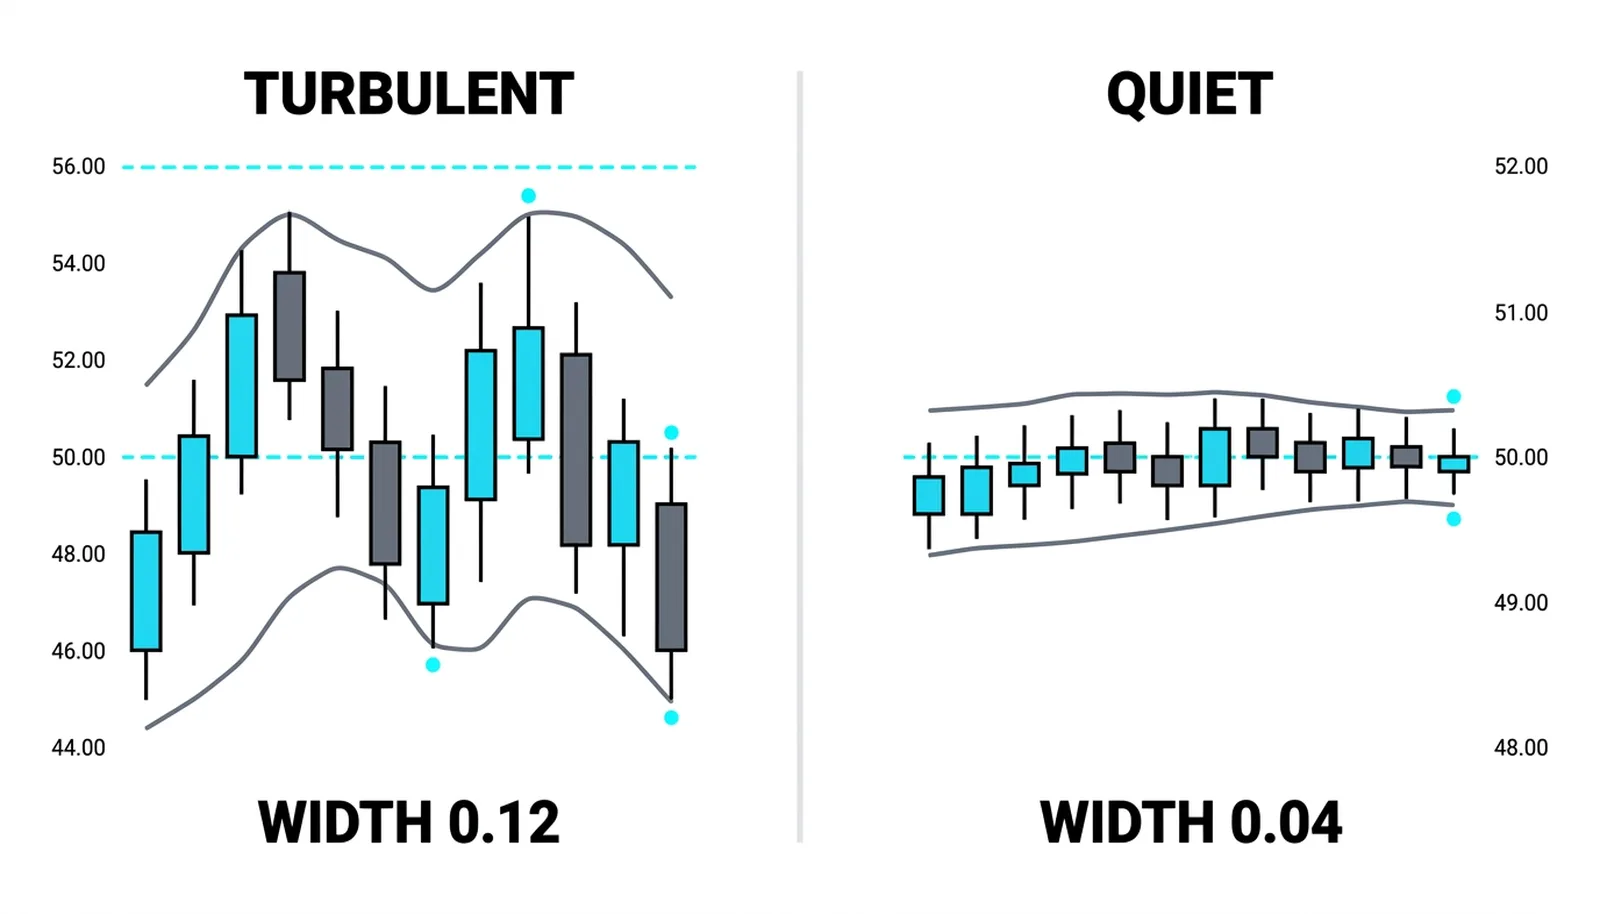
Wide bands mean the last 20 bars were turbulent. Narrow bands mean they were quiet. The width is a description of the recent past window, and nothing more. The bands widen after volatility arrives; they never widen in anticipation of it.
The statistics deserve an honest paragraph, because the bands carry a reputation they never earned. Textbook normal-distribution logic says about 95 percent of readings should fall inside a two-standard-deviation envelope. Price does not follow a normal distribution. Returns have fat tails, bars are correlated with the bars before them, and a 20-bar sample is far too small for textbook percentages to hold. Studies that actually count find roughly 85 to 90 percent of closes inside the bands, and the exact figure wanders by market and period. Treat the bands as a yardstick for recent conditions, not a container price respects 95 percent of the time.
Percent b: Where Price Sits Inside the Bands
The raw chart shows location by eye. The derived reading called %b turns location into a number. Take the close, subtract the lower band, and divide by the distance between the bands. A close sitting on the upper band reads 1. A close on the lower band reads 0. A close at the middle band reads 0.5.
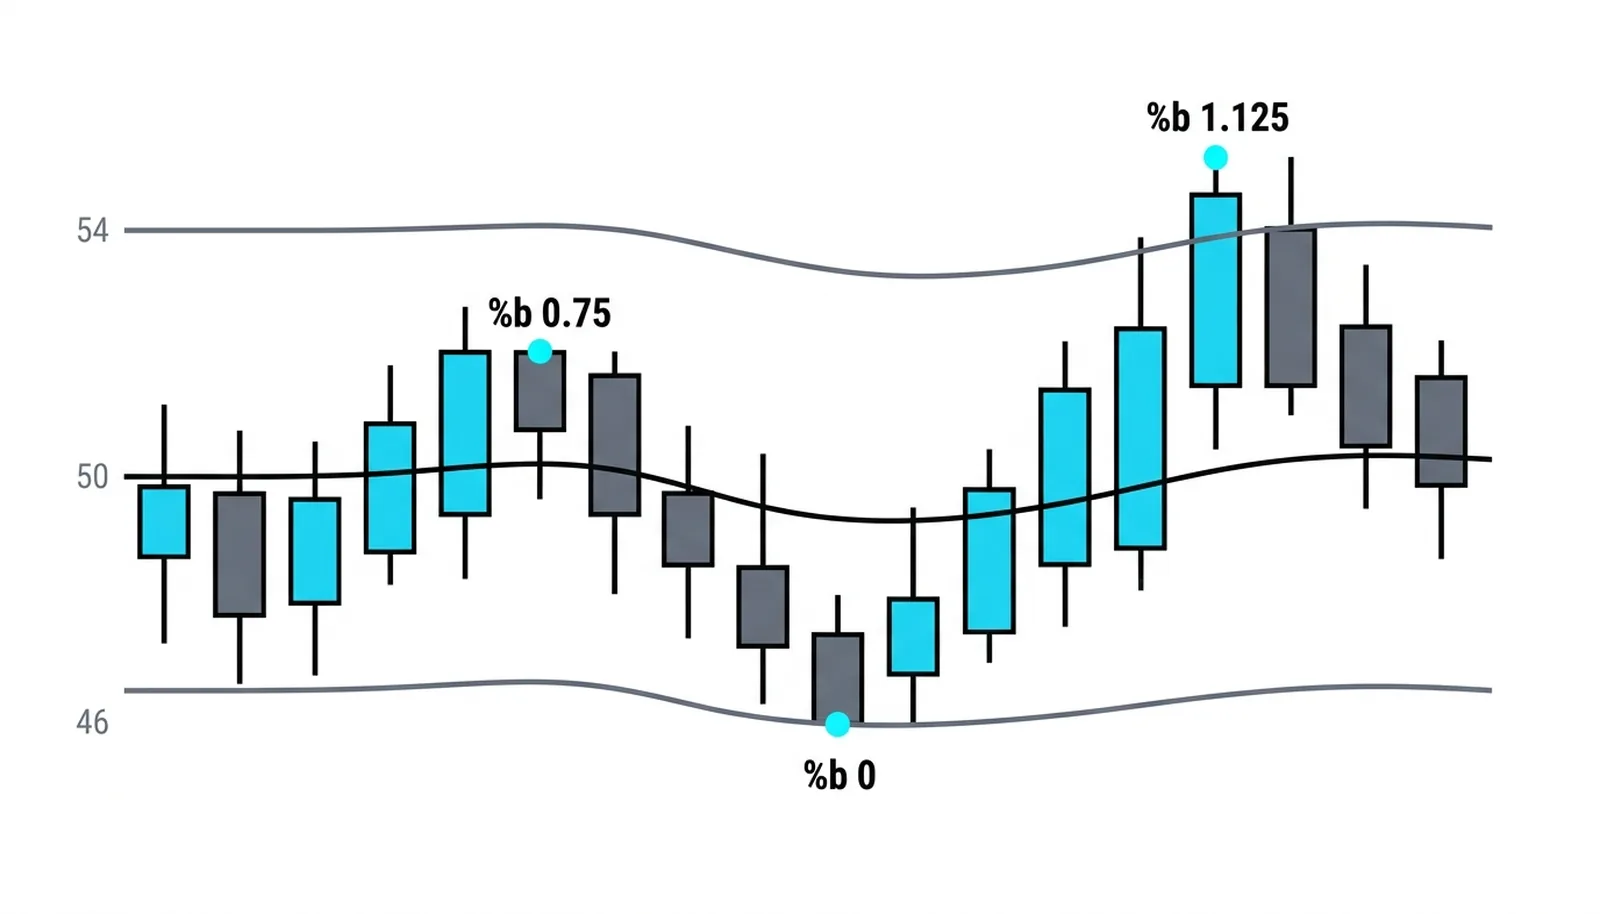
Values above 1 or below 0 are not errors. A close beyond the upper band prints above 1, and that print is often the most informative number on the chart, because it marks a close outside the recent envelope during exceptional conditions. The number's job is precision: 0.9 and 1.1 are both "near the top", but they describe different bars.
BandWidth: One Number for the Width
Width gets its own indicator too. BandWidth takes the distance between the bands and divides it by the middle band. The result is a single series that rises as the bands spread and falls as they pinch, comparable across time on the same chart because the price level cancels out.
At the 20-and-2 defaults the arithmetic works out to four times the coefficient of variation of the last 20 closes, which matters only if you like the statistics. In practice the useful fact is simpler: BandWidth is sortable and scannable. You can rank every bar in a year by BandWidth and find, in one query, the quietest stretch the market produced. That capability is what the squeeze lesson builds on.
The Two Ways Traders Use Them
Everything traders do with the bands falls into two families, and the split tracks the regime.
The first family treats the bands as stretch marks. In a quiet, sideways market, price pokes the lower band, then drifts back to the middle, and traders sell the far band and buy the return. The second family treats a close outside a band as evidence that volatility has arrived and a direction with it, and trades the break. Both are legitimate. Both fail badly applied to the wrong regime, which is why the later lessons in this batch split the work: the squeeze lesson covers measuring the quiet before expansion, the breakout lesson covers trading expansion, and the mean reversion lesson covers the return-to-the-middle trade.
Two relatives get their own lessons later in this level, so they stay name-only here: Keltner Channels, which build bands from average true range instead of standard deviation, and ATR itself, which measures bar-to-bar range rather than close dispersion. The comparison comes with those lessons.
One Band Pair, Computed
Round numbers, all hypothetical. A stock trades near 50. The average of the last 20 closes is 50, and the standard deviation of those closes is 2. The upper band is 54, the lower band is 46.
Today the close is 52. Subtract the lower band: 52 minus 46 is 6. The band distance is 8. Six over eight gives %b of 0.75, upper half, close to but not at the top.
Next session the close lands at 46, right on the lower band. The reading is exactly 0. The session after, the close prints 55, one full point above the upper band. The reading is 55 minus 46 over 8, which is 1.125. Nothing broke. The market just closed outside its recent envelope, and the number says so precisely.
| Close location | What %b shows | What it does not prove |
|---|---|---|
| Above the upper band | Reading above 1; a close outside the recent envelope | Neither a breakout nor a reversal; the regime decides which it is |
| Upper half of the bands | Reading between 0.5 and 1; strength relative to the window | That strength will continue |
| Lower half of the bands | Reading between 0 and 0.5; weakness relative to the window | That price is cheap in any absolute sense |
| Below the lower band | Reading below 0; a close outside the envelope on the downside | That a bounce is due; in trends these prints chain together |
Bollinger Bands, Answered
What are Bollinger Bands?
A moving average with two bands placed a set number of standard deviations above and below it, usually a 20-period average with bands at plus and minus two deviations. The design gives price a relative definition of high and low: high near the upper band, low near the lower band, measured against the market's own recent behavior.
What do the default settings 20 and 2 mean?
The middle band averages 20 bars, and the bands sit two standard deviations from it, using the scatter of the same 20 closes. Most platforms ship these values. If you change the average type, change the deviation calculation to match, so both halves of the tool measure the same window the same way.
What percentage of price stays inside Bollinger Bands?
Counting studies find roughly 85 to 90 percent of closes inside the bands, not the 95 percent a normal distribution would suggest. Returns have fat tails and serial correlation, and 20 bars is a small sample. The bands describe recent conditions; they do not fence price in.
What is %b?
A normalized location reading: close minus the lower band, divided by the band distance. It reads 1 at the upper band, 0 at the lower band, 0.5 at the middle. Values outside that range mark closes beyond the bands, which is information rather than error.