What Is a Fibonacci Expansion
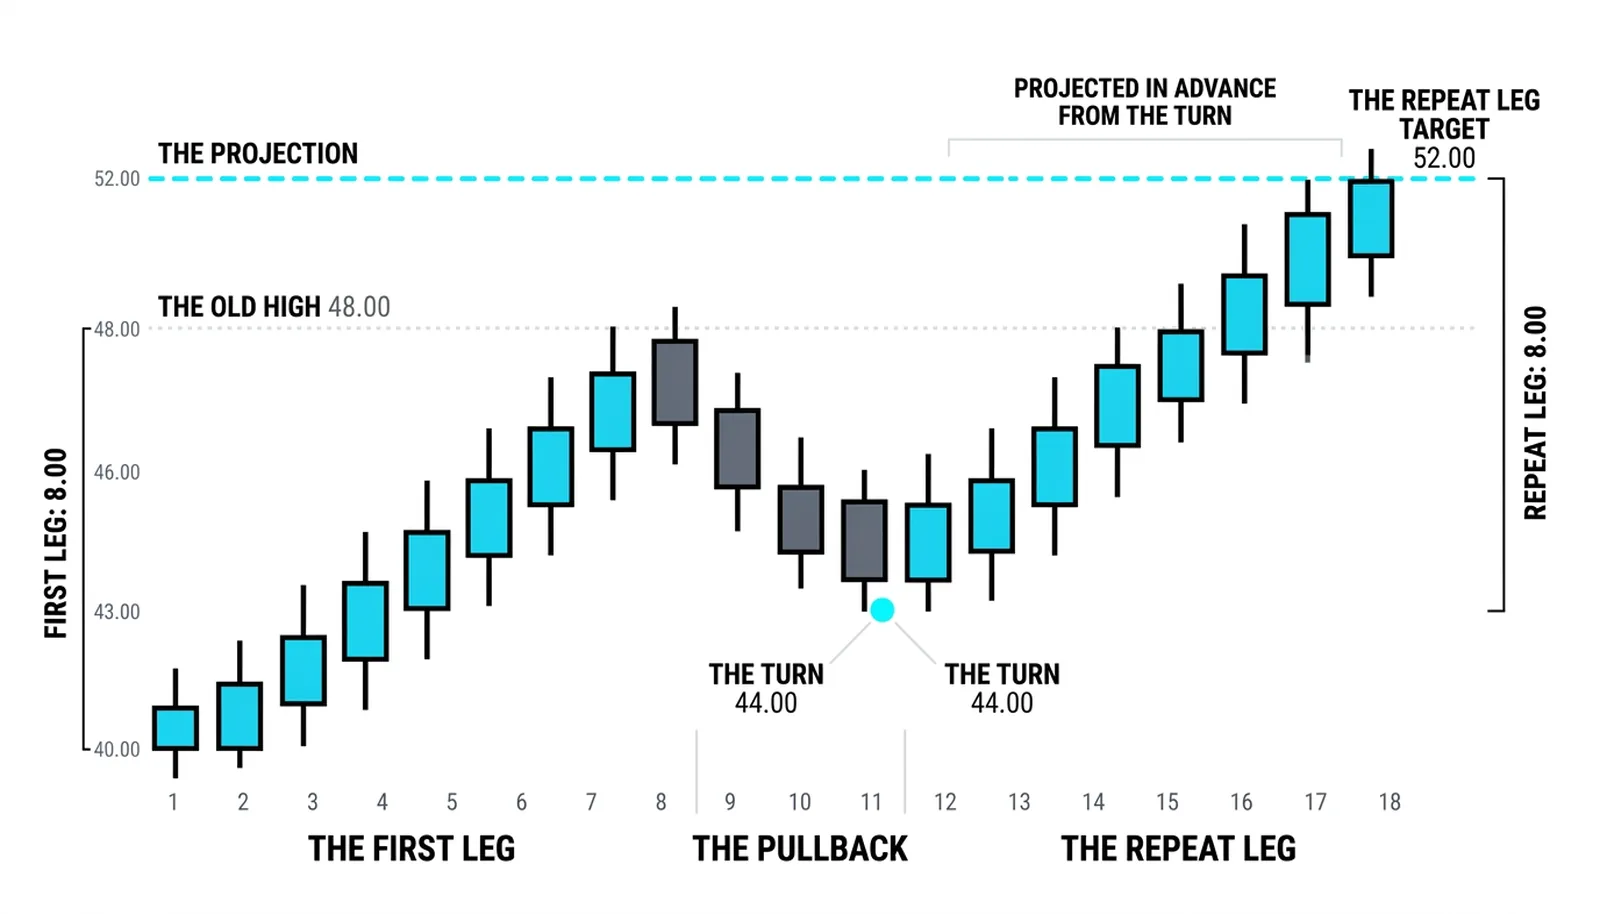
A fibonacci expansion is the projection of the next impulse measured from where the pullback ended, usually sized at the prior leg's own height, so that a leg of 8.00 points that pulls back and turns carries a projected target 8.00 points above the turn. The anchor is the pullback's low, not the original swing's base. That single difference separates this tool from everything the extensions lesson built.

Picture the second leg as the first leg's mirror twin, grown from the point where the pullback ended, the same size repeated. The market ran 8.00 points, rested, and now the projection says it runs 8.00 points again from wherever the rest stopped. Simple to draw. Harder to trust, because the projection only exists once the pullback is actually finished.
The Cousin Measurement
The targets lesson closed with a promise: the expansion, the cousin measurement reading the next impulse from the same swing, would get its own lesson. This is that lesson. The first job is telling the two cousins apart, because the extension section built one of them and this one builds the other.
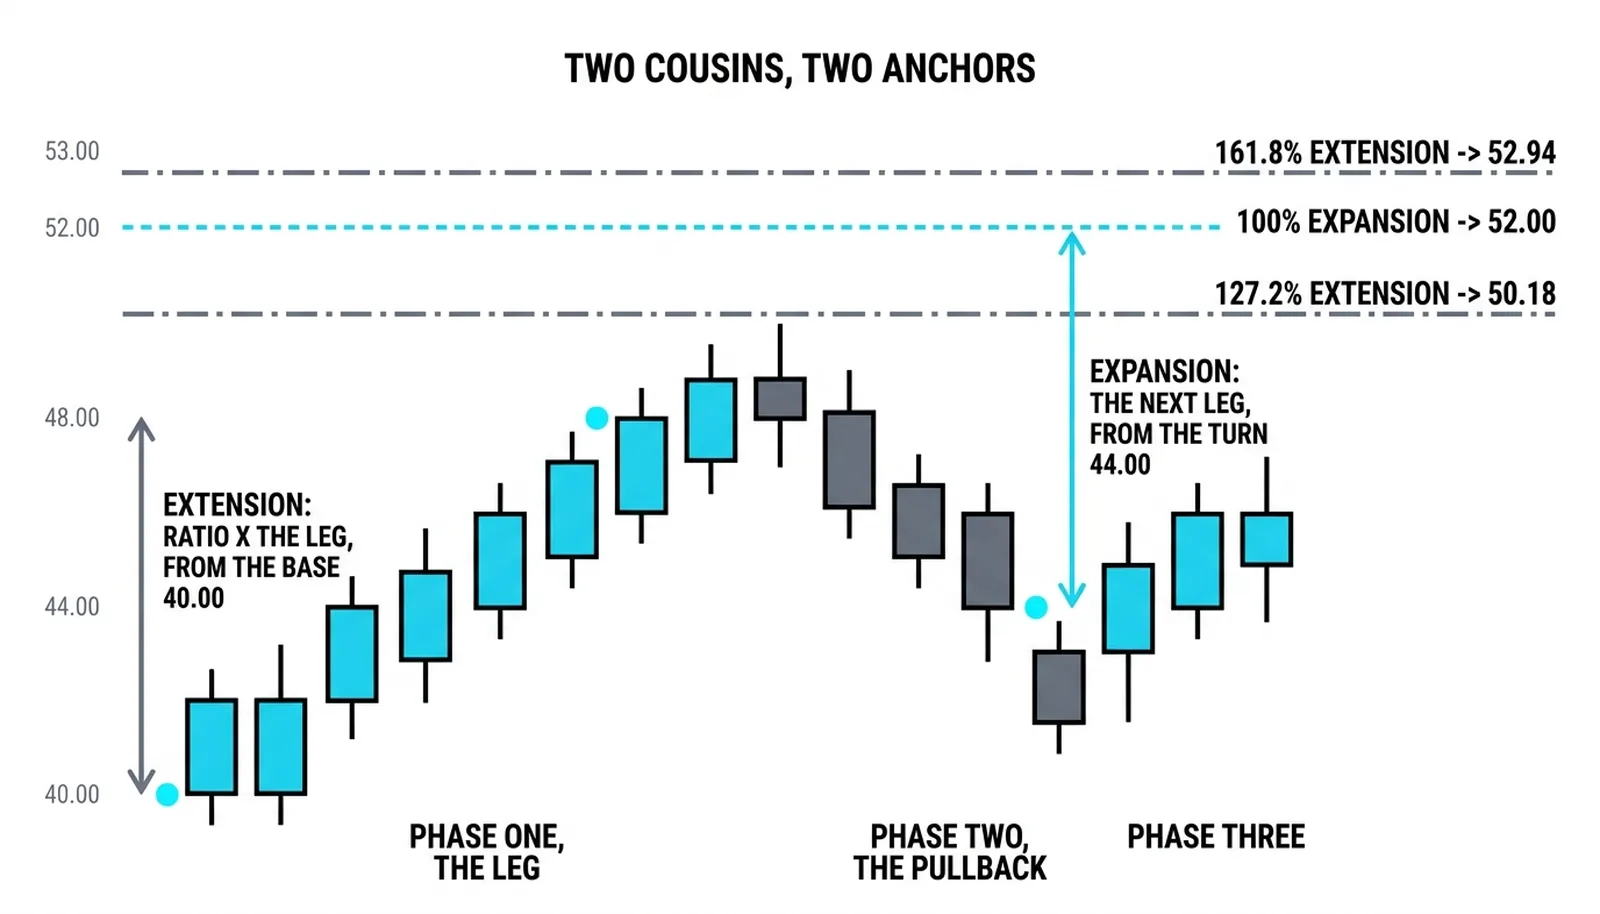
The extension multiplies the original leg's full height by a ratio greater than one and anchors at the original swing's base, projecting past the old extreme. It asks how far price can run beyond the high. The expansion anchors where the pullback ended and projects the next leg's size, most often the prior leg's own height, the 100 percent measured move, sometimes a ratio of it. It asks how big the leg starting at the turn should be.
On the same chart the two answers differ. Take a leg of 8.00 points from 40.00 to 48.00. The extension, measured from 40.00, sits at 50.18 and 52.94. The expansion from a pullback that ended at 44.00 sits at 52.00 for the equal-size repeat. Same swing, two anchors, two questions, three different numbers.
The cluster method projects both from the same completed swings and treats the anchor choice as the whole decision. The naming honesty belongs in the telling: platforms label these tools inconsistently, some calling expansions extensions, so the concept, the anchor and the question matters more than the label on the button.
The Measured Move in Motion
The 100 percent projection is the oldest target method on the chart. The price action canon built a measured-move doctrine around it: markets repeat leg sizes, and the second leg often resembles the first. That observation is the entire foundation of the equal-size projection.
Why would a market repeat a leg size? Because the same crowd that drove the first leg is still there when the pullback ends. The urgency that produced 8.00 points of movement has not changed character just because price rested. The projection assumes continuity of behavior, and that assumption holds often enough to trade.
Respect is earned, not granted. Three conditions make the projection worth acting on:
- The pullback ended at a level that means something: a retracement line, prior structure, a moving average the trend respects.
- The turn shows evidence, a strong reversal bar or a break of the pullback's own small trendline, not a hope.
- The first leg was clean and impulsive, which gives the measured size credibility as the crowd's stride length.
A leg that crawled up in overlapping bars does not produce a trustworthy twin. A leg that ran with conviction does. The projection inherits the quality of the leg it copies.
Ratios beyond 100 percent exist for strong trends. A 1.272 or 1.618 multiple of the prior leg, projected from the pullback's end, marks where an extended second leg might exhaust. Use the equal-size repeat first. It is the base case, and the base case pays most often.
Trading the Expansion
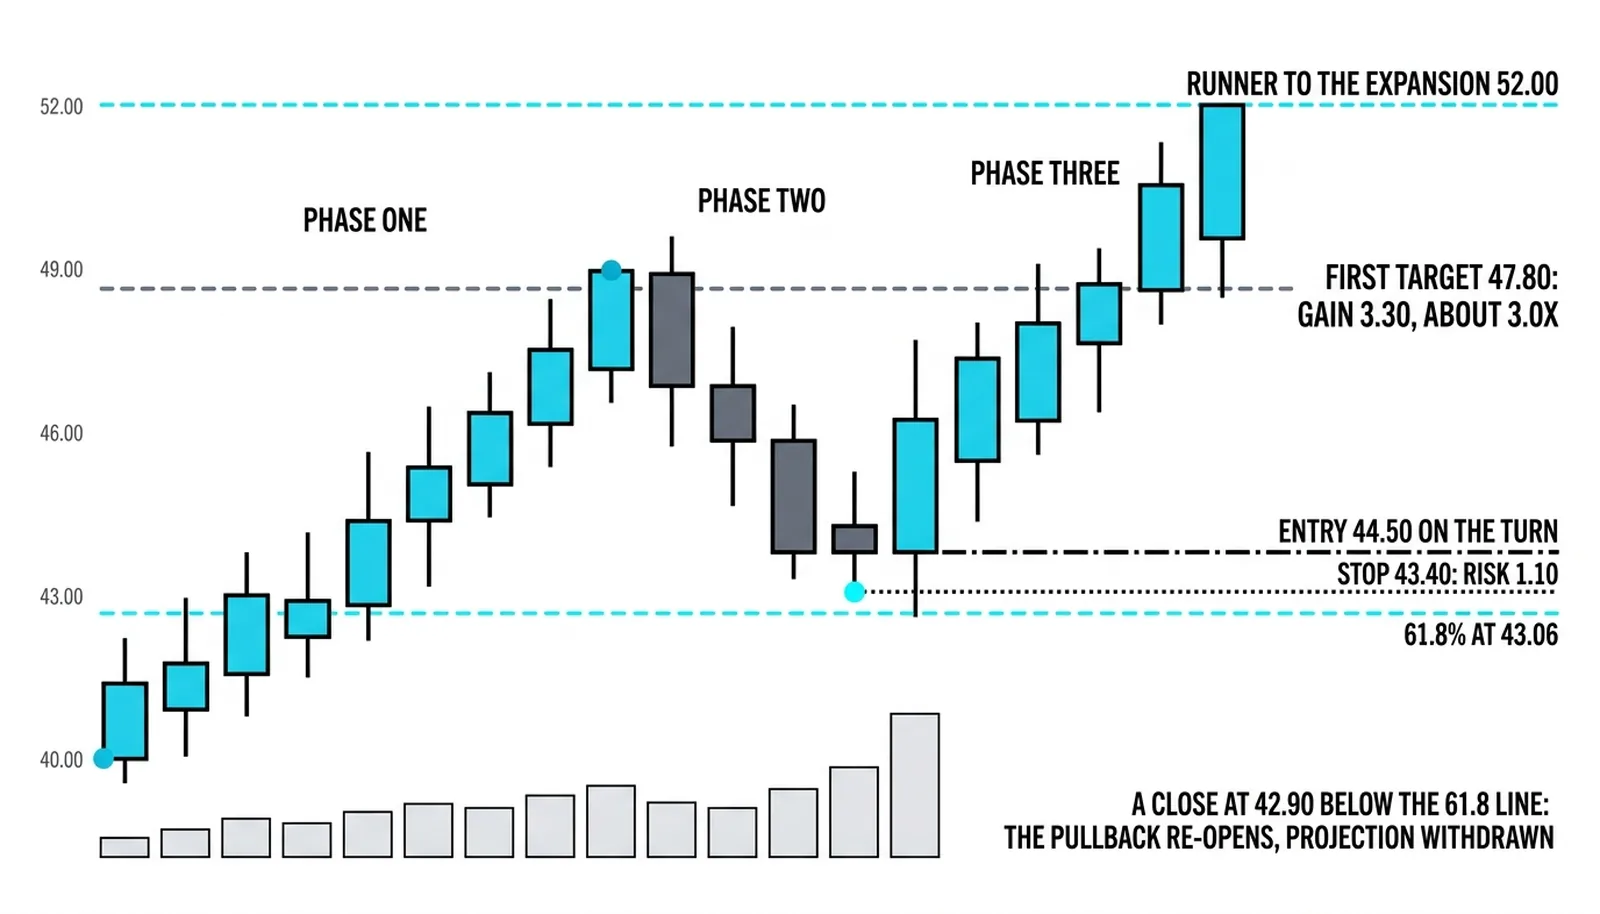
The trade starts at the confirmed turn, not at the projection. A leg runs 8.00 points from 40.00 to 48.00, the pullback ends at 44.00 right on the 50 percent retracement line, and the long is taken at 44.50 as the turn confirms. The stop sits at 43.40, risking 1.10.
The first target is 47.80, just under the old high. That exit pays 3.30, about 3.0 times the risk, and it banks the trade's core profit before the projection is even tested. The runner stays on for the expansion target at 52.00, the equal-size repeat leg.
Now the honesty. The expansion's anchor is the pullback's end, which means the projection only exists once the pullback is over. Price that closes at 42.90, below the 61.8 line at 43.06, has not ended its pullback. It has re-opened the question. The 52.00 projection is withdrawn, and the trader stands down.
A target measured from a turn that has not been confirmed is a target measured from a guess.
The scaling plan from the targets lesson is exactly how the 52.00 gets earned rather than assumed: first fraction at the high, runner toward the projection, stop trailed behind each new pullback low. The projection is a destination the trade walks toward in stages, not a promise collected on entry.
The Repeat Leg to 52.00
All numbers here are hypothetical, round, and invented for illustration. A market runs 8.00 points from 40.00 to 48.00. The pullback ends at 44.00, precisely on the 50 percent retracement line. Two measurement families now sit on the same chart.
| The measurement | Its anchor | Its question | Its answer |
|---|---|---|---|
| Extension 1.272 | 40.00, the swing base | How far past the high? | 50.18 |
| Extension 1.618 | 40.00, the swing base | How far past the high? | 52.94 |
| Expansion 100 percent | 44.00, the pullback's end | How big is the next leg? | 52.00 |
| Failed pullback | None, projection withdrawn | Is the pullback over? | No, close at 42.90 |
The trade: long at 44.50 on the confirmed turn, stop at 43.40, risk of 1.10 per share. First target 47.80, just under the old high, pays 3.30, roughly 3.0 times the risk. That fraction comes off. The runner rides toward 52.00, the equal-size repeat of the first leg measured from 44.00.
Notice the cluster near the top. The extension's 1.618 line at 52.94 and the expansion's 52.00 sit within a point of each other. When two independent measurements from two different anchors land in the same zone, that zone carries more weight than either line alone.
The failed version matters as much as the winning one. Suppose price never turns at 44.00 and instead closes at 42.90, below the 61.8 retracement at 43.06. The pullback has not ended. There is no anchor, so there is no 52.00. The trader takes the small loss or never enters, and the projection goes back in the drawer until a new turn confirms.
The discipline is mechanical. Confirm the turn, measure from the turn, scale out at the old high, let the runner test the repeat. Any step skipped turns the method into a hope with a target attached.
Expansion Questions, Answered
What is a fibonacci expansion?
A fibonacci expansion is a projection of the next impulse leg measured from where the pullback ended, most often sized at 100 percent of the prior leg. A leg of 8.00 points that pulls back to 44.00 projects a target at 52.00. It answers how big the leg starting at the turn should be.
How is a fibonacci expansion different from an extension?
The anchor differs, and so does the question. The extension anchors at the original swing's base and multiplies the full leg by a ratio above one, asking how far price runs beyond the old extreme. The expansion anchors at the pullback's end and asks how large the next leg should be. On the same swing, the two tools produce different numbers.
How do you calculate a fibonacci expansion?
Take the prior leg's height, multiply by the chosen ratio, and add the result to the pullback's low for an uptrend. An 8.00-point leg at 100 percent from a pullback low of 44.00 gives 44.00 plus 8.00, which is 52.00. For a downtrend, subtract the projected size from the pullback's high instead.
What is a measured move in trading?
A measured move is the equal-size repeat: the second leg projected to match the first leg's height, counted from where the pullback ended. The price action canon documents the pattern as a core market behavior, since the crowd that drove the first leg tends to drive a similar second one. It is the 100 percent expansion under its older name.
The projection toolkit is now complete: retracements for entries, extensions for targets past the extreme, and the expansion for the repeat leg from the turn. The next lesson steps into the workflow that runs these same targets on any timeframe, from the five-minute chart to the weekly, without changing a single rule.