What Is Price Action in Trading
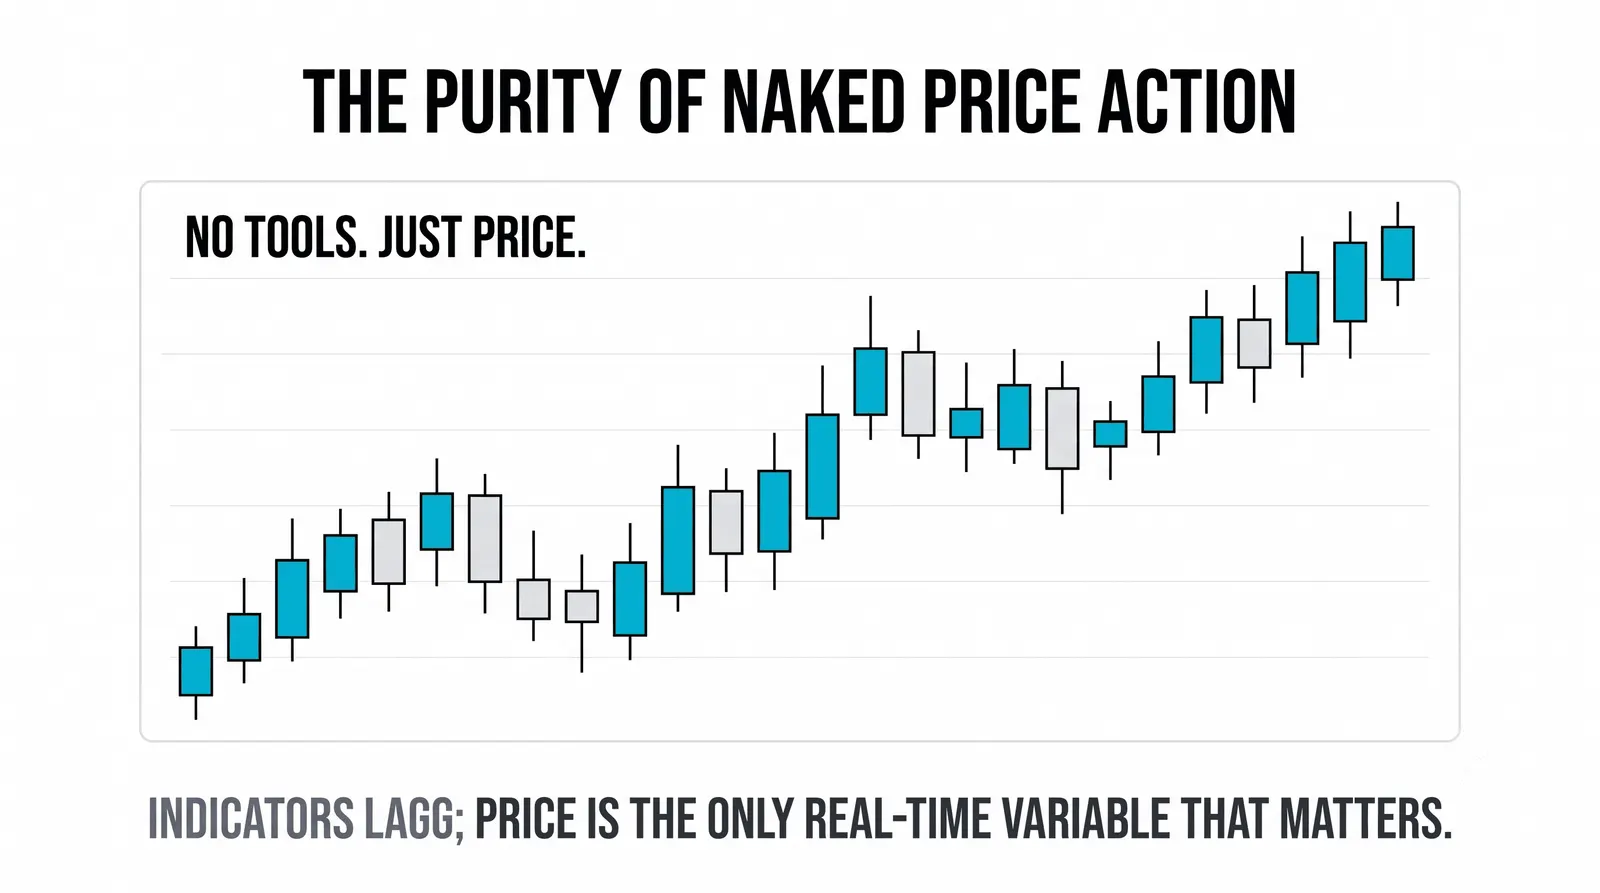
Price action is reading what the price itself did, the candles, the swings, the levels, instead of what an indicator computed about it. When you study price action, you work with the raw record: where price opened, where it closed, how far it reached, and where it got turned away. Nothing is averaged, smoothed, or transformed. In trading, it is the rawest way to read what a market actually did.

Think of it like reading a game's box score instead of a commentator's summary. The numbers are the game. Everything else is someone's interpretation of the numbers.
This does not make indicators useless. It means price action traders prefer to start from the source and add tools only when those tools answer a specific question. If the four candle numbers are still new, start with reading a basic price chart, then come back.
What Actually Counts as Price Action
Four things make up most of what a price action trader reads on a chart.
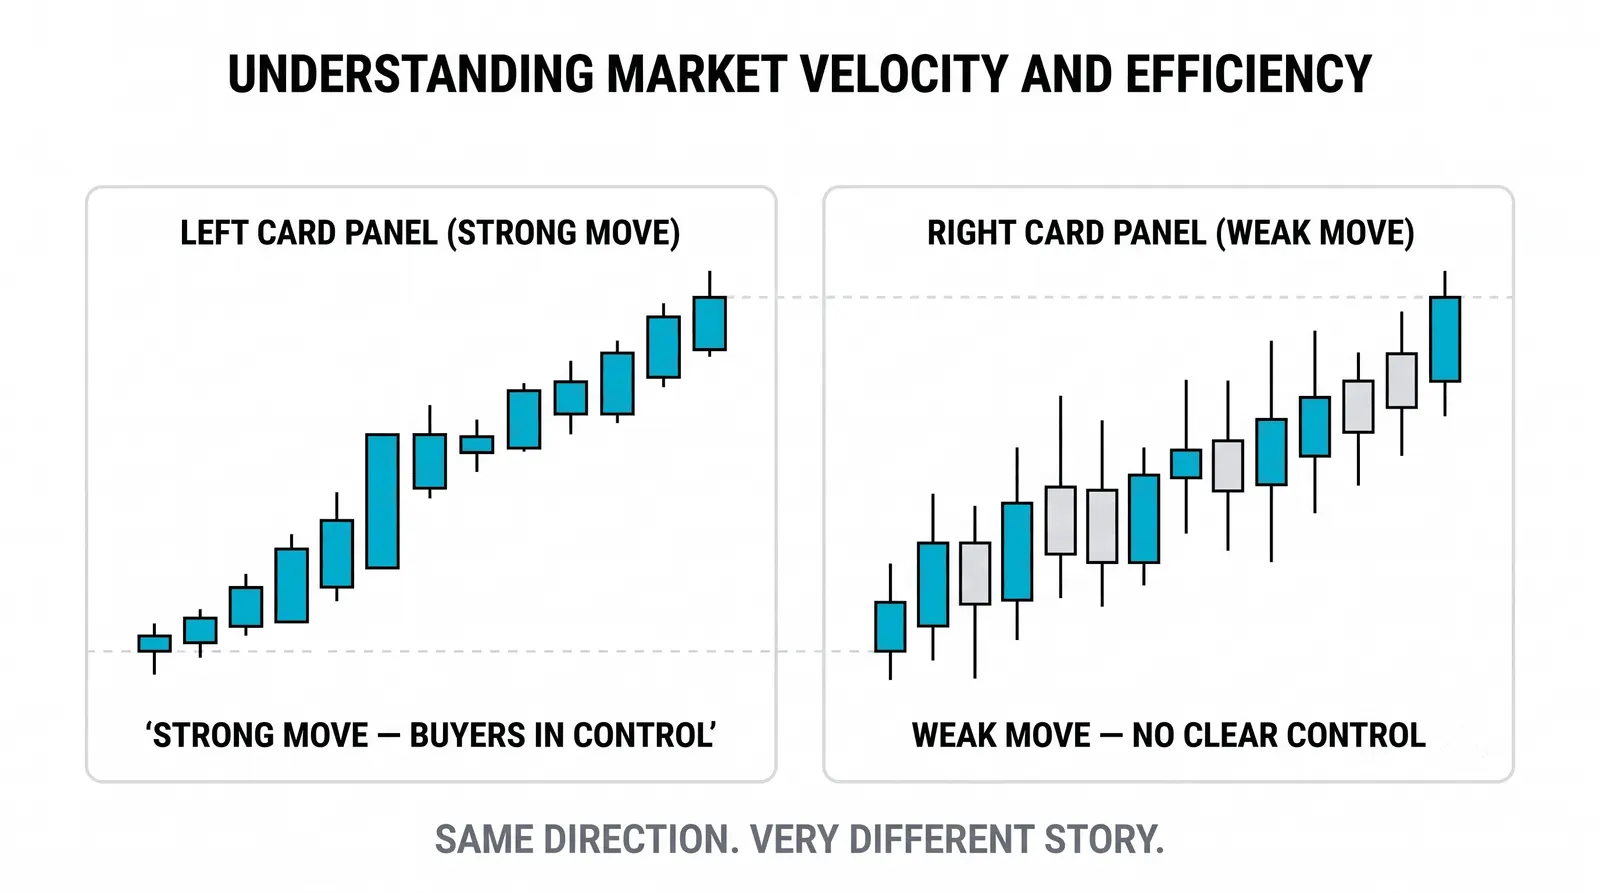
- Candles. Each candle shows four numbers: open, high, low, close. A long body means price traveled far in one direction. A small body means indecision.
- Swing highs and lows. The turning points where price reversed. A series of higher highs and higher lows is an uptrend. Lower highs and lower lows is a downtrend, the structure behind what a trend is.
- Levels. Prices where the market repeatedly stopped or reversed. These are zones of memory, places where buyers or sellers showed up before.
- Rejection wicks. Long wicks show where price probed and got pushed back. A long upper wick means buyers tried higher and sellers said no.
Notice what is missing: formulas. Every one of these is visible directly on the chart with no calculation at all.
Why Traders Trust It
Price is the rawest record of agreement between buyers and sellers. Every print on the chart is a moment where someone bought and someone sold at the same number. That is real information, not an estimate.
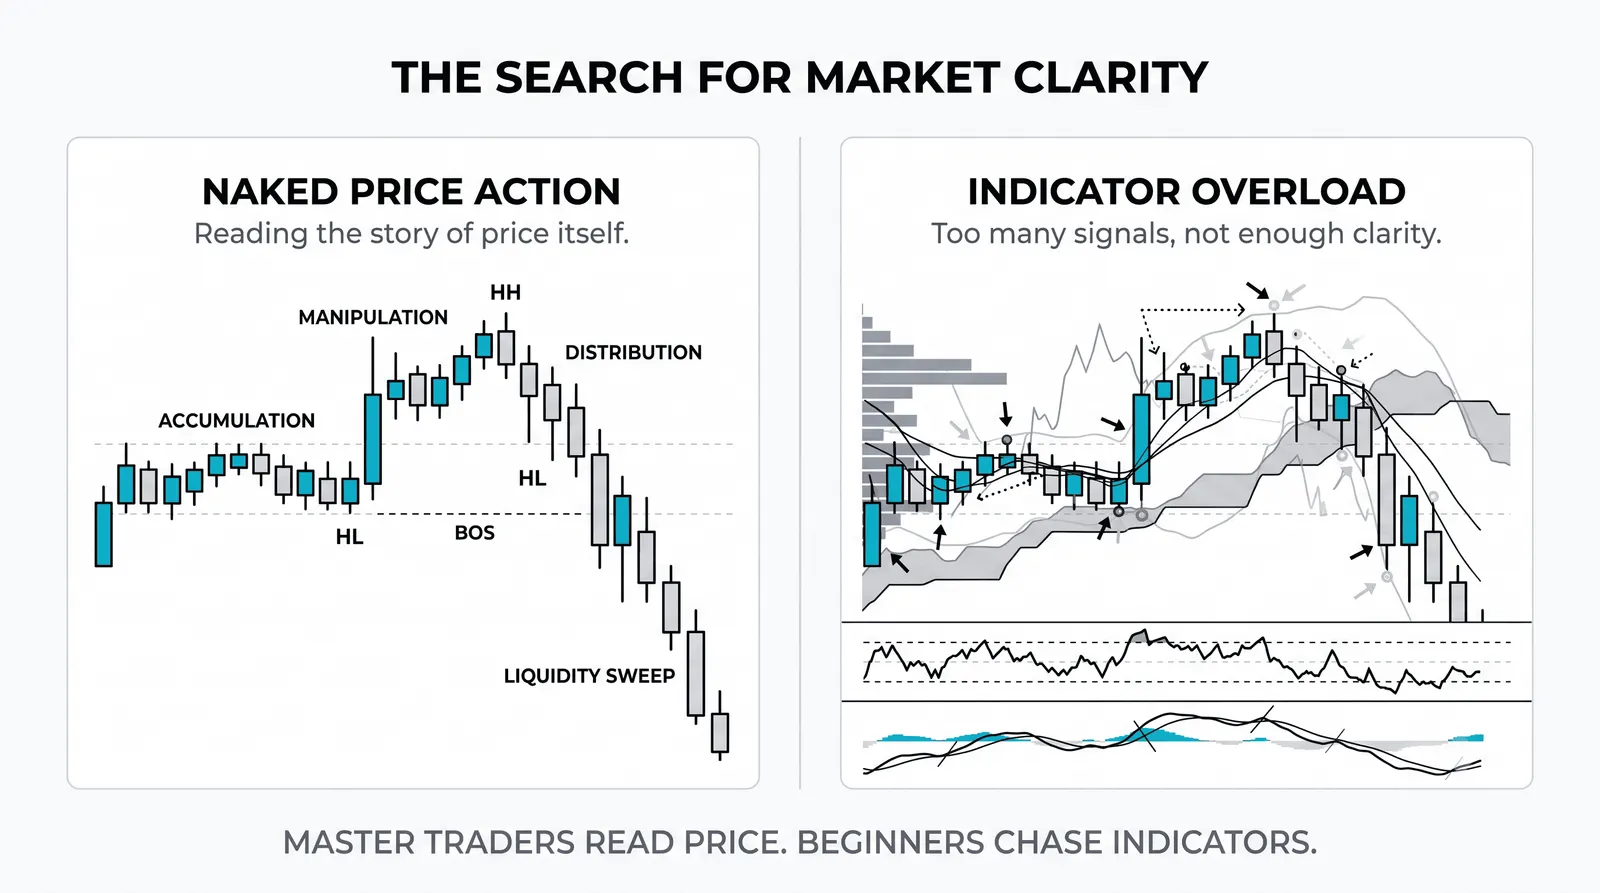
Indicators take that record and transform it. A moving average smooths it. RSI compresses it into a 0 to 100 scale. Each transformation adds a lag and a set of assumptions. Price action skips the middleman.
There is also a practical benefit: simplicity. When your read on the market comes from the chart itself, you can explain your reasoning in plain words. "Price failed at 100 three times" is a statement anyone can check. That keeps you honest.
None of this makes price action magic. It makes it direct.
What Price Action Cannot Tell You
Price action shows you what happened. It cannot tell you why it happened. A rejection at 100 might be a fund unloading a position, a news event, or simple profit-taking. The chart looks the same either way.
It also offers no guarantees. A level that held three times can break on the fourth. A clean uptrend can reverse on one headline. Price action describes behavior, and behavior changes.
Be skeptical of anyone who sells price action as a way to predict the future. It is a way to read the present clearly and plan for a few likely scenarios. That is a real edge, but it is a modest one.
A Worked Example: The 100 Level
Say a stock rallies to 100 and pulls back to 96. A week later it climbs to 100 again and falls back to 97. A third attempt reaches 100 and stalls.
Each test is information. Sellers are defending 100. You do not know who they are or why, but you can see their footprints: three rejections at the same price.
Now you can build a plan around two scenarios. If price reaches 100 a fourth time and gets rejected again, the level is still working, and a short with a stop just above 100 has a clear logic. If price closes above 100, say at 101, the sellers may be done, and a long with a stop back below 100 has its own clear logic.
Either way, your risk is defined by the level itself. That is the practical gift of price action: the chart tells you where you are wrong before you enter.
Reading the Limits: A Side-by-Side View
| What Price Action Tells You | What It Cannot Tell You |
|---|---|
| Where buyers and sellers agreed on price | Why they agreed at that price |
| Where price was rejected or accepted | Whether a level will hold next time |
| The current trend and its turning points | When the trend will end |
| Where your trade idea is proven wrong | Whether the trade will win |
| How strong or weak a move looks | What news or order flow caused it |
Keep this split in mind and you will ask price action for what it can actually deliver: structure, context, and clear invalidation points.
How to Practice Reading It
The fastest way to build this skill is to describe charts out loud in plain sentences. Open a chart, hide everything except the candles, and narrate what you see.
"Price made a higher high, then pulled back and held above the last low. Buyers stepped in at 50 twice. This candle closed near its high after a long lower wick."
Do this for ten minutes a day. No trades, no predictions, just description. You are training your eye to see structure before you ask it to see opportunity.
A few rules for the practice:
- Use only facts you can point to on the chart. No "it looks like it wants to go up."
- Mark swing highs and lows by hand before checking if you were right.
- Review the same chart a week later and describe it again. Compare.
Most beginners skip this and jump straight to patterns. That is backwards. Patterns are just shorthand for the descriptions you should already be able to make.
Questions About Price Action
Is price action better than indicators?
Neither is better; they do different jobs. Price action reads the raw record, indicators summarize it. Many experienced traders read price action first, then use one or two indicators to confirm or time entries. The mistake is stacking five indicators and never learning to read the chart underneath them. The full comparison lives in price action vs indicators.
Do I need to memorize candlestick patterns?
No. Learn to read the four numbers first: open, high, low, close. Once you can look at any candle and say who won, how far price traveled, and where it was rejected, most named patterns become obvious. A "shooting star" is just a candle where buyers pushed up and sellers slammed it back down. The name is optional; the reading is not.
Does price action work in all markets?
Yes, in any market with honest price data. Stocks, forex, futures, and crypto all produce candles, swings, and levels. Thin or manipulated markets are the exception, because the prints there do not reflect genuine agreement between many buyers and sellers. Stick to liquid markets while you learn.
How long until reading price action feels natural?
Expect a few weeks of deliberate daily description, not months of memorizing. Traders who narrate charts for ten minutes a day usually start seeing structure automatically within a month or two. Traders who only memorize pattern names often stay stuck for years, because they learned labels instead of reading.
Your next step: pick one liquid market, open a clean daily chart, and spend this week marking swing highs, swing lows, and the two most obvious levels. Describe what you see out loud before you even think about trading it.