Position Trading
Position trading is the longest active trading style: you hold positions for weeks to months, ride the primary trend, and deliberately ignore almost everything that happens in between. It sits at the far end of the spectrum from day trading, past swing trading, and one step short of investing. The difference is that you still trade. You enter on evidence, you exit on evidence, and in between you mostly do nothing.

A position trader books the flight, not the turbulence.
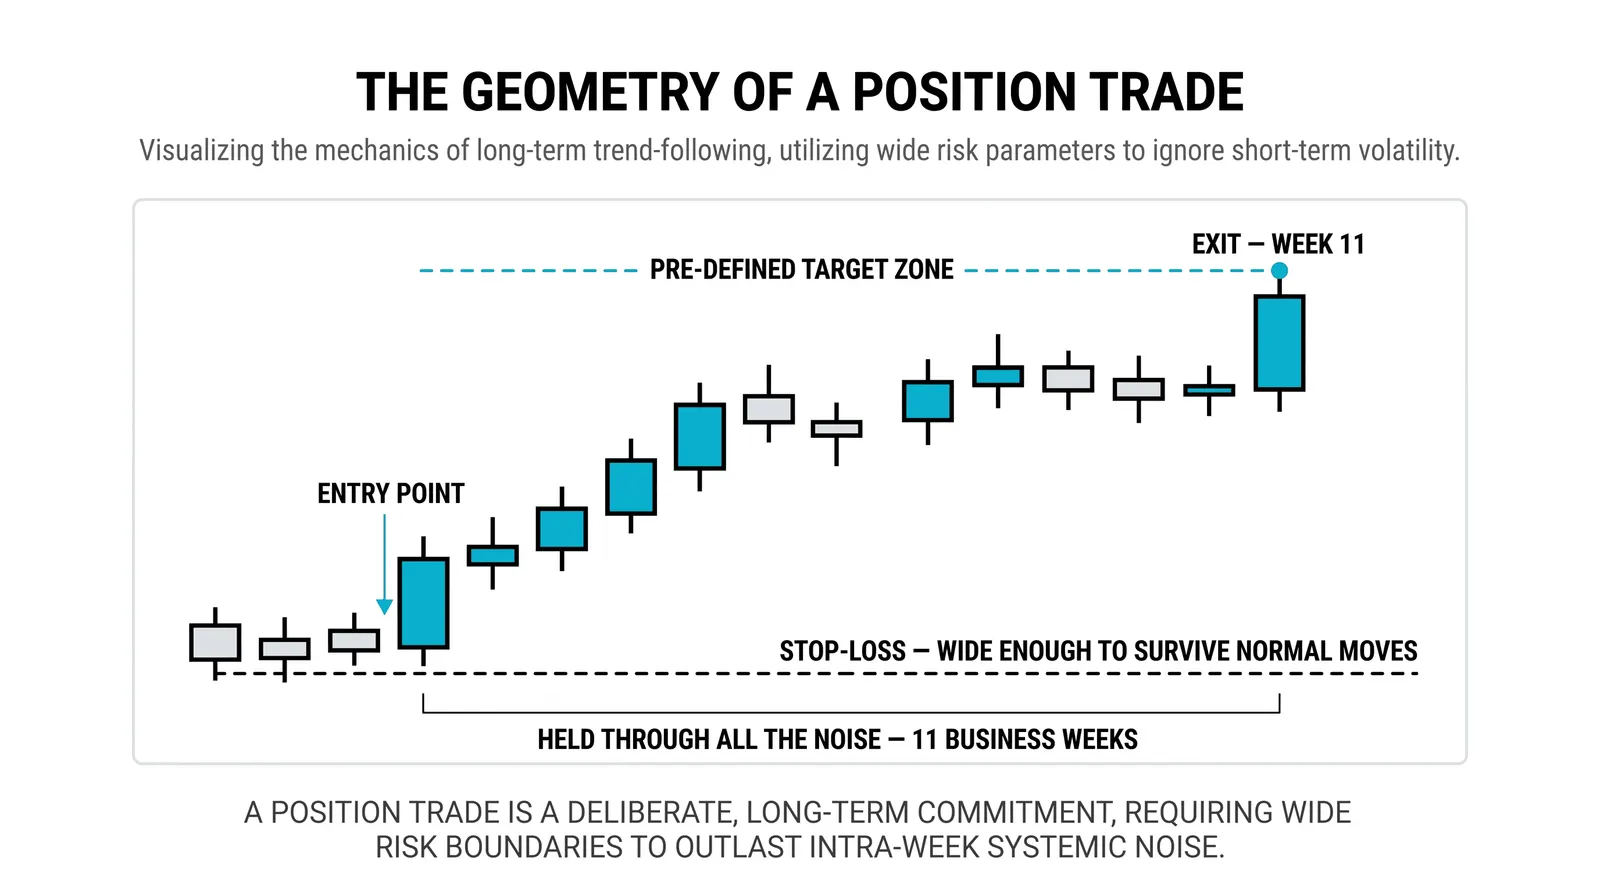
What a Position Trade Actually Is
A position trade is a bet on the primary trend of a market, built from slow evidence. You work from weekly charts, major support and resistance levels, and the primary trend described in Dow Theory, and the broader backdrop: interest rates, sector strength, the direction of the overall market. You are not reading yesterday's candle. You are reading the last two years.
The trade is the trend itself, not a moment inside it. A pullback that terrifies a swing trader is background noise to you. A news headline that moves the price 3 percent in a day barely registers on a weekly chart. Your job is to identify a market that has turned, or is turning, and then stay with it until the evidence says the turn is over.
That means very few positions. Many position traders hold three to eight trades at a time, and some hold fewer. Each one is chosen carefully, because each one is meant to carry a meaningful part of your return for the year. You are not spraying orders at the market. You are placing a small number of large, patient bets.
How It Differs From Investing
From the outside, a position trade and an investment can look identical. Both sit in an account for months. The difference is what happens in your head, and what happens at the exit.
An investor buys the business. If the price drops 30 percent but the company is still executing, the investor may buy more. Price is almost an inconvenience. The thesis lives in earnings, products, and management, and it can take years to play out.
A position trader holds price with a plan. You have a stop. You have exit conditions tied to the trend itself: a broken trendline on the weekly chart, a major level lost, a sequence of lower highs where higher highs used to be. When the trend evidence fails, you leave, even if the company is wonderful. You are not married to the asset. You are renting the move.
This distinction matters because it changes how you size, where you put your stop, and what you allow yourself to feel when the trade goes against you.
The Emotional Job Description
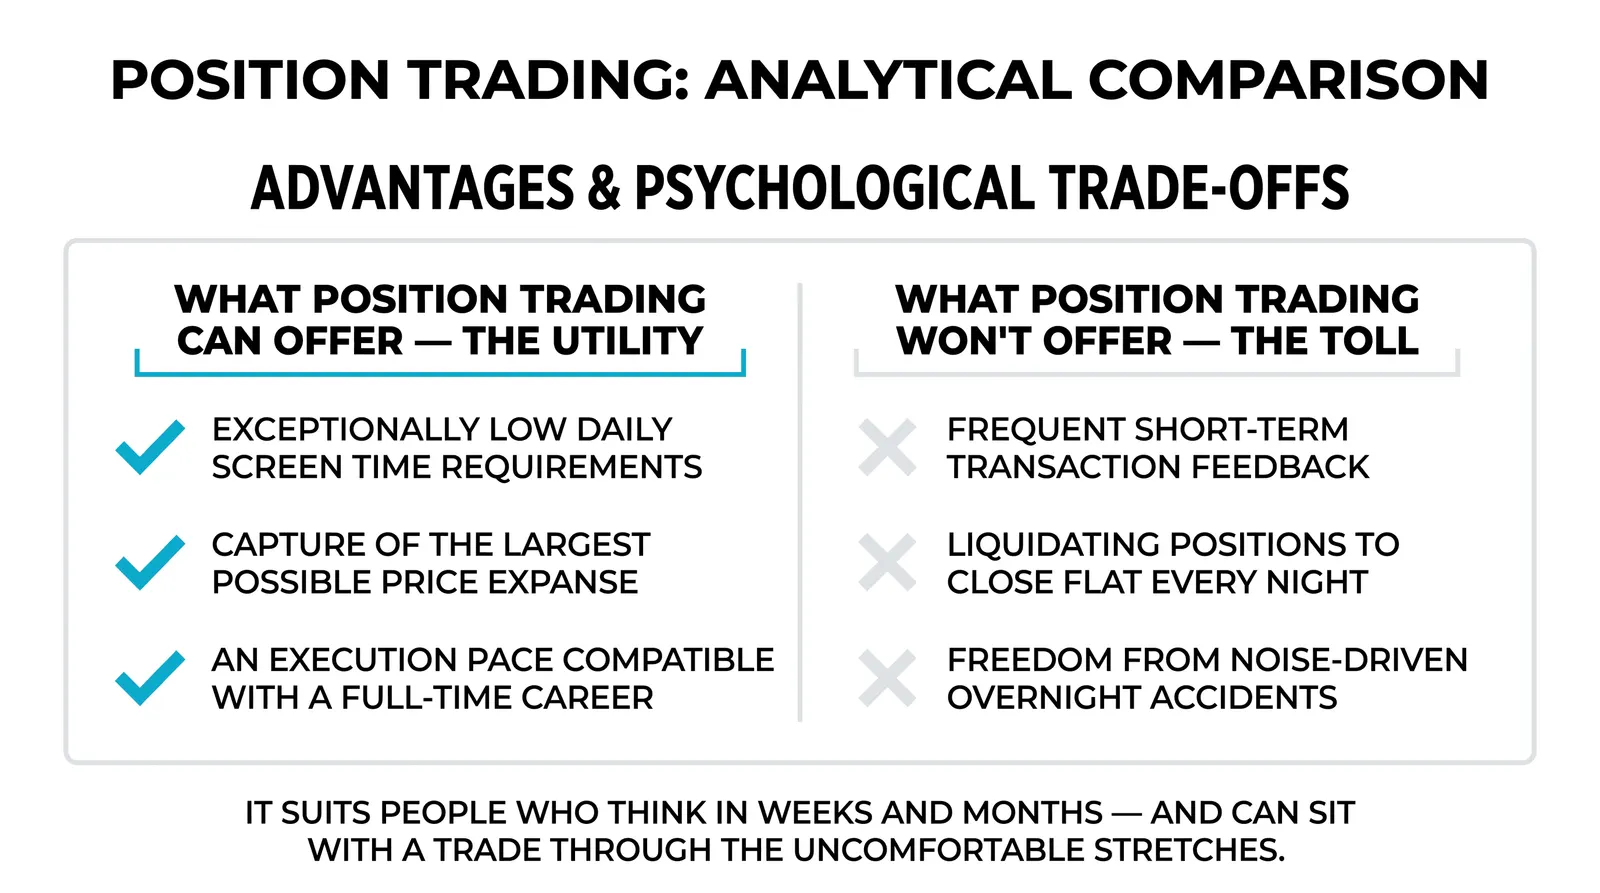
The core skill of position trading is doing nothing well. That sounds easy. It is not.
You will sit through pullbacks that feel like endings. A trade up 25 percent will retrace to up 8 percent, and every instinct you have will scream that the move is over. Sometimes it is. Usually it is not, and the traders who survive are the ones who let their exit rules decide instead of their nerves.
You will also give back open profit on the way out. Trends rarely ring a bell at the top. By the time the weekly structure breaks and your exit triggers, the price has usually fallen well off its high. Watching 40 percent of your open gain evaporate before you sell is not a failure of the method. It is the cost of the method. Traders who cannot accept that cost end up selling early, and selling early is how position traders turn great trades into mediocre ones.
Doing nothing is a skill, and most people never learn it.
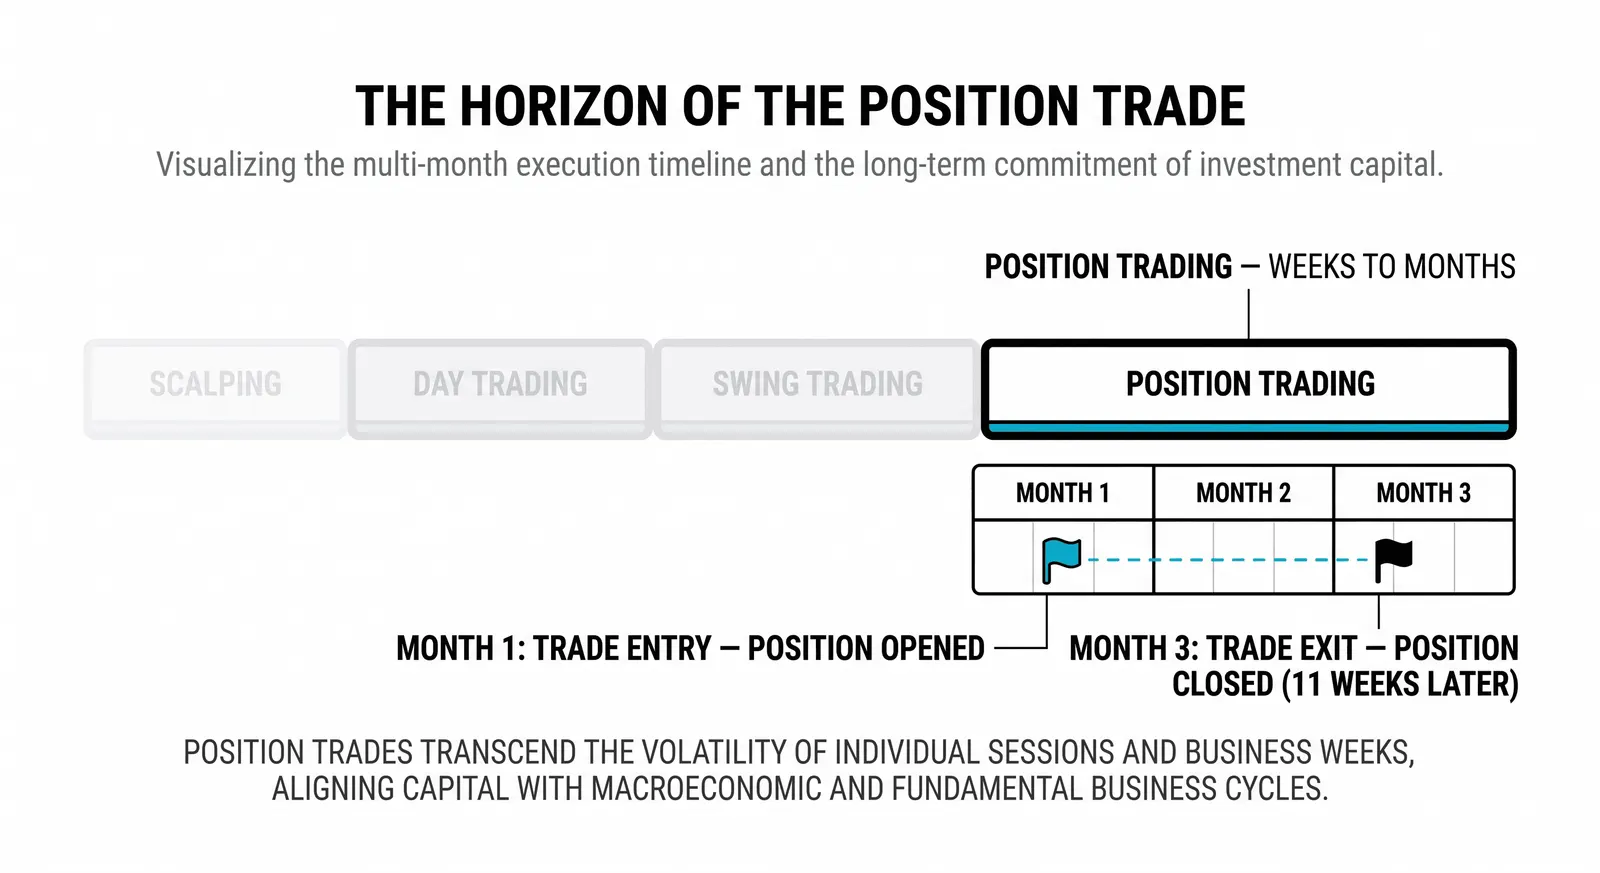
A Worked Example
Here is a hypothetical trade with round numbers. Nothing about it is a promise; it is an illustration of the rhythm.
A market bottoms at 100 after a long decline and starts grinding higher. You wait for confirmation: a higher low, a break above a major level, a weekly close that tells you the trend has turned. You enter at 104. Your stop sits under 96, below the structure that would prove you wrong. Your risk is 8 points per unit.
Then you wait. For eight months the market climbs, with three pullbacks along the way, one of them deep enough to hurt. You add nothing. You adjust nothing. You check the weekly chart once a week and go back to your life.
In month eight, the market makes a lower high, then breaks a major support level on the weekly chart. The trend structure has failed. You exit near 155. That is 51 points gained against 8 points risked, from three decisions in eight months: enter, hold, exit. Every week in between demanded restraint, not action.
What It Demands From You
Wide stops change your math. If your stop is 8 to 15 percent away instead of 1 or 2 percent, your position size must shrink to keep the same dollar risk. Many new traders see the small size and feel like the trade hardly counts. It counts. A small position in a big trend beats a big position in a small move.
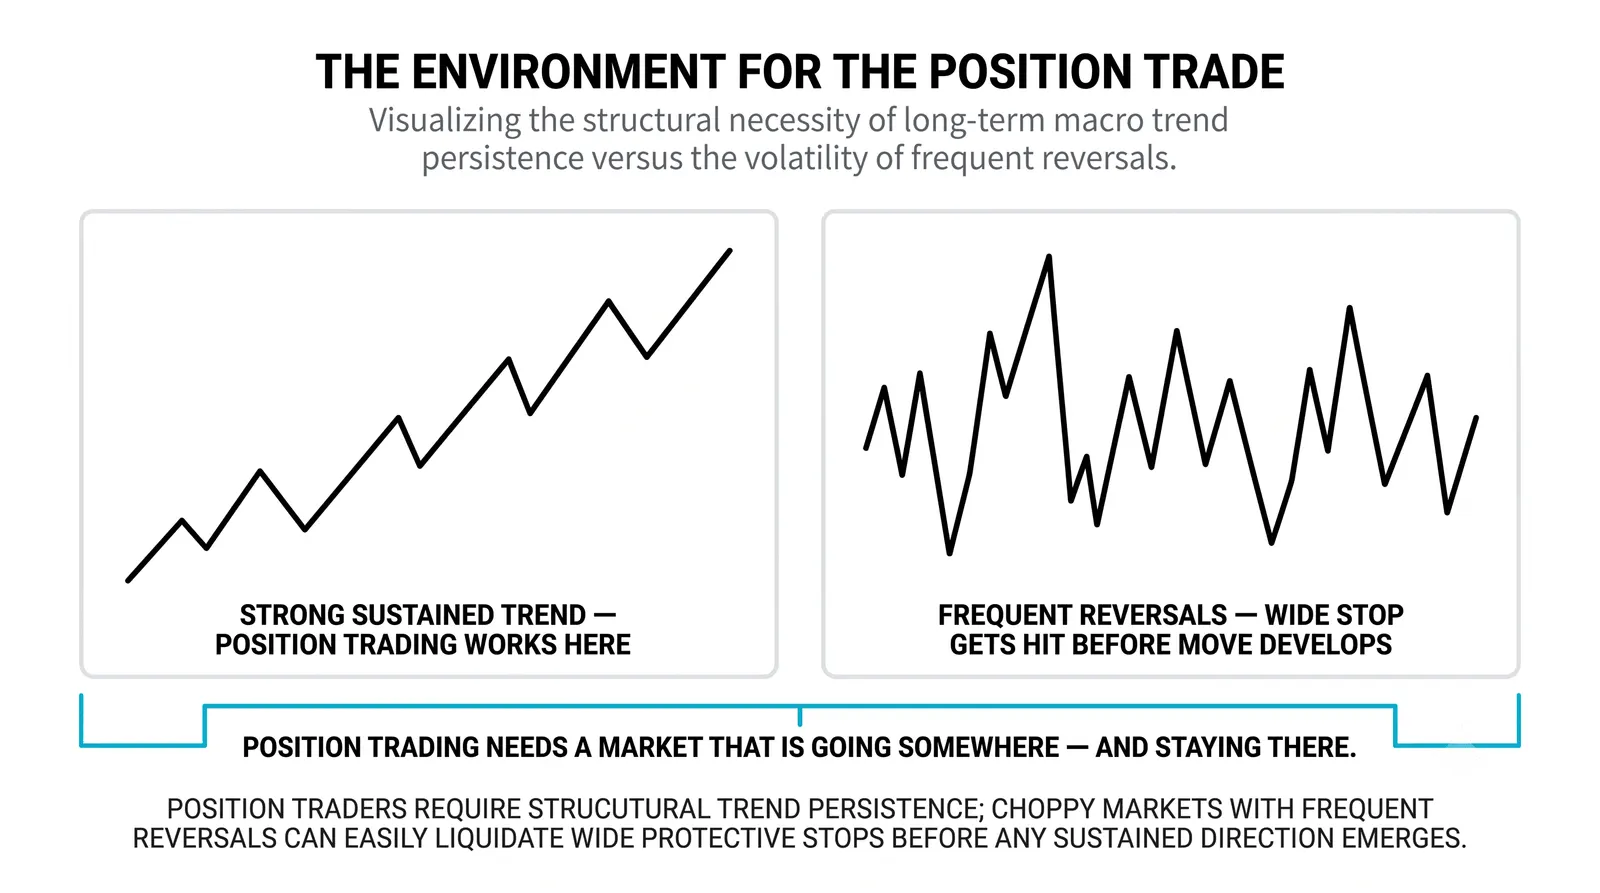
Beyond sizing, the style asks for a specific temperament:
- Patience as a daily practice. You will do nothing for weeks, and that inactivity is the work.
- Tolerance for open-profit drawdowns. Giving back a chunk of unrealized gains before exiting is normal, not a mistake.
- Comfort with few decisions. If you need constant action, this style will push you into fiddling, and fiddling destroys position trades.
- Trust in slow evidence. Weekly charts and major levels, not headlines and hourly candles.
Position Trading vs Swing Trading vs Investing
The three approaches overlap, but they differ in holding period, evidence, and how the exit works.
| Position Trading | Swing Trading | Investing | |
|---|---|---|---|
| Typical holding | Weeks to months | Days to weeks | Years |
| Main evidence | Weekly charts, major levels, primary trend | Daily charts, swings within the trend | Business fundamentals, earnings, valuation |
| Exit style | Trend structure breaks; predefined stop | Target hit or swing fails; tight stop | Thesis broken; price often ignored |
| Screen time | Weekly check-ins | Daily monitoring | Quarterly or less |
None of these is superior. They are different jobs with different demands, and the right one is the one whose demands you can actually meet.
Questions About Position Trading
Is position trading just investing?
No. A position trader exits when the trend evidence fails, even if the underlying asset is fundamentally strong. An investor can hold through a 50 percent decline because the thesis is about the business, not the price. The position trader's thesis is the price trend itself, and when that thesis breaks, the trade is over.
How wide should position stops be?
Wide enough to sit beyond normal trend noise, which often means 8 to 15 percent or more, placed under a structural level rather than at an arbitrary percentage. The stop belongs where the trade idea is proven wrong, not where the loss feels comfortable. Because the stop is wide, position size shrinks to keep dollar risk constant.
Which timeframes does it use?
Weekly charts do the heavy lifting, with monthly charts for context and daily charts only for fine-tuning entries and exits. Anything faster than the daily chart is mostly noise for this style and tends to provoke decisions you should not be making.
How many positions should I hold at once?
Most position traders hold somewhere between three and eight. Fewer than three concentrates risk in single ideas; more than eight usually means you are diluting your best evidence with mediocre setups. The right number is the one where every position is there for a reason you can state in one sentence.
If the slow rhythm of this style appeals to you, the natural next step is learning how to read trend structure on weekly charts: higher highs and higher lows, major levels, and the signals that a primary trend is ending. That is where position trades are born, and where they are properly closed.