The Chaikin Money Flow Indicator, Explained
Chaikin Money Flow asks one question for twenty bars in a row: when this market traded, did the fills land near the highs or near the lows? The answer is a single oscillator line, and the indicator built on the idea is Chaikin Money Flow, from work Marc Chaikin spent a career developing. A close in the top of a bar's range means buyers won that bar's auction; a close at the bottom means sellers did. Weigh each bar's outcome by its volume, average the results over a window, and you get a pressure gauge that reads from minus 1 to plus 1.

The mental picture is a toll booth counting traffic in both directions. Every bar sends cars through two gates: one gate counts buying pressure, the other selling pressure. The booth does not care how many cars total passed, only the net. Twenty bars of net counts, divided by total traffic, and the sign of the result tells you which direction the money has been leaning. For the sibling tools that ask related questions, see the Money Flow Index lesson and the On Balance Volume lesson; this one owns the close-location idea.
The raw input behind all three is volume itself, the count of how many units actually traded. Chaikin's contribution was noticing that volume means different things depending on where the price finished, so he measured the finish.
The Multiplier: Where the Close Lands
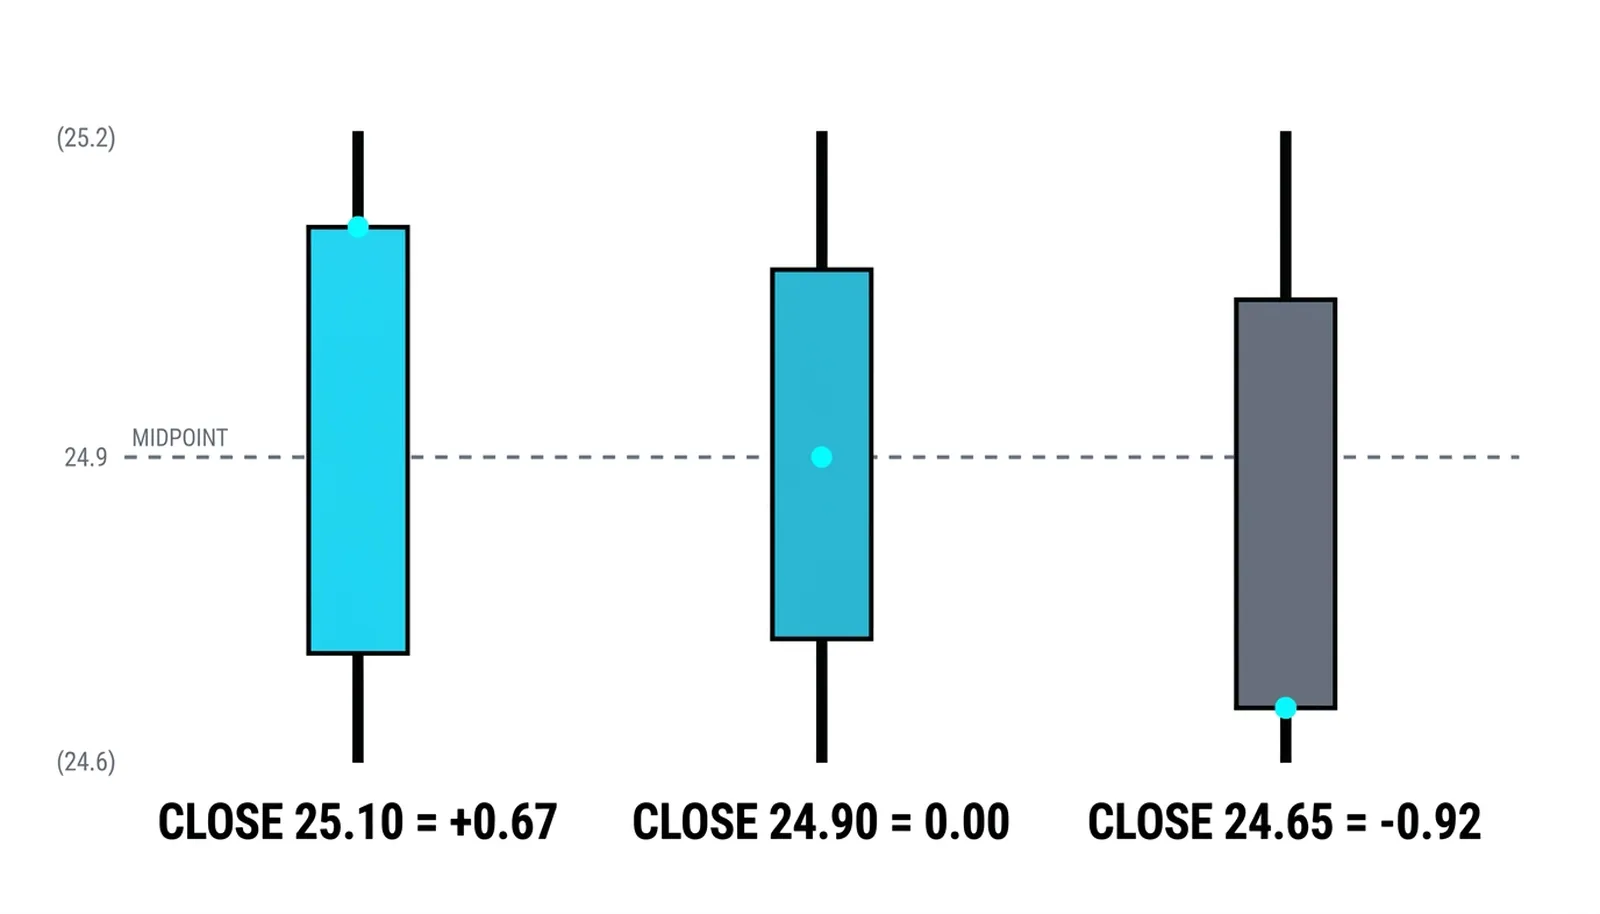
Every bar gets scored by a multiplier that runs from minus 1 to plus 1. The formula: take the distance from the low to the close, subtract the distance from the close to the high, and divide by the full range.
multiplier = ((close − low) − (high − close)) ÷ (high − low)
A worked bar shows the arithmetic. Suppose a bar traded between a low of 24.60 and a high of 25.20, and closed at 25.10. The close sits 0.50 above the low and 0.10 below the high, so the multiplier is (0.50 − 0.10) ÷ 0.60, which is +0.67. Buyers owned that bar. Close the same bar at 24.90, dead middle, and the multiplier is exactly zero: the bar's 0.60 of range traded to no net winner. Close at 24.65 and the multiplier lands near minus 0.92, a bar the sellers dominated.
Chaikin then multiplies each bar's multiplier by its volume. A strong close on two million shares scores roughly twice as much pressure as the same close on one million. That product, close location times participation, is the money flow of the bar.
The chart shows the two regimes back to back. Through the shaded rally the closes hug the highs, the multipliers run near plus 1, and the twenty-bar average climbs over the +0.25 line. The decline flips every close to the lows and drags the reading below minus 0.3. Same market, same volume scale, opposite pressure.
The Twenty-Bar Net: the CMF Formula
The indicator itself is nothing more than the average of those products. Add up the last twenty bars of multiplier-times-volume, divide by the last twenty bars of volume, and plot the result. The formula: CMF = sum of (multiplier × volume) over 20 bars ÷ sum of volume over 20 bars.
Because the reading is a weighted average, it behaves like a share of total trade. A CMF of +0.20 says roughly that one fifth more of the window's volume traded on strong closes than on weak ones, net. The twenty-bar default is the platform convention; the logic works at any window, with shorter windows twitchier and longer ones slower to turn.
| CMF reading | What it says | How traders use it |
|---|---|---|
| Above zero and rising | Buying pressure dominates the window | Confirms uptrends; dips toward zero watched for holds |
| Above +0.25 | Unusually one-sided buying | Marked as an extreme; often coincides with climaxes |
| Crossing through zero | The net flow changed sides | Regime shift signal; strongest when price confirms |
| Below zero and falling | Selling pressure dominates | Confirms downtrends; bounces toward zero watched for rejections |
Reading the Zero Line
In a healthy trend the line lives on its side of zero. An advance carried by real demand keeps closing bars near their highs, so CMF holds above zero for weeks and only kisses the line during pullbacks.
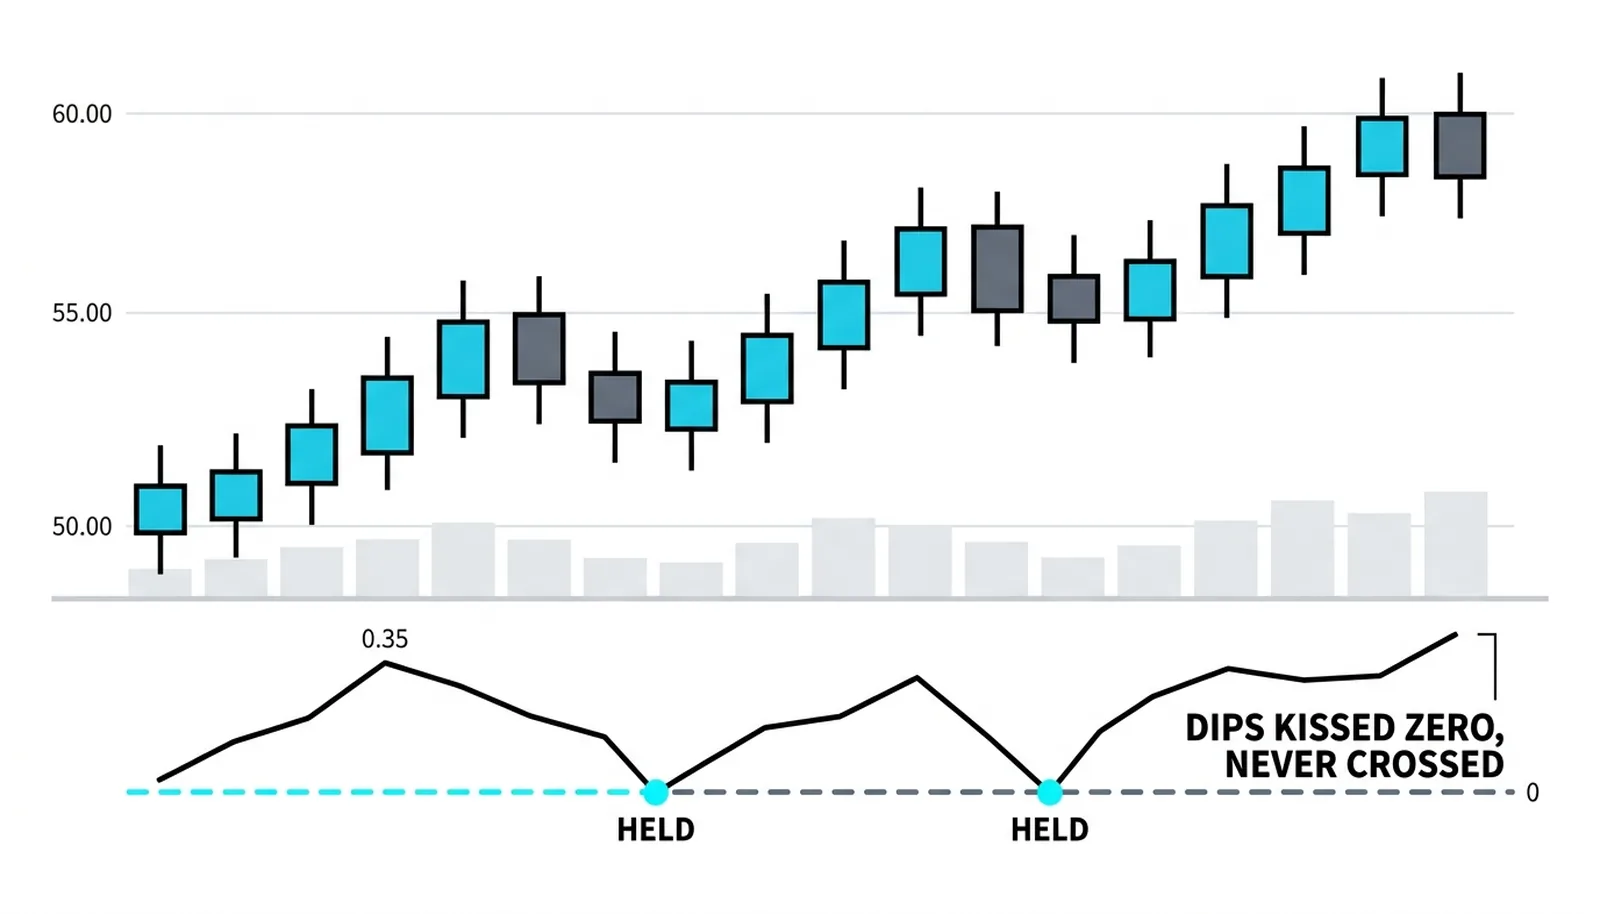
Every dip toward zero in the panel below found buyers before the flow actually flipped negative. That is the confirmation role: the trend and the money flow agree. The zero-line cross matters when it happens against price. A price rally while CMF slips below zero says the closes inside the bars are quietly migrating toward their lows, and the rally is being carried by fewer, weaker advances.
The Extreme That Ends Moves
The reading most worth practice is the extreme. Pushing over +0.25 takes twenty bars of persistent, heavy, strong closes, which is what a buying climax looks like in the data. By the time the oscillator gets there, the easy demand has traded, and the stall that follows is the tell.
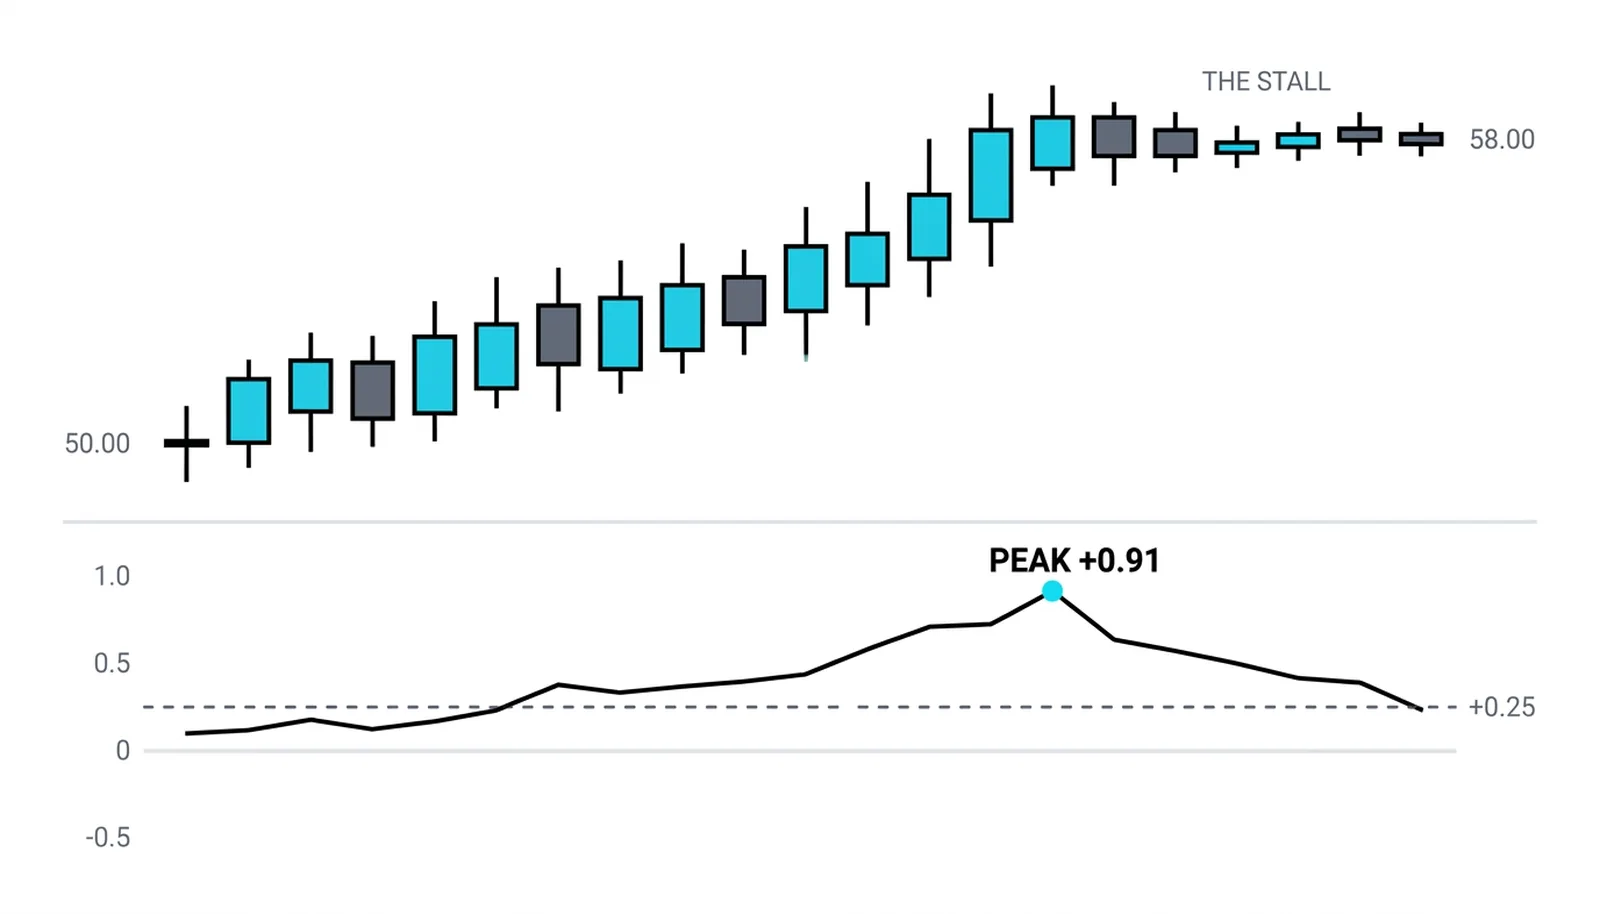
The peak printed +0.91, an extreme reading by any standard, and the price panel beside it stopped rising within bars of that peak. The oscillator did not predict the top with a clock. It showed that buying pressure had been spent at a rate the market could not keep paying, and the flat candles were the receipt.
Chaikin Money Flow, Answered
How is CMF different from MFI?
The math, and only the math differs in spirit. MFI splits each bar's flow into a positive or negative bucket by whether typical price rose, then takes a ratio of the two sums, RSI-style. CMF scores every bar on a minus 1 to plus 1 scale by close location and takes a weighted average. MFI is a ratio of sums; CMF is an average of scores. They often agree, and disagreement between them is itself information.
What does a positive CMF during a downtrend mean?
That closes are landing near bar highs even while price drifts lower, which happens when dips are being bought aggressively and rallies are being sold reluctantly. It is a pressure-versus-price divergence and it resolves when one side gives in, usually with a price signature confirming the flow first.
Should the period be tuned away from 20?
Rarely as a first step. The window sets how many bars of evidence the reading needs; halving it doubles the noise before it doubles the speed. Traders who adjust usually touch the thresholds instead, requiring deeper extremes on faster settings.
CMF closes the volume trio in this course: OBV counts direction, MFI ratios the flows, and CMF averages close locations. Run any two of them and a volume reading stops being a vibe and becomes a cross-examination.