Order Flow Imbalances: Reading Dominance
An order flow imbalance is a price where one side's aggression overwhelmed the other by a wide ratio, measured by comparing the market buys executed at a price against the market sells executed at the same price, and stacked imbalances across several prices are the tape's loudest statement of who is driving. The first lesson of this block defined order flow and delta, the net score of aggression across a whole bar. This lesson owns the per-price read: not how much force hit the bar, but exactly which prices absorbed it and which side won each one.

Think of an arm-wrestling match: the scorekeeper does not guess from faces, they watch the knuckles, and every inch the weaker hand gives tells you which arm is actually doing the pushing. Price ladders work the same way. At each level, someone is hitting the ask and someone is hitting the bid. When one side of that exchange dwarfs the other, the tape is telling you who wants it more, at that exact price, in that exact moment.
What Counts as an Imbalance
The measurement is simple. At each price, your per-bar bid-ask tool shows two numbers: volume bought at the ask and volume sold at the bid. Bought at the ask means a buyer lifted the offer, the aggressive act. Sold at the bid means a seller hit the bid, also aggressive. The imbalance read compares the aggressor against the passive side at the same level.
Most platforms make the comparison diagonally. Buying aggression at one price is compared against selling aggression at the price just below, because that is the true head-to-head: the buyer lifting this offer against the seller hitting the bid one tick down. The exact diagonal convention varies by tool, but the logic is constant. Aggressor versus aggressor, adjacent levels, same moment.
The standard threshold is three to one. When bought volume at a price is triple the sold volume at the comparison level, that price prints a buying imbalance. Triple the other way prints a selling imbalance. Below that ratio, the fight at that price was competitive and the print carries no signal.
A single imbalance is information. A stacked imbalance is a statement. When three or more consecutive prices print the same directional imbalance, the aggression is not a stray order. It is sustained pressure moving through the book. Stacked imbalances are the strongest version of this signal, because one price can be noise but three in a row means someone is paying up repeatedly and nothing is stopping them.
What each side means:
- Buying imbalances show initiators lifting offers faster than sellers can rest size. Demand is outrunning supply at those prices.
- Selling imbalances show the reverse: sellers hitting bids faster than buyers can reload.
- No imbalance means the two-sided auction at that price was balanced, and the price itself tells you little about intent.
Stacked Imbalances and Trade Direction
A stacked imbalance in the direction of your trade is aggression with structure behind it. If price is pushing up out of a base and three consecutive prices print buying imbalances, the move is being driven by market orders, not drift. That is the kind of fuel that carries a trade.
Order flow analysis adds the confirmation layer to the hold-trade checklist: imbalances carry the most weight when per-bar point-of-control levels migrate with them. The point of control is the price inside each bar where the most volume traded. When bar after bar prints its heaviest price higher while stacked buying imbalances keep appearing, the aggression and the volume are agreeing. The push is real and it is being accepted.
When the two disagree, slow down. A stacked buying imbalance followed by bars whose point of control stalls or slides lower means the aggressive buying is being absorbed. Someone is selling into every lift. The imbalance showed you the attack; the migrating point of control tells you whether the attack is gaining ground or dying on the beach.
Use the pair as a filter. Stack in your direction plus migrating point of control: hold, let it work. Stack in your direction plus a flat or opposing point of control: tighten the trade, because the aggression is being met.
False Dominance and Trapped Traders
A large one-sided print is not automatically intent. A huge sell print can be one trader closing a winning long, liquidation rather than attack. The number looks identical on the tape to a seller launching an assault, but the follow-through is completely different, because a liquidation ends when the position is flat. The order flow framework's caution applies here: single large numbers matter only when they repeat in an area. One giant print is an event. Repeated prints at the same prices are a campaign.
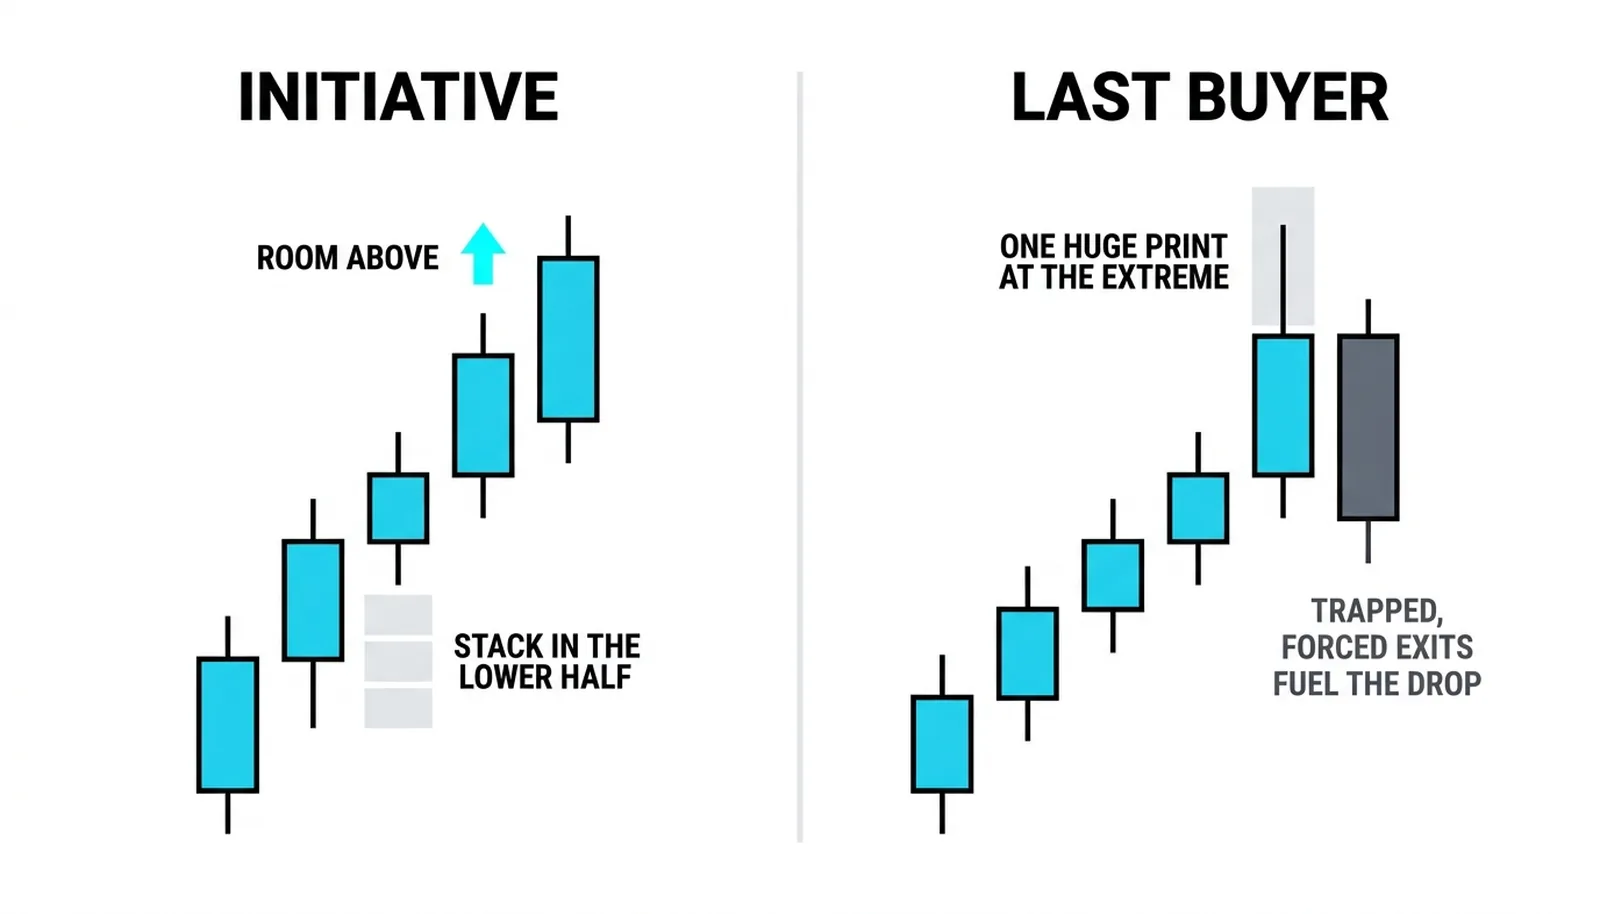
The second honesty beat is the trap. A big buy print wedged at the very top of an advance, instantly met by heavy selling, marks trapped buyers. Those are late longs who chased the high and are now underwater inside the same bar. Their forced exits, sell orders to get out, fuel the drop. Dominance was shown and then punished in the same breath.
This is why the location of the imbalance matters as much as its size. A buying stack in the lower half of a move, with room above, is initiative. A single huge buy print at the extreme high of an extended rally is often the last buyer. The tape gives you both prints in the same format. Context separates them.
Three Prices That Told the Truth
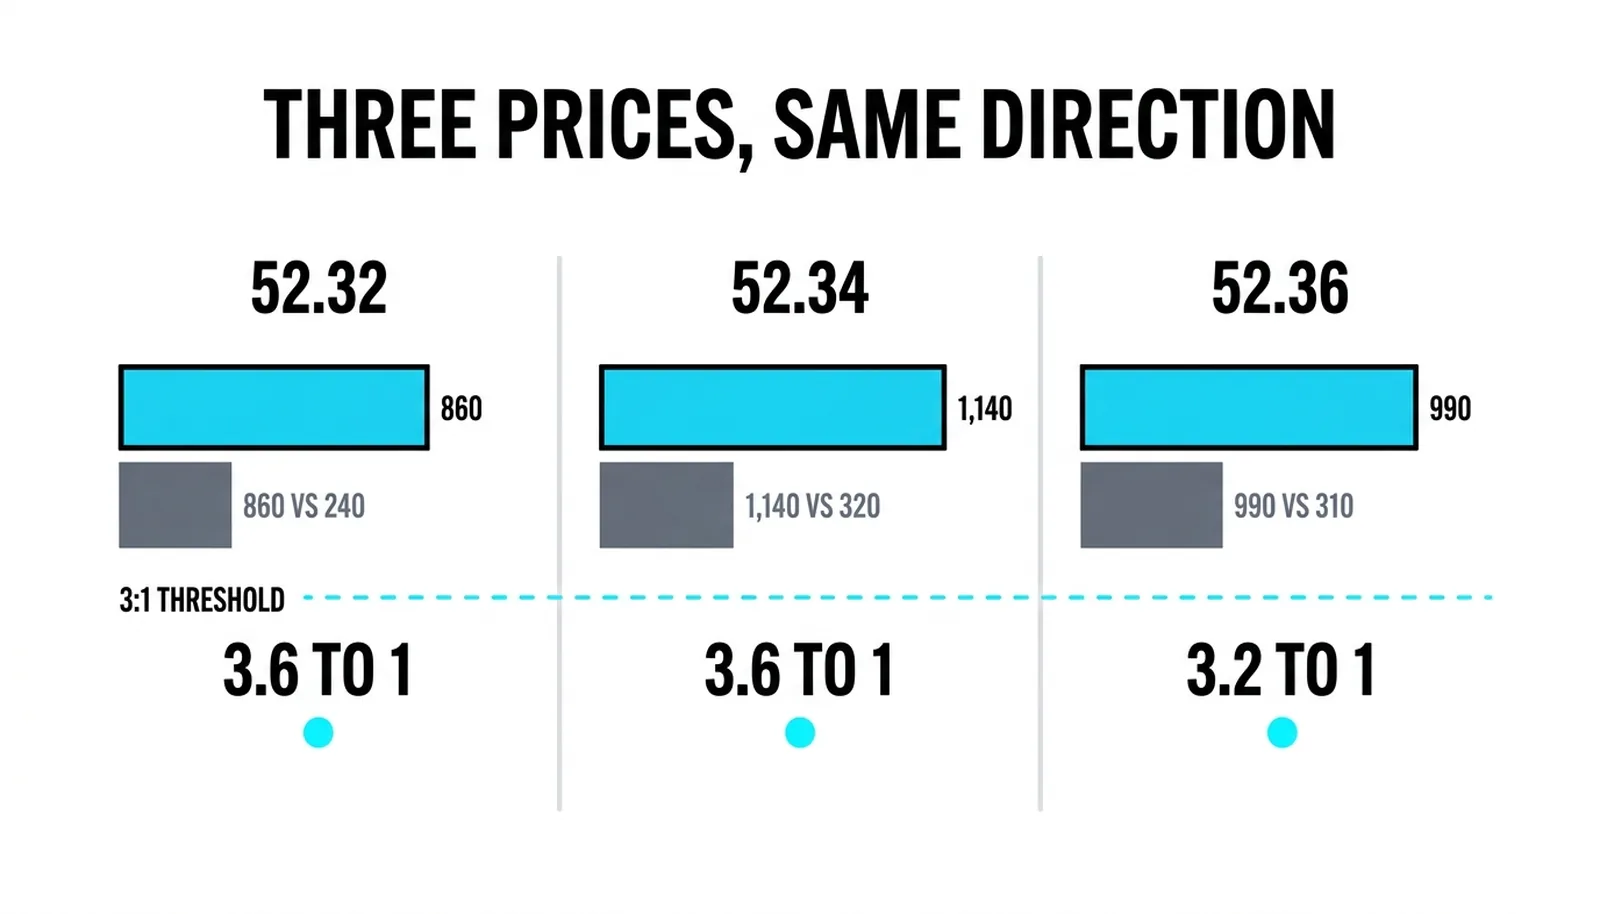
Hypothetical numbers, invented for illustration. A stock rallies through 52.32, 52.34, and 52.36 inside one five-minute bar.
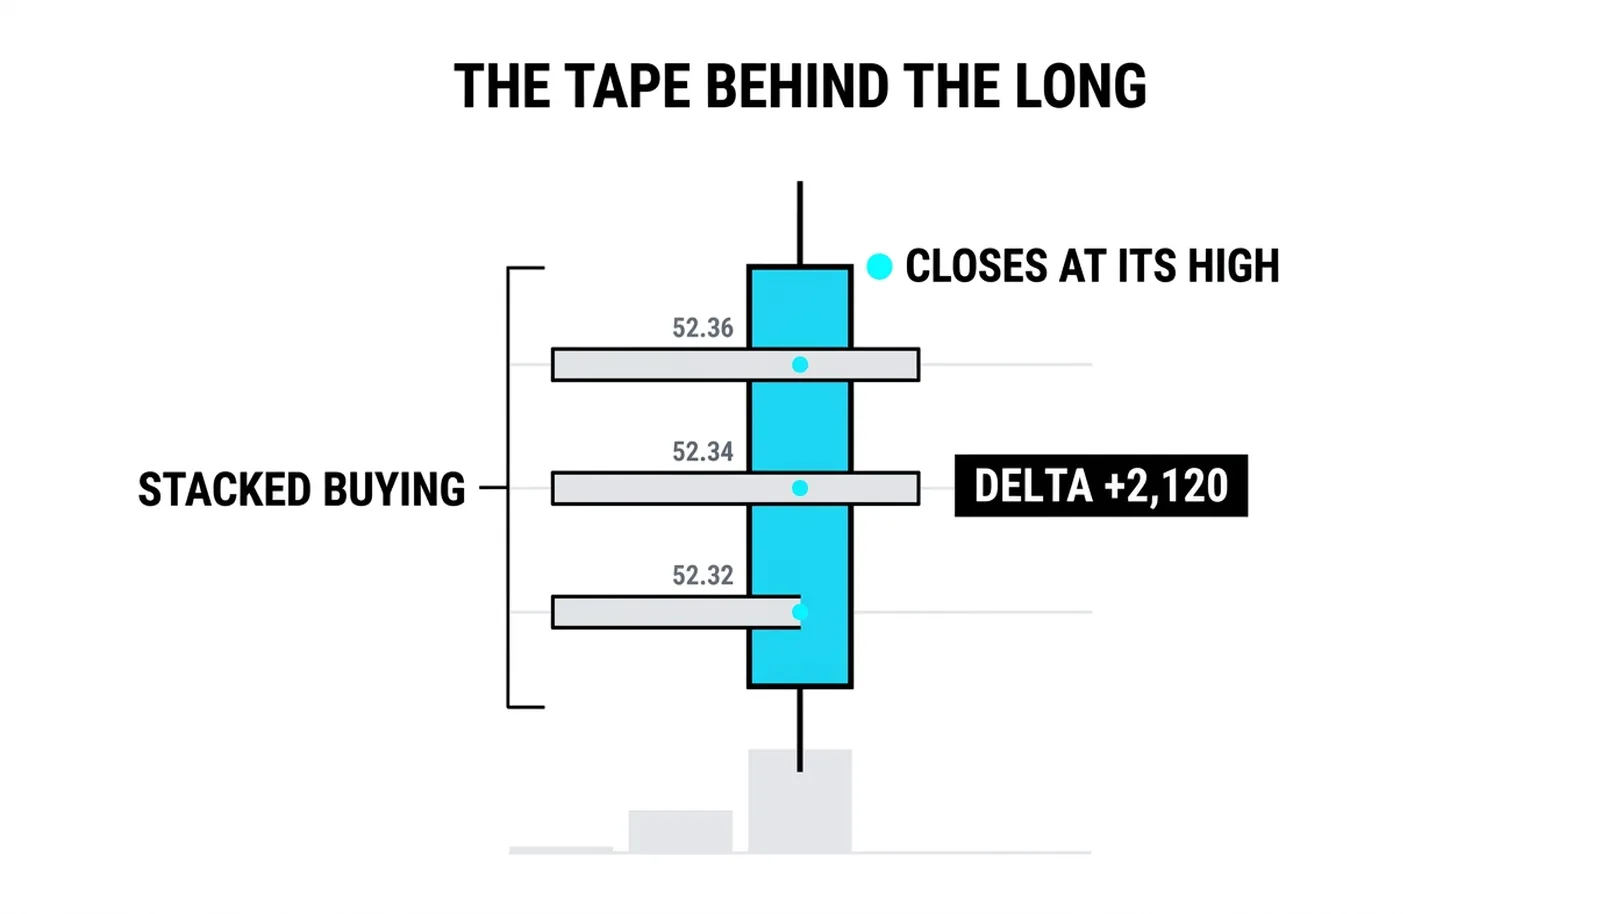
At 52.32, the tape shows 860 shares bought at the ask against 240 sold at the bid. That is 3.6 to 1, a buying imbalance. At 52.34, it is 1,140 against 320, again 3.6 to 1. At 52.36, it is 990 against 310, a 3.2 to 1 ratio. Three consecutive prices, all above the three-to-one threshold, all in the same direction. That is a stacked buying imbalance.
The bar's delta prints positive 2,120 and the bar closes at its high. The read: aggressive buyers lifted offers through three prices, nothing pushed back, and the bar confirmed the aggression by closing at its peak. A long taken on the stack has the tape behind it.
The hold decision comes from the next bars. Each subsequent bar's heaviest traded price, its point of control, keeps migrating upward. Aggression and acceptance are agreeing, so the long rides.
Now the counter-case. On the next rally, a single 700-lot buy prints at 53.10 at the very top of the bar. It is instantly answered by heavy selling and the bar closes well off its high. That print was not initiative. It was the last group of late longs, now trapped at the high, and their exits feed the decline. The long comes off.
| Pattern | What the tape shows | The read | The trap |
|---|---|---|---|
| Single imbalance | One price above 3:1 | Local aggression, worth noting | Could be one order closing a position |
| Stacked imbalance | 3+ consecutive prices, same direction | Sustained initiative, strongest signal | Weak if point of control refuses to follow |
| Stack plus migrating point of control | Aggression and heaviest volume moving together | Confirmed drive, hold the trade | Low trap risk while both agree |
| Lone large print at the extreme | Big buy at the bar's top, instantly sold into | Trapped buyers, dominance punished | Their forced exits accelerate the reversal |
Order Flow Imbalances, Answered
What is an order flow imbalance?
An order flow imbalance is a price where aggressive volume on one side overwhelms the other by a wide ratio, measured by comparing market buys executed at the ask against market sells executed at the bid at that level. It shows who is driving at that exact price.
What does a 3 to 1 imbalance mean in trading?
It means the aggressive side executed triple the volume of the opposing side at that price, the standard threshold for a significant imbalance. Above three to one, the print is treated as meaningful dominance; below it, the fight was balanced and carries no signal.
What is a stacked imbalance?
A stacked imbalance is three or more consecutive prices printing the same directional imbalance. It is the strongest version of the signal, because sustained one-sided aggression across multiple prices is far harder to dismiss as noise than a single print.
Can imbalances give false signals?
Yes. A large one-sided print can be liquidation, one trader closing a position, rather than an attack, and a big buy print at the very top of a move often marks trapped buyers rather than strength. Repetition in an area and confirmation from migrating point-of-control levels separate real dominance from noise.
Once you can read dominance per price, the next layer is watching how that dominance behaves at the edges of the day: absorption at highs and lows, where aggressive orders stop producing movement and the tape quietly changes hands.