Delta: Buying vs Selling Pressure
Delta is the net score of a bar's aggression: every share bought at the ask counts positive, every share sold at the bid counts negative, and the difference tells you which side actually initiated more trade during that bar. Buying pressure minus selling pressure, one number per bar. The earlier lessons in this block defined order flow, the bid and the ask, and the imbalance tags that mark each trade; this lesson owns the per-bar net number those tags feed.

Think of a boxing judge's scorecard: punches landed minus punches taken, because the round belongs to whoever landed more, not whoever swung more. Delta works the same way. A bar with heavy volume means nothing by itself until you know who threw the punches that connected. Delta answers that question in a single integer.
That number is not a prediction. It is a record. You will use it to check whether price and aggression agree, and to spot the bars where they quietly disagree.
How Delta Is Calculated
The formula is one subtraction. Take all volume traded at the ask during the bar, subtract all volume traded at the bid, and the remainder is the bar's Delta. Positive means buyers initiated more. Negative means sellers initiated more. A bar with 4,200 shares lifted at the ask and 3,600 shares hit at the bid prints a Delta of positive 600.
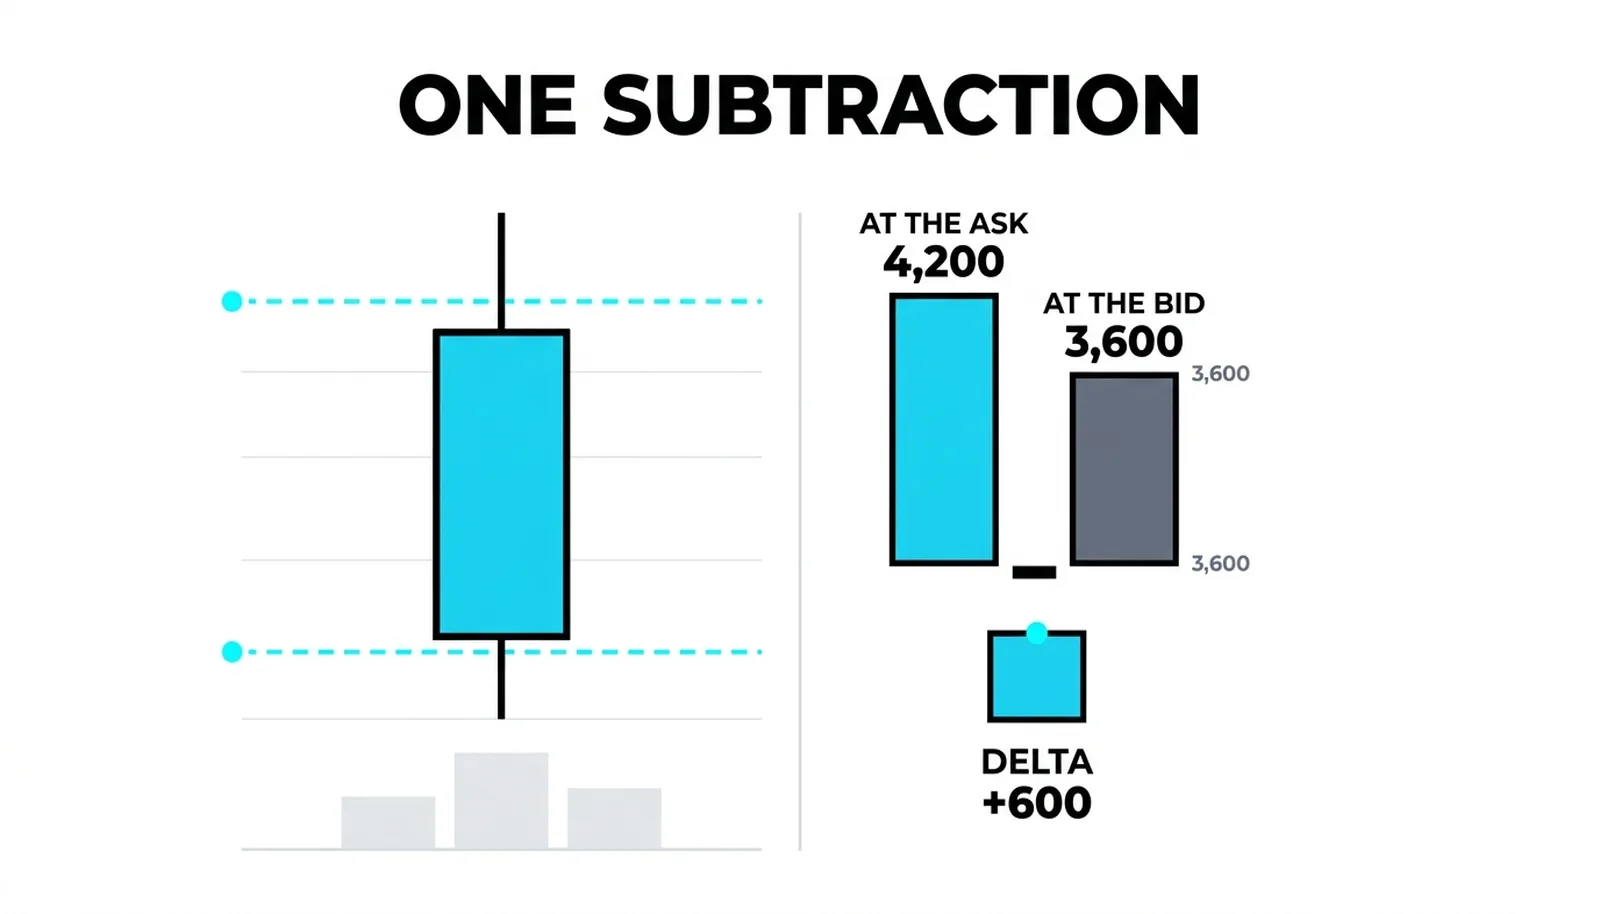
The sign matters more than the size at first. Positive Delta says buyers were the aggressors, they crossed the spread to get in. Negative Delta says sellers were the aggressors, they accepted the bid to get out. Near zero means neither side pushed hard, regardless of how much volume changed hands.
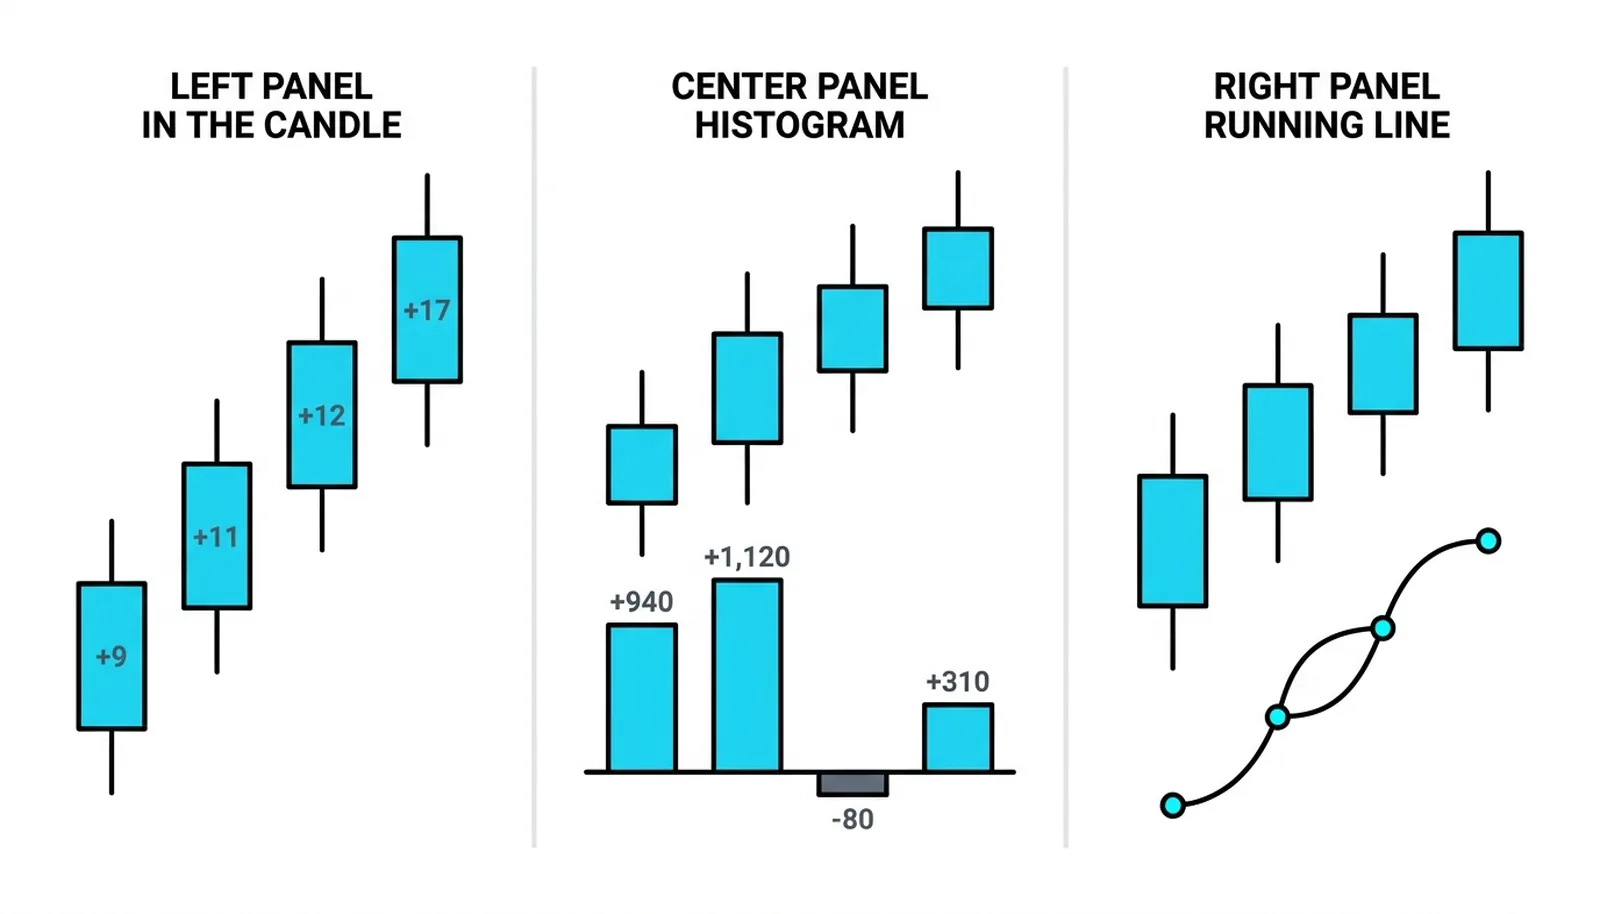
Order flow analysis lists three display variants for the same number, and all three show up in real platforms:
- A number inside each candle. The Delta prints at the foot of the bar, so you read price shape and net aggression in one glance.
- A histogram under the chart. Each bar gets a matching column above or below a zero line, which makes streaks of one-sided aggression easy to spot.
- A running line. The Deltas accumulate across the session into a curve, which previews the cumulative view the next lesson covers in full.
Pick whichever display fits your screen. The underlying arithmetic never changes. What changes is how quickly your eye catches a streak, a flip, or a fade.
One caution on precision: the count depends on the feed classifying each trade as ask-side or bid-side, and fast markets occasionally blur that classification. Treat Delta as a high-quality estimate of aggression, not an exact count.
Confirmation: When Price and Delta Agree
The cleanest read in order flow is agreement. Price rises on a bar and Delta prints positive: buyers initiated, price followed, the move is honest. Price falls and Delta prints negative: sellers initiated, price followed, same story in reverse. The scorecard and the price tape tell one story.
Agreement earns trust because it removes the main alternative explanation. A rising bar with positive Delta is unlikely to be a drift upward on thin, passive filling. Somebody wanted in badly enough to pay the ask, repeatedly, for the whole bar. Trends built from bars like that tend to continue until the aggression dries up.
Watch for agreement in sequences rather than in isolation. Three or four consecutive bars of rising closes with rising positive Delta is a trend announcing itself. The same bars with shrinking positive Delta is a trend running out of aggressors, even while price still climbs. The direction matches, but the conviction behind it is fading.
The caveat that matters most, and the order flow framework states it plainly: it is often the price that anticipates a decisive move rather than Delta. Price can break a level while Delta still looks ordinary, because informed players sometimes work through passive orders that never show up as initiation. Delta reads who is swinging. It does not see the punch before it is thrown. Use it to confirm and to grade quality, never as a crystal ball.
Deviation: When the Scorecard Contradicts the Price
Delta measures initiation, not outcome. A strongly positive bar can close red. Buyers lifted the ask all bar long, and sellers absorbed everything thrown at them, then pushed price lower anyway. The scorecard says one side swung more; the price says the other side took the punches and won the round anyway. That divergence is information, and the lesson on absorption later in this block is built entirely on it.
The reverse happens too. A bar can close higher on negative Delta when sellers hit bids into a rising market and price still ground upward on resting buy interest. Neither case is an error in the data. Both are the market telling you that aggression and control are different things.
A second caution: single-bar Delta is noise-prone. One large fill from one player can flip the number for a bar. A 5,000-share market sell landing in an otherwise quiet five minutes prints a deeply negative Delta that says nothing about the crowd. The figure earns trust in sequences and in context, never as a lone print.
Practical rules for the deviation read:
- Positive Delta, red close, at support: possible absorption, watch the next bar for a hold.
- Negative Delta, green close, at resistance: possible distribution, watch for a stall.
- One extreme print amid ordinary bars: suspect a single large player, discount it.
- Persistent mismatch over many bars: the quiet side is winning, and price will eventually admit it.
What matters is the pattern across bars. A lone Delta print is a quote without context. A run of prints is a conversation.
Five Bars, One Net Score
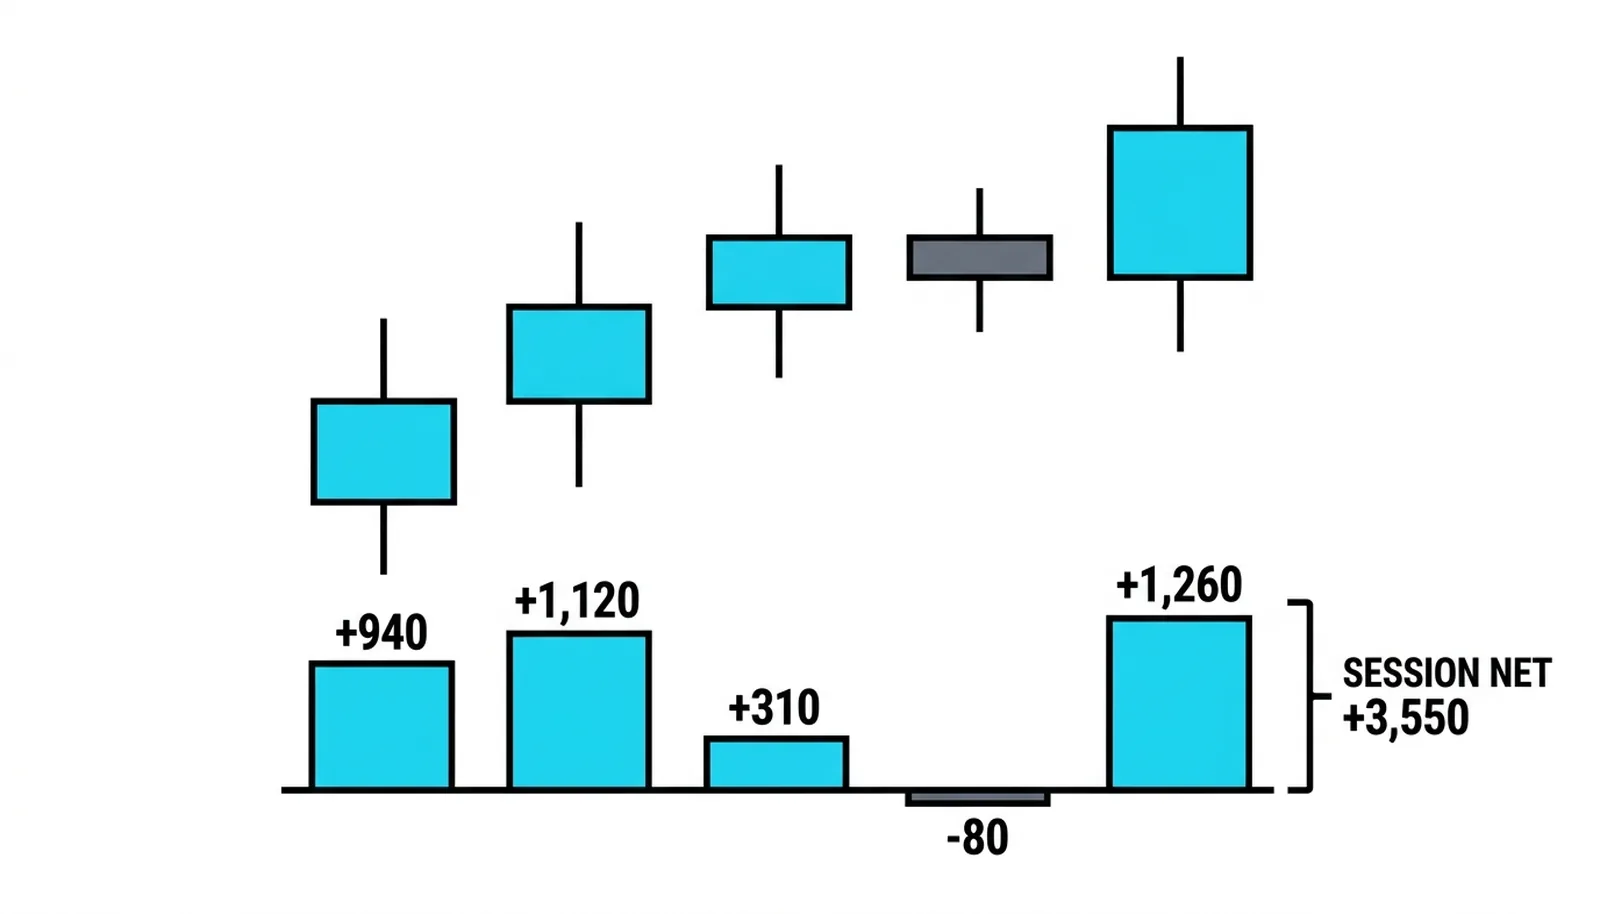
A hypothetical illustration with round numbers. A stock trades five consecutive five-minute bars through a morning. The Delta prints come out: positive 940, positive 1,120, positive 310, negative 80, positive 1,260. Session net: positive 3,550.
Bar one, positive 940. Buyers lifted the ask consistently and price closed higher. Agreement. The morning opens with honest buying.
Bar two, positive 1,120. The strongest aggression of the session, and price extends. Agreement again, conviction rising. The trend is being paid for, not drifted into.
Bar three, positive 310. Price still closes up, but the aggression shrank to a third of the prior bar. Agreement in direction, fading in conviction. Nobody is selling yet, but buyers are no longer chasing.
Bar four is the tell to study. Price closes higher at 84.9, yet Delta dips barely negative: 780 shares sold at the bid against 700 bought at the ask. A coin-flip bar inside an advancing tape. Price rose on almost no net initiation, which means the lift came from thin offers, not from demand. Nobody won that round; price simply drifted where resistance was lightest.
Bar five reasserts. Delta prints positive 1,260, the strongest of the session, and price follows to 85.4. The hesitation in bar four is answered: buyers were pausing, not leaving.
No single bar decided anything in this sequence. Bar four alone looked like a warning. Bar three alone looked like exhaustion. Only the sequence told the real story: strong buying, a breather, then renewed buying, with a session net of positive 3,550 confirming who controlled the morning.
| Bar pattern | Delta sign | The read | The trap |
|---|---|---|---|
| Price up, Delta strongly positive | Positive | Honest buying, trend confirmed | Chasing late after several such bars |
| Price up, Delta fading positive | Positive, shrinking | Conviction thinning, trend aging | Reading direction and ignoring size |
| Price up, Delta near zero or slightly negative | Flat to negative | Drift on thin offers, no real demand | Trusting a green close without aggression |
| Price down, Delta strongly positive | Positive | Buyers absorbed, possible reversal brewing | Calling the bottom on one bar |
Delta, Buying vs Selling Pressure, Answered
What is Delta in order flow?
Delta is the net aggression of a bar: volume bought at the ask minus volume sold at the bid. It tells you which side initiated more trade during that bar, expressed as one positive or negative number.
How is Delta calculated?
Every trade is tagged by whether it executed at the ask or the bid. The platform sums ask-side volume, sums bid-side volume, and subtracts the second from the first. Positive results mean buyers were the aggressors; negative results mean sellers were.
What does negative Delta with a rising price mean?
It means sellers initiated more trades while price still climbed, usually because passive buy orders absorbed the selling and lifted price anyway. It often signals drift on thin offers or quiet absorption, and it warns that the rise lacks aggressive sponsorship.
Is positive Delta always bullish?
No. Positive Delta only confirms that buyers initiated more, not that they won. A strongly positive bar can close red when sellers absorb the buying, and one large fill can distort a single print. Sequences and context decide what the number means.
Delta gives you the per-bar score. The next lesson stacks those scores into cumulative Delta, the running line that shows whether a whole session's aggression is building, fading, or quietly reversing beneath the price.