OBV: On Balance Volume, Explained
The OBV method rests on a claim that still shapes how traders read volume: before price moves in a big way, the money behind it has already started moving, and a running total of volume can expose that early shift. OBV is the simplest serious indicator in this course. It adds the day's volume when price closes higher, subtracts it when price closes lower, and does nothing when the close is unchanged. One accumulator, one rule, sixty years of arguments about what it predicts.

The mental model is a bank passbook. Every up day is a deposit of that day's volume into the running balance. Every down day is a withdrawal. Flat days post no entries. The balance number itself is meaningless, because it depends on where you started the account. Only the direction of the recent entries tells a story, and that is the first thing to internalize about reading this line: never read the level, read the slope.
The idea connects directly to the confirmation logic in volume as confirmation of price moves. OBV is that idea compressed into a single cumulative line that a chart can draw next to price.
The Ledger Math
The rule takes one line. OBV today equals OBV yesterday plus today's volume if the close is higher than yesterday's, minus today's volume if the close is lower, and unchanged if the close matches. Work a five-day ledger with round numbers:
| Day | Close vs prior | Volume | Entry | OBV balance |
|---|---|---|---|---|
| Mon | Higher | 1.2M | Deposit | +1.2M |
| Tue | Higher | 0.9M | Deposit | +2.1M |
| Wed | Lower | 1.4M | Withdrawal | +0.7M |
| Thu | Higher | 1.1M | Deposit | +1.8M |
| Fri | Higher | 1.5M | Deposit | +3.3M |
Five days, four of them green, and the balance climbed from zero to plus 3.3 million shares. Note what the ledger ignores: how big each price move was. A day that closes up 0.1 percent on triple volume posts the same entry as a day that gaps up 4 percent on the same volume. Direction counts, magnitude and size do not, and that blindness is the source of both the tool's simplicity and its main criticisms.
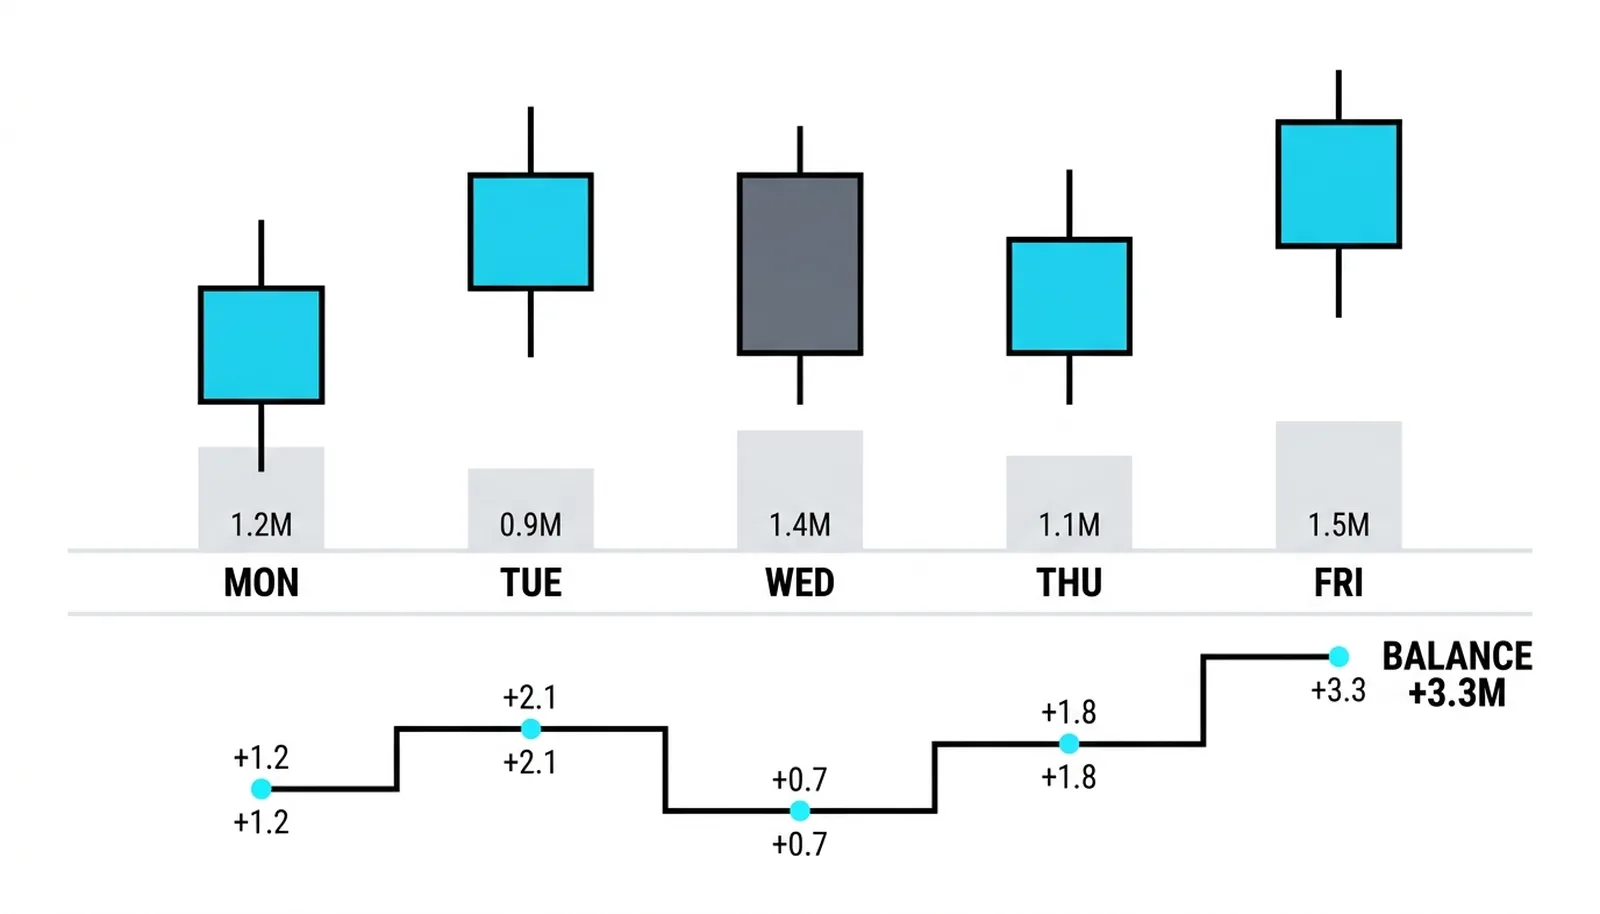
The bottom panel is the passbook in visual form: deposits stack the line up, withdrawals stack it down, and the running balance draws the picture of who has been winning the volume fight.
Confirmation: the Line Agrees
In a healthy uptrend the deposits outnumber the withdrawals, so OBV climbs alongside price. That agreement is the tool working as designed. The check that matters is whether the volume balance supports each leg of the trend, and in a genuine advance it does, third after third.
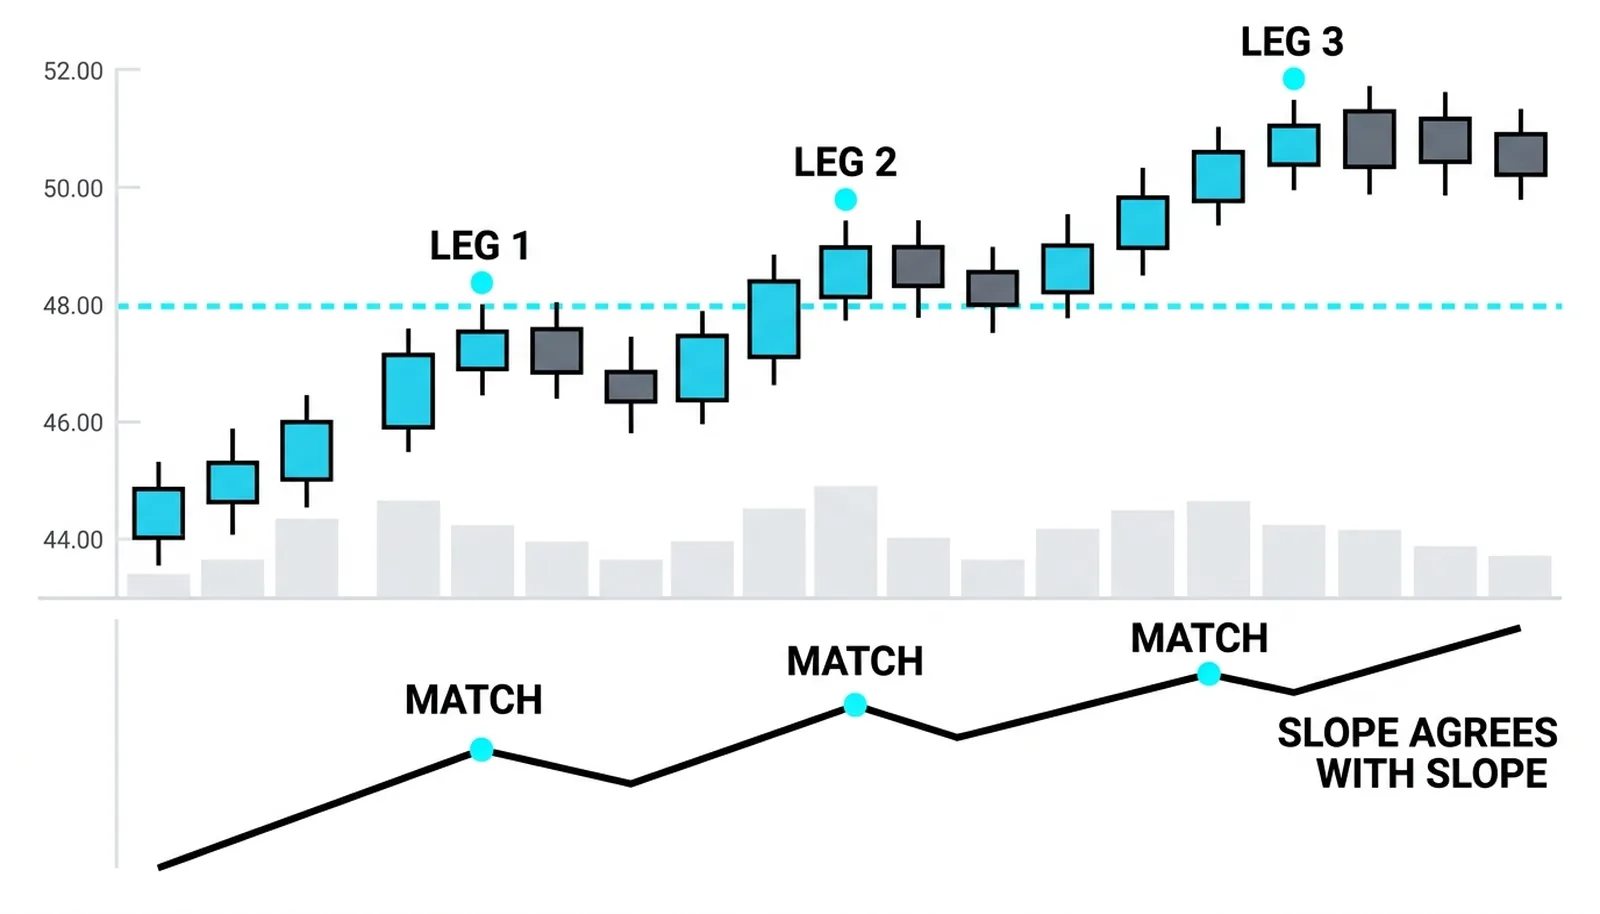
Every leg up in price has a matching leg up in the balance, and every pullback shows withdrawals without breaking the rising pattern. Slope agrees with slope. Nothing is being promised here beyond what the definition says: more volume has traded on up closes than on down closes, which is the definition of demand doing the heavier lifting.
Divergence: the Line Objects
The reading that made the OBV method famous is the one where the line stops agreeing with the chart. Price grinds to a new high, the crowd sees strength, and the running balance quietly refuses to make a matching high. The deposits needed to validate the move never arrived.
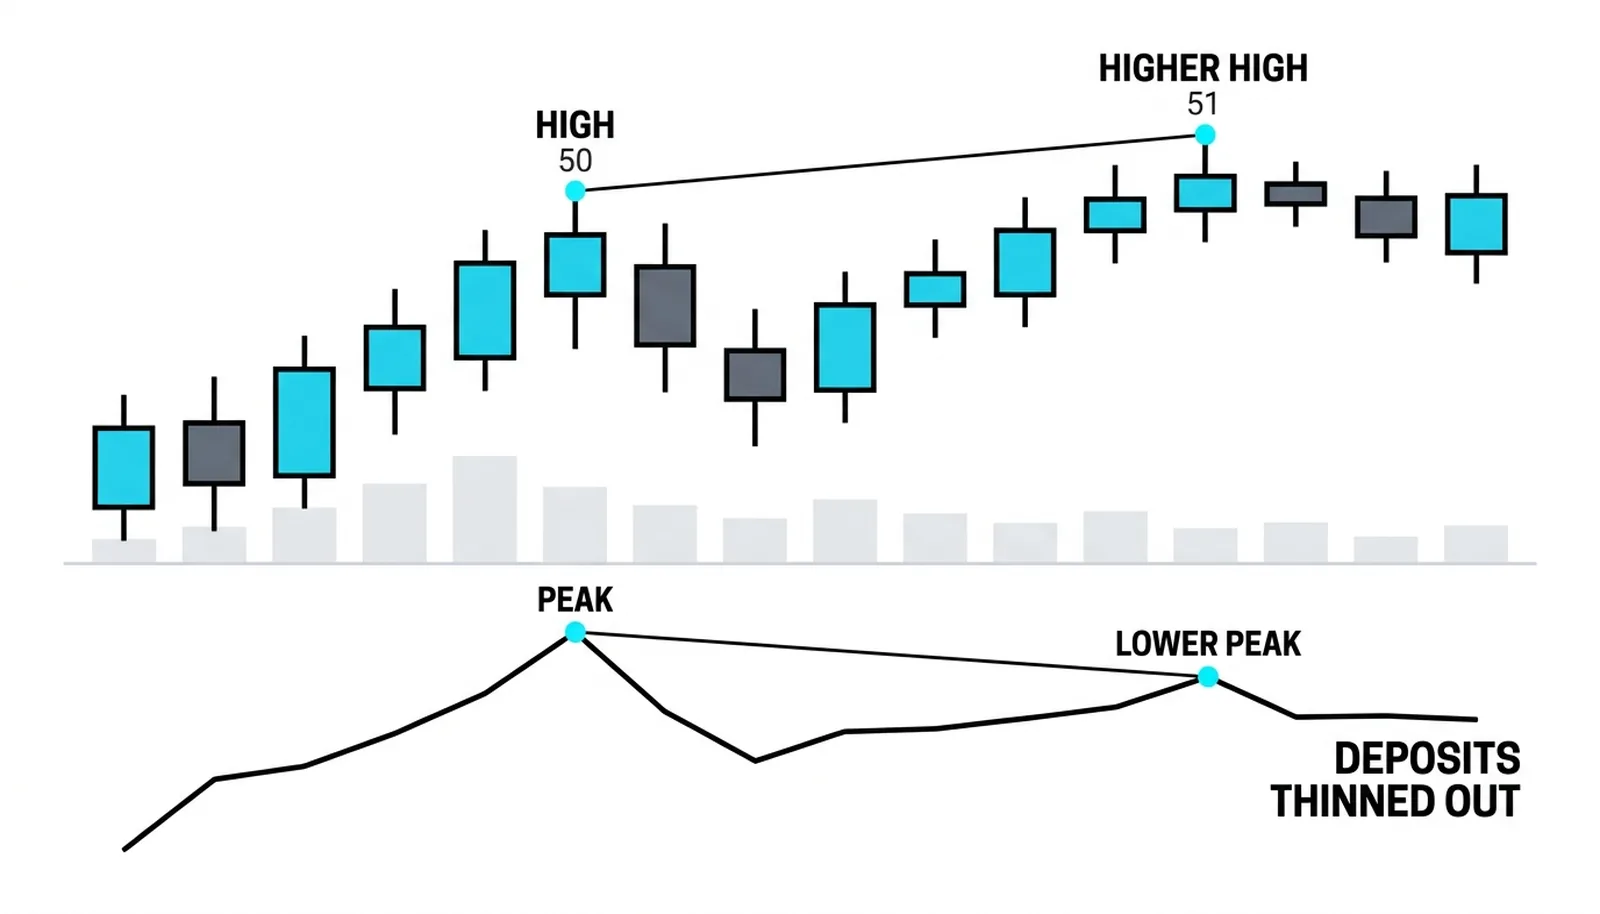
The first high came on deposits that dwarfed the withdrawals. The second high printed a higher price on thinner participation, with real selling underneath, and the balance came in below its old peak. Price said strength; the passbook said the money had thinned out. That is the same warning pattern studied in RSI divergence, except the oscillator here is built from volume rather than from price change, which makes the two tools useful as independent witnesses.
Reading the Slope, Not the Number
The passbook framing earns its keep here, because the same balance can tell two opposite stories depending on where the account started. Run the ledger from the first of January and the final balance might read plus 40 million shares. Run the identical prices and volumes starting from the first of June and it might read plus 8 million. Neither number means anything alone. What both accounts show identically is the shape: a balance that climbed hard through the middle weeks, flattened, and turned down late. The shape is the signal. The starting point is bookkeeping.
That is why every serious OBV reading compares the line to itself. An OBV making new highs alongside price is agreement. An OBV holding below its own old peak while price exceeds the old peak is the objection that matters. Absolute levels never enter the sentence.
Practical Reading Notes
Platforms draw OBV as a single unbroken line, usually in a panel under price, and no settings need tuning because the rule has no period to adjust. That absence of parameters is a quiet advantage: there is nothing to over-fit and nothing to optimize between markets. The trade-off is that OBV cannot be softened. A moving average of OBV smooths the line for readability, though the crossings and slopes of the raw accumulator carry the signal.
A reading habit that works: mark the swing points of the OBV line the way you would mark swing points of price, then check each price swing against its counterpart. Three consecutive price highs with matching or rising OBV highs is a confirmed advance. A price high sandwiched between two falling OBV highs is a trend running on less and less fuel, whatever the candles claim.
On Balance Volume, Answered
Is OBV better than raw volume bars?
It answers a different question. Volume bars describe one bar at a time; OBV accumulates them into a single line you can compare against price swings. For the confirmation test, is the volume agreeing with this trend, the accumulated line reads faster than staring back through weeks of bars.
What does falling OBV in an uptrend mean?
That down days are soaking up more volume than up days are adding, even while price grinds higher. That is the divergence pattern above, and it says the advance runs on thinning participation. It is a warning to tighten risk, and by itself it is not a sell order.
Does OBV work on forex and indexes?
With caveats. Foreign exchange has no centralized volume, so the feed a platform shows is tick volume, and the ledger inherits that approximation. Indexes built from many components carry their own distortions, because the volume of the index is an aggregate of very different members.
What OBV Cannot See
Four limits belong in every reading. The absolute level is arbitrary, so cross-chart comparisons of the balance number are noise; only direction and relative highs and lows carry meaning. Equal closes post nothing, so a day of enormous two-way volume that ends unchanged contributes zero. Size is ignored, in the sense that a 300 million share day counts exactly once, which lets one huge session dominate weeks of ledger entries. And overnight action distorts the up-or-down test, because a gap that never trades intraday still assigns the whole day's volume to whichever side of the close it landed on.
The OBV method's stronger claim, that the line leads price because large players leave their trail in the volume itself, deserves the skeptical reading any sixty-year-old market claim earns. What survives scrutiny is narrower and still useful: OBV is a clean, hard-to-argue-with picture of whether volume agrees with the trend you think you see. When you want a volume reading that also weighs where inside the bar the close landed, the Money Flow Index takes the next step, and the MFI lesson builds it directly on the RSI skeleton.