MFI: The Money Flow Index, Explained
RSI reads price. The Money Flow Index reads price and then asks how much money stood behind each reading. Both are bounded oscillators that map buying and selling pressure onto a 0 to 100 scale, both default to a 14-period lookback, and both flag extremes near the ceiling and the floor. The difference is that every MFI reading has volume inside it, which is why traders describe MFI as RSI with the crowd counted: a price move made on enormous participation registers far harder than the same move made on a trickle.

The picture that separates the two tools: RSI is a scale that weighs price moves alone. MFI weighs each move with the size of the crowd that produced it. A 2 percent rally on five times normal volume and a 2 percent rally on half of normal volume look identical to RSI. To MFI they are different events entirely, and after the RSI lesson the added dimension slots straight in. The volume half of the equation comes from the same source material as the volume lesson.
The Money Flow Math
The formulation below is the one Gene Quong and Avrum Soudack published in Technical Analysis of Stocks and Commodities, and it is what most platforms compute today.
Step one: typical price, which is high plus low plus close divided by three. Step two: money flow, which is typical price times volume for that bar. Step three: the sign. If today's typical price is above yesterday's, the flow is positive; below, negative. Step four: sum the positive flow and the negative flow separately over the lookback, 14 bars by default. Step five: the Money Flow Index equals 100 minus 100 divided by 1 plus the money ratio, where the ratio is positive flow over negative flow.
A worked pair of numbers shows the whole curve. Suppose the 14-day positive flow totals 42.0 million and the negative flow totals 10.5 million. The ratio is 4.0, so MFI equals 100 minus 100 divided by 5, which is 80. Double the negative flow while holding the positive side fixed and the ratio drops to 2.0, giving MFI 66.7. Triple it and the reading falls to 57.1. The reading is a tug-of-war scoreboard: the index approaches 100 as positive flow crowds out negative flow entirely, and approaches 0 in the opposite extreme.
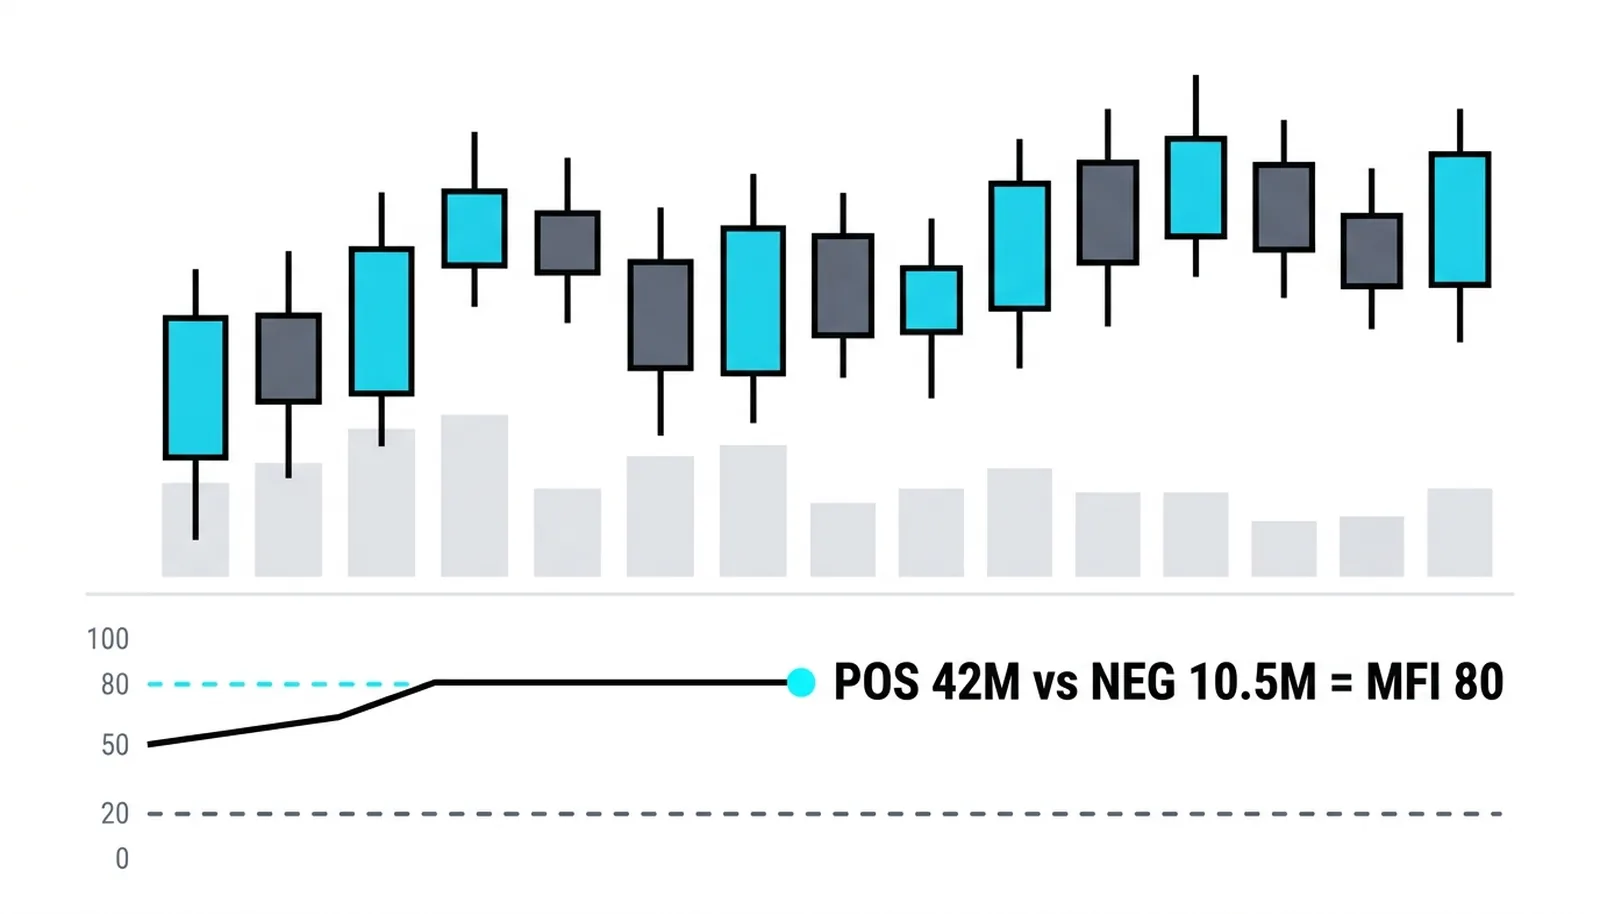
The chart shows the scoreboard reacting to a real event. Six heavy-volume down bars dominate their 14-day window, the negative flow column swamps the positive one, and the index pins near the floor. The price move was only a few percent. The volume behind it was what made the oscillator collapse.
The 80 and 20 Extremes
Quong and Soudack's conventional thresholds are 80 for overbought and 20 for oversold, with 50 acting as the pressure midpoint. Some traders push the bands to 90 and 10 to filter for only the most lopsided readings. The thresholds describe pressure, and they invert as entry signals: readings above 80 mark conditions where buyers have already spent most of their ammunition.
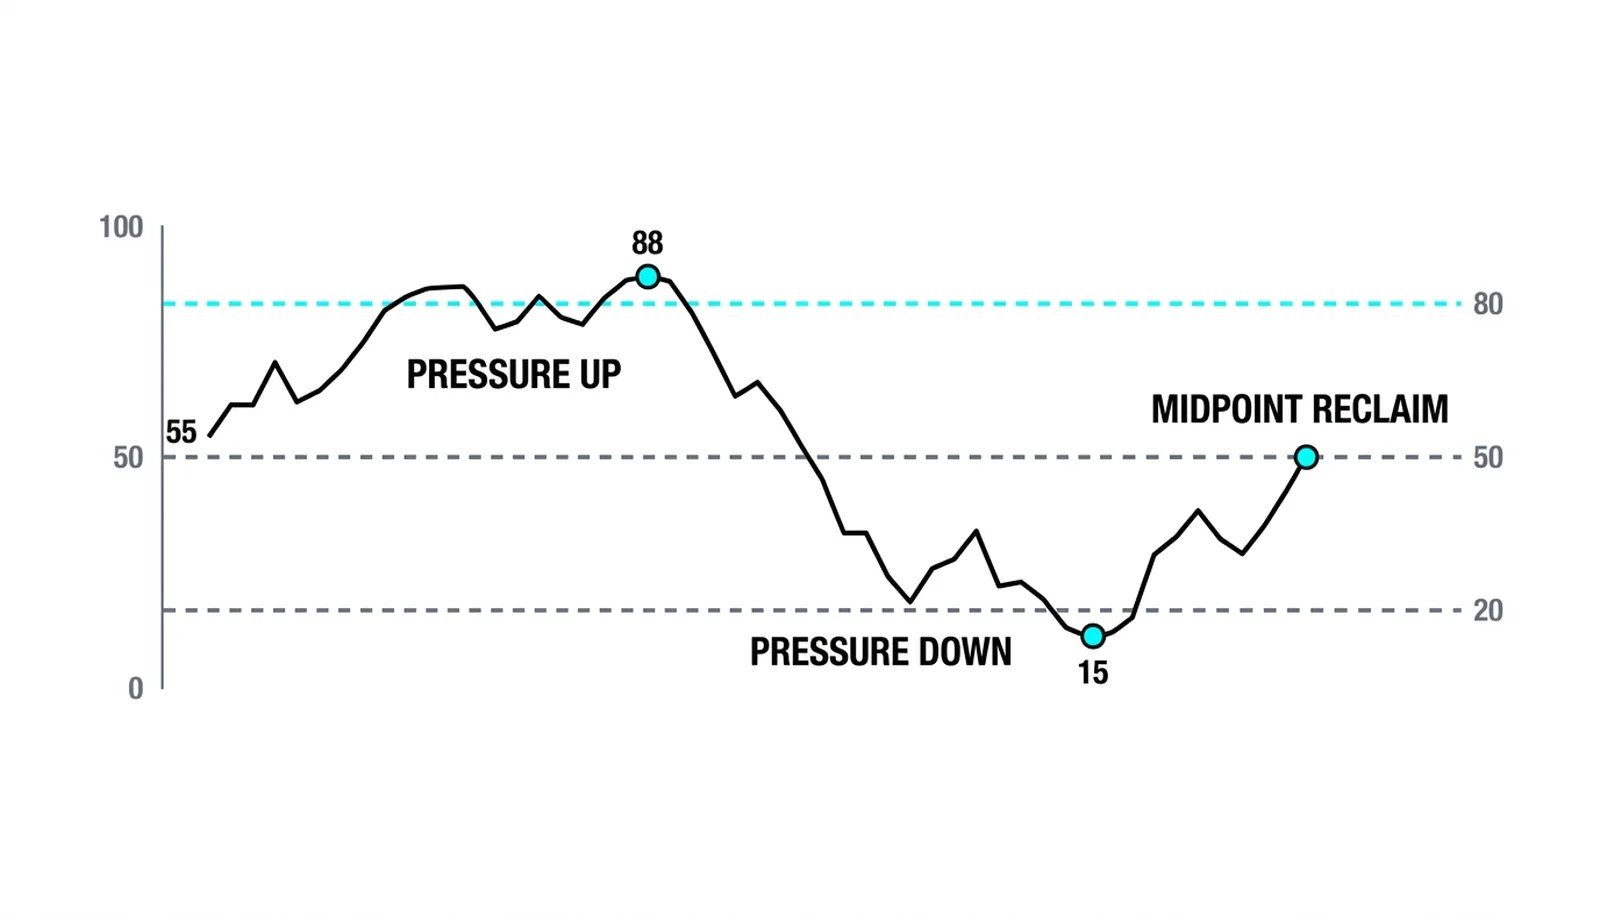
The sequence is the textbook cycle. An uptrend on heavy participation pushes the index over 80. The decline that follows flips the flow balance, drives the reading under 20, and the recovery back through 50 marks the pressure midpoint crossing. Neither extreme means reversal by itself. An index pinned above 80 for two weeks describes a market being bought relentlessly, and the reading only becomes actionable when price structure confirms that the pressure has actually broken.
Divergence: the Second High With Less Money
The highest-value MFI reading is the divergence, because it detects thinning participation at exactly the moment the chart looks strongest.
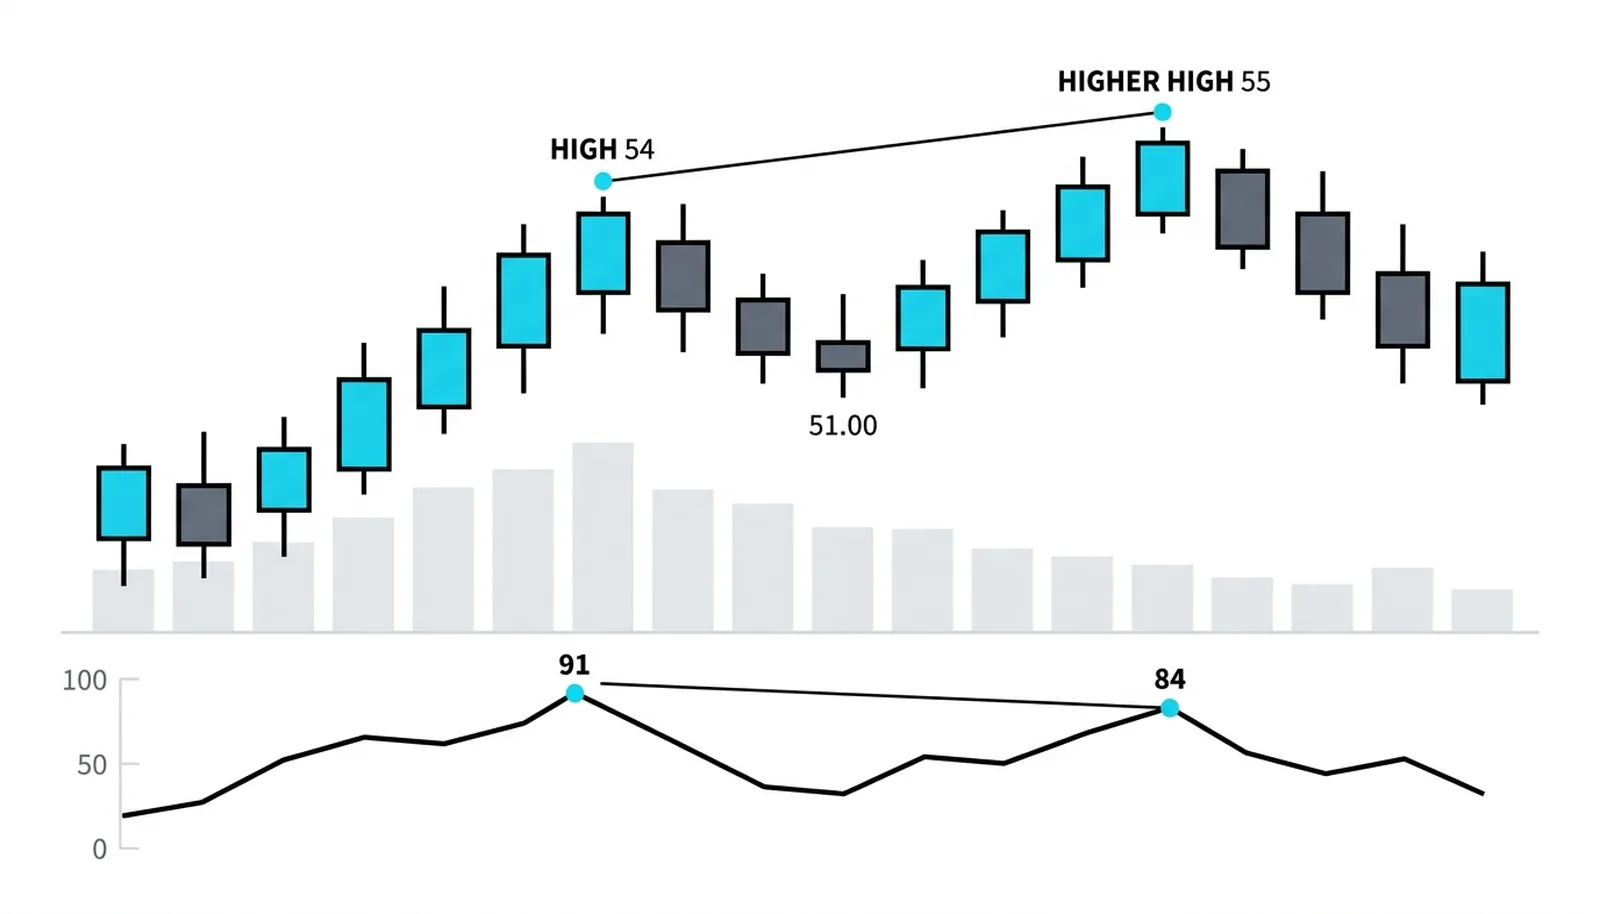
The first high pushed the index to 91 on deposits that dwarfed the withdrawals. The second high printed a higher price with the index reaching only 84, because the volume behind the second rally was thinner and the selling underneath it heavier. Price made its higher high on less money, and the scoreboard caught it. The same pattern appears in the RSI framework as bullish and bearish divergence, and running both oscillators gives two semi-independent witnesses, one price-only, one volume-weighted.
Settings and Failure Modes
The 14-period default suits daily charts and most intraday use. Shorten it and the index gets twitchy, crossing the thresholds often enough that the readings stop meaning much; lengthen it toward 20 or more and the extremes arrive late, after much of the move they describe. Between those failure modes the default is a reasonable compromise, and the thresholds matter more than the period: tightening to 90 and 10 trades fewer signals for higher quality, while loosening to 70 and 30 floods the chart with pressure notes that never become trades.
Two failure modes deserve a name. The first is the momentum regime, where a strong trend keeps the index pinned above 80 for weeks; every day above the threshold feels like a sell signal and every one of them is early. The reading describes pressure, not timing, and only a change in price structure converts it into a trade. The second is the thin-market trap: on a holiday-abbreviated session or a name with fading interest, a handful of ordinary-sized trades can swing the ratio violently. When volume itself is unreliable, the volume-weighted reading inherits the unreliability, and the price-only RSI becomes the better witness for exactly that stretch.
A third caution is definitional rather than technical. Because the index is a ratio of two flow sums, it can sit near 100 during a strong run of positive bars even when the dollar amounts involved are modest relative to the trend's size. Compare the reading against the volume background before treating an extreme as an event.
The Money Flow Index, Answered
Is MFI better than RSI?
Different, and the difference decides the choice. MFI weighs each price move with the volume behind it, which makes it the sharper tool where volume data is good. RSI needs nothing but closes, which makes it the sturdier tool on thin sessions or feeds with unreliable volume. When both flag the same extreme, the reading gets much harder to argue with.
Can MFI stay overbought for a long time?
Weeks, in a real trend. A market being bought relentlessly posts positive flow day after day, and the index pins above 80 the whole way. The threshold describes pressure, and pressure can persist. Timing comes from price structure, not from the oscillator crossing a line.
What period should MFI use?
The default 14 works on daily charts and most intraday use. Shorter periods make the index twitchy and flood the chart with extremes; longer ones push the readings late. Changing the thresholds from 80 and 20 to 90 and 10 is a better first adjustment than changing the period.
MFI Next to Its Cousins
| Tool | Input | What it weighs | Blind spot |
|---|---|---|---|
| RSI | Closing prices | Speed of price change only | No volume; a thin move counts like a heavy one |
| MFI | Typical price and volume | Price change weighted by participation | Still bar-based; ignores where inside the bar trade happened |
| OBV | Closing direction and volume | Cumulative up versus down volume | Ignores move size and close location entirely |
One clarification prevents a common mix-up. The Chaikin accumulation-distribution work uses a term some sources call the money flow multiplier, which measures where the close lands inside the bar's range. That multiplier and the Money Flow Index are different constructions, and the Chaikin family of pressure indicators gets its own lesson next. OBV, covered in the On Balance Volume lesson, is the crudest of the three cousins: a pure running count of direction.
Use MFI when the question is how much money stands behind a price extreme. Use RSI when volume is unreliable or unavailable. When both oscillators agree at an extreme, the pressure reading stops being an opinion and starts being arithmetic.